Qualitative Data
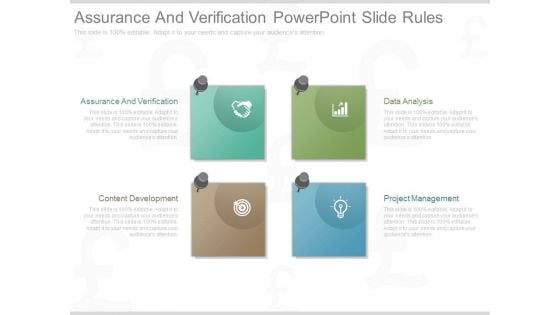
Assurance And Verification Powerpoint Slide Rules
This is a assurance and verification powerpoint slide rules. This is a four stage process. The stages in this process are assurance and verification, content development, data analysis, project management.
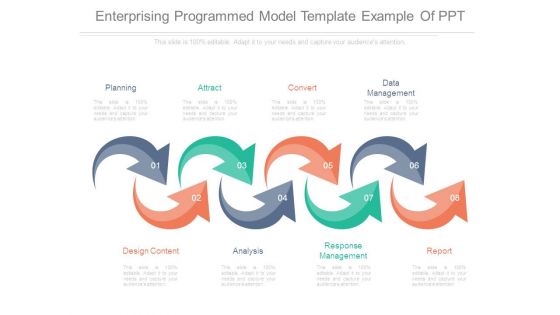
Enterprising Programmed Model Template Example Of Ppt
This is a enterprising programmed model template example of ppt. This is a eight stage process. The stages in this process are `planning, attract, convert, data management, report, response management, analysis, design content.
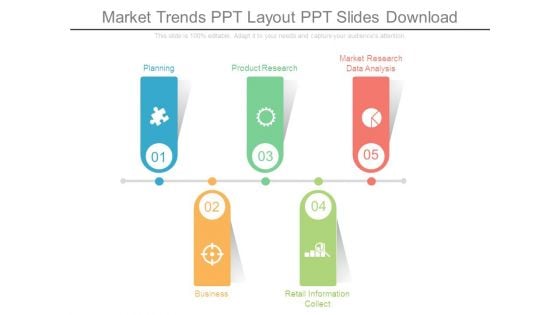
Market Trends Ppt Layout Ppt Slides Download
This is a market trends ppt layout ppt slides download. This is a five stage process. The stages in this process are planning, business, product research, retail information collect, market research data analysis.
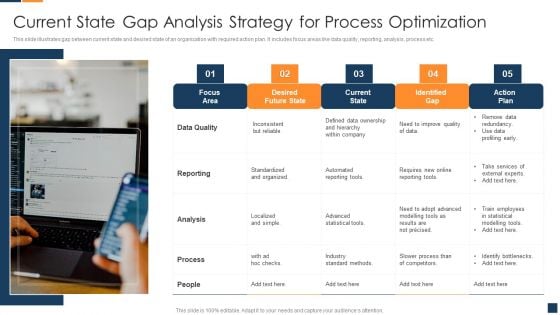
Current State Gap Analysis Strategy For Process Optimization Diagrams PDF
This slide illustrates gap between current state and desired state of an organization with required action plan. It includes focus areas like data quality, reporting, analysis, process etc. Presenting Current State Gap Analysis Strategy For Process Optimization Diagrams PDF to dispense important information. This template comprises five stages. It also presents valuable insights into the topics including Data Quality, Reporting, Analysis. This is a completely customizable PowerPoint theme that can be put to use immediately. So, download it and address the topic impactfully.
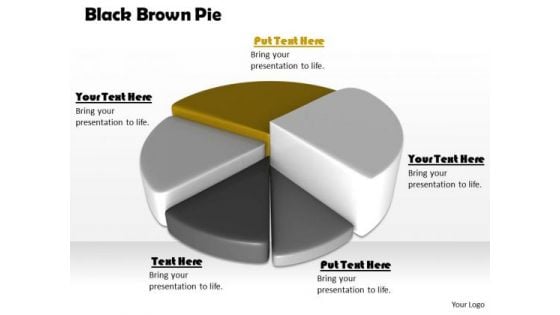
Stock Photo Black Brown Pie Chart For Business Result PowerPoint Slide
This high quality image is designed with pie chart. Use this image to make business reports. Use this outstanding image in presentations relating to data analysis and reports. Go ahead and add charm to your presentations.
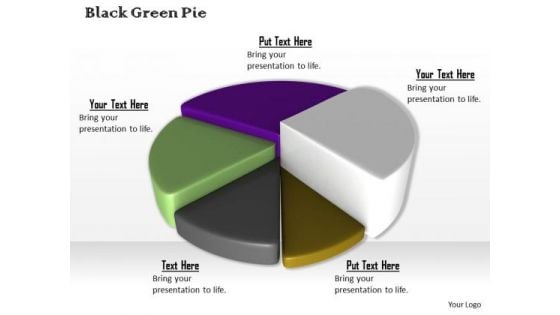
Stock Photo Colorful 3d Pie Chart For Business Result PowerPoint Slide
This high quality image is designed with pie chart. Use this image to make business reports. Use this outstanding image in presentations relating to data analysis and reports. Go ahead and add charm to your presentations.
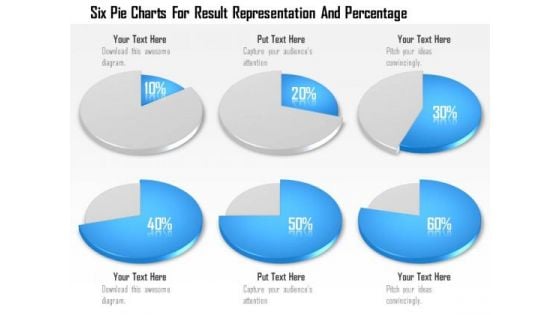
Business Diagram Six Pie Charts For Result Representation And Percentage Presentation Template
Display the concept of result analysis in your business presentation. This PPT slide contains the graphic of six pie charts. Use this PPT slide for your business and marketing data related presentations.
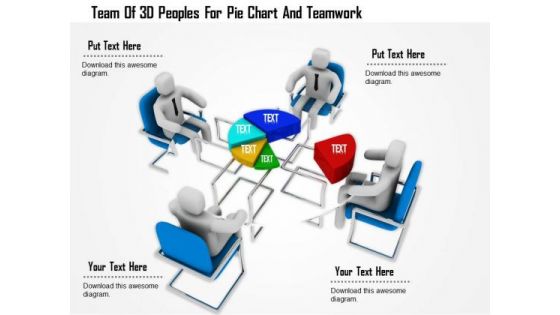
Team Of 3d Peoples For Pie Chart And Teamwork
This Power Point template has been designed with graphic of 3d team forming a pie chart. In this slide team is displaying data analysis. Use this editable slide to build innovative presentation for your viewers.
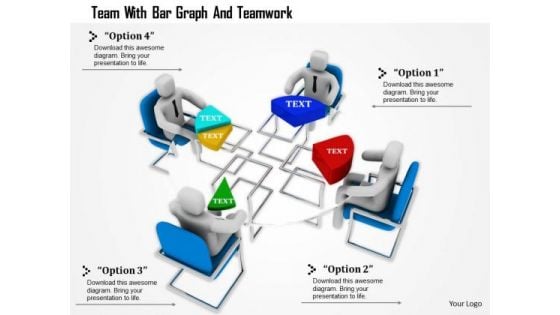
Team With Bar Graph And Teamwork
This Power Point template has been designed with graphic of 3d team forming a pie chart. In this slide team is displaying data analysis and comparison. Use this editable slide to build innovative presentation for your viewers.
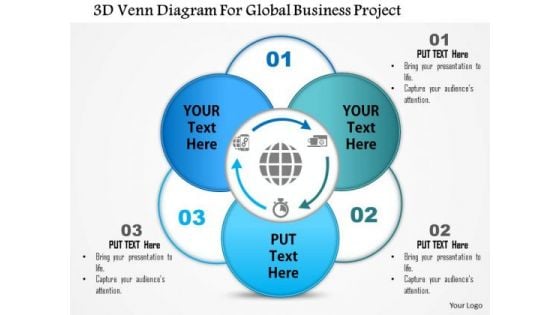
Business Diagram 3d Venn Diagram For Global Business Project Presentation Template
This business diagram displays 3d Venn diagram. This editable slide is suitable to present business reports. Use this diagram for business and finance related topics and display complete data analysis in your presentation.
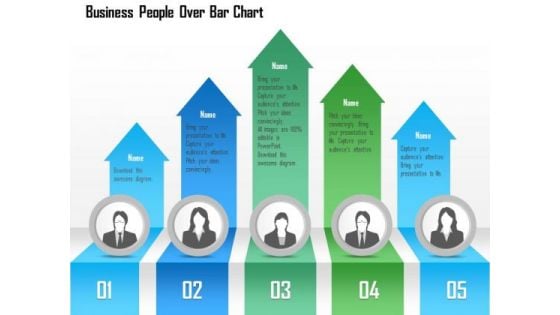
Business Diagram Business People Over Bar Chart PowerPoint Template
This Power Point template has been designed with graphic of business people and bar chart. This PPT contains the concept of result analysis and business data display. Use this PPT slide for your business and marketing related presentations.
Business Diagram Icons And Charts For Business Growth Presentation Template
Our above slide contains graphics of business charts and icons. It helps to display business reports and analysis. Use this diagram to impart more clarity to data and to create more sound impact on viewers.
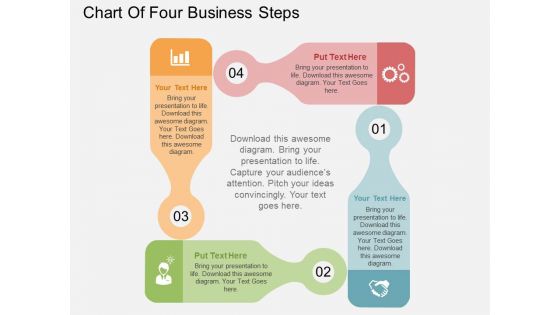
Chart Of Four Business Steps Powerpoint Templates
This business diagram displays flow of four business steps. This editable slide is suitable to present growth management. Use this diagram for business and finance related topics and display complete data analysis in your presentation.
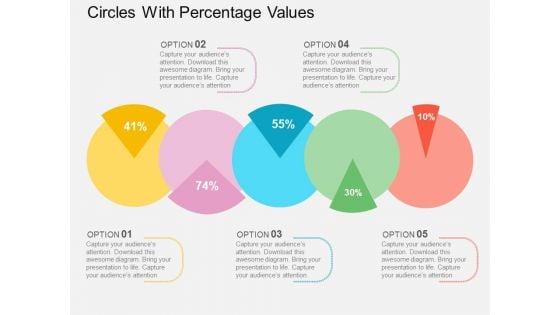
Circles With Percentage Values Powerpoint Templates
This PowerPoint template displays circles with percentage values. This business diagram is suitable for financial data analysis. Use this business diagram slide to highlight the key issues of your presentation.
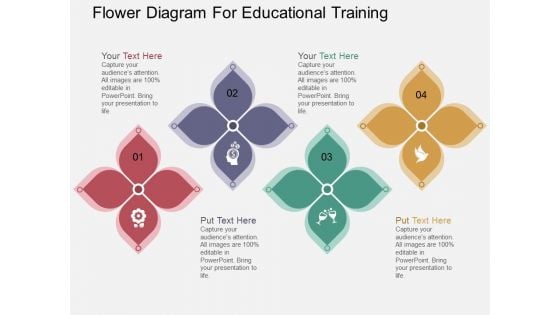
Flower Diagram For Educational Training Powerpoint Template
Colorful flowers have been used to design this PowerPoint diagram. This colorful PPT slide may be used for educational training. You can use this design for data analysis in business presentations
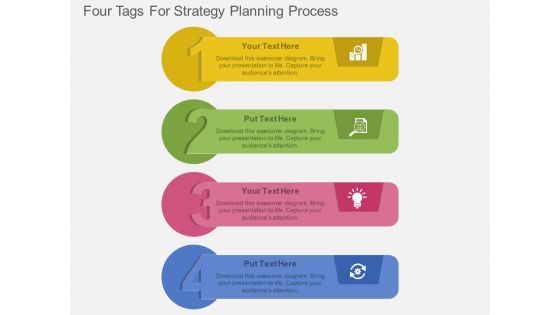
Four Tags For Strategy Planning Process Powerpoint Template
Steps for strategy planning can be explained with this diagram. This PowerPoint template contains diagram of four infographic tags. You can also use this design for data analysis in business presentations
Six Staged Infographics Square With Business Icons Powerpoint Templates
This business diagram displays circular puzzle infographic. This editable slide is suitable to present global communication. Use this diagram for business and finance related topics and display complete data analysis in your presentation.
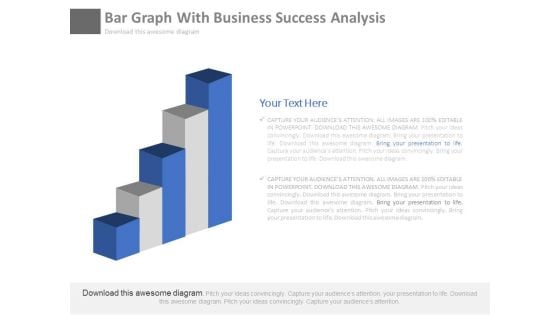
Bar Graph For Marketing Research Process Powerpoint Slides
This PowerPoint template has been designed with diagram of bar graph. This PPT slide can be used to prepare presentations for profit growth report and also for financial data analysis. You can download finance PowerPoint template to prepare awesome presentations.
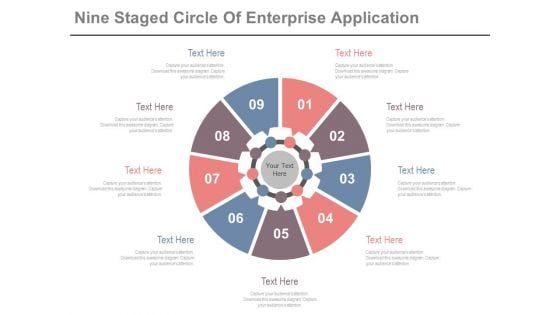
Circle Diagram For Business Marketing Mix Powerpoint Slides
This PowerPoint template has been designed with nine steps circle chart. This PPT slide can be used to prepare presentations for profit growth report and also for financial data analysis. You can download finance PowerPoint template to prepare awesome presentations.
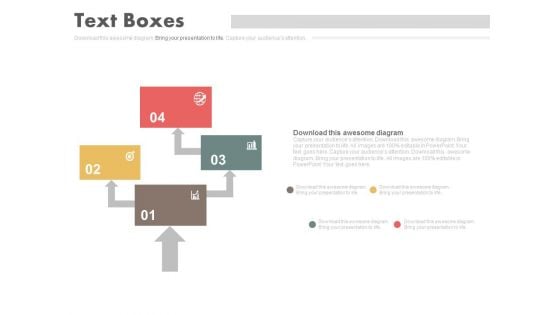
Four Steps Arrow Chart Design Powerpoint Slides
This PowerPoint template has been designed with four steps arrow chart. This PPT slide can be used to prepare presentations for marketing reports and also for financial data analysis. You can download finance PowerPoint template to prepare awesome presentations.
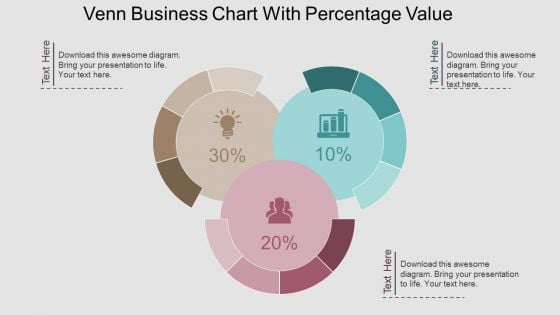
Venn Business Chart With Percentage Value Powerpoint Template
This PPT slide contains Venn business chart with percentage values. This PPT diagram is suitable to present data comparison and analysis. Enlighten others on the process with this innovative PowerPoint template.
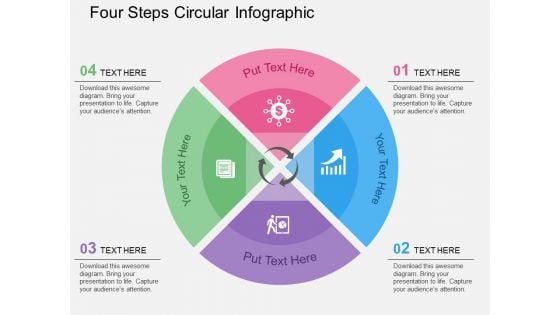
Four Steps Circular Infographic Powerpoint Templates
Our above slide contains diagram of three stage circular infographic. It helps to display global business analysis. Use this diagram to impart more clarity to data and to create more sound impact on viewers.
Four Circles Venn Diagram With Icons Powerpoint Slides
Four circles Venn diagram has been used to design this power point template. This PPT helps to portray the concept of business data analysis. Use this PPT for your business and marketing related presentations.
Two Circles Venn Diagram With Icons Powerpoint Slides
Venn diagram of two circles has been used to design this power point template. This PPT helps to portray the concept of business data analysis. Use this PPT for your business and marketing related presentations.
Curve Line Diagram With Icons Powerpoint Template
Our above slide contains diagram of curve line infographic. This infographic slide helps to exhibit business analysis. Use this diagram to impart more clarity to data and to create more sound impact on viewers.
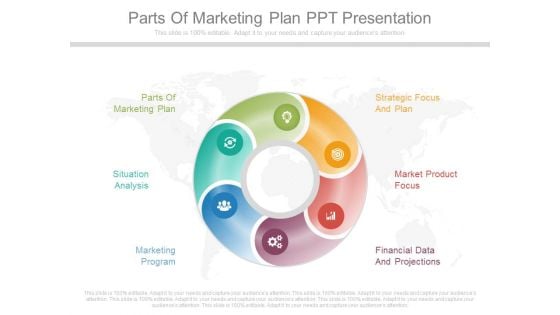
Parts Of Marketing Plan Ppt Presentation
This is a parts of marketing plan ppt presentation. This is a six stage process. The stages in this process are parts of marketing plan, strategic focus and plan, situation analysis, market product focus, marketing program, financial data and projections.
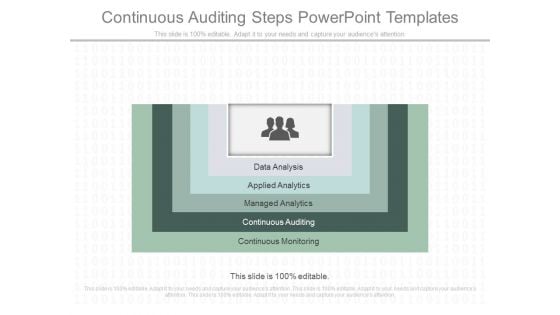
Continuous Auditing Steps Powerpoint Templates
This is a continuous auditing steps powerpoint templates. This is a five stage process. The stages in this process are data analysis, applied analytics, managed analytics, continuous auditing, continuous monitoring.
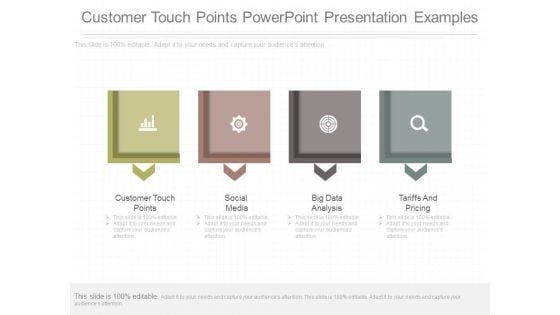
Customer Touch Points Powerpoint Presentation Examples
This is a customer touch points powerpoint presentation examples. This is a four stage process. The stages in this process are customer touch points, social media, big data analysis, tariffs and pricing.
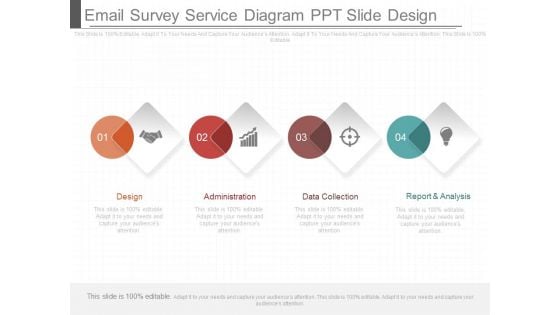
Email Survey Service Diagram Ppt Slide Design
This is a email survey service diagram ppt slide design. This is a four stage process. The stages in this process are design, administration, data collection, report and analysis.
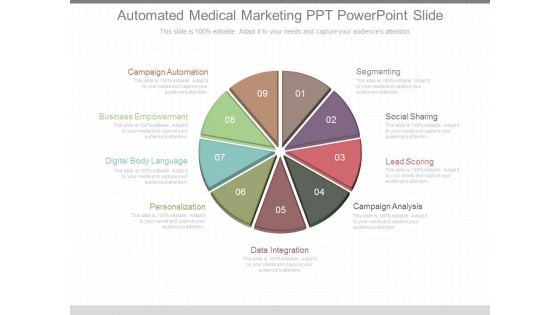
Automated Medical Marketing Ppt Powerpoint Slide
This is an automated medical marketing ppt powerpoint slide. This is a nine stage process. The stages in this process are campaign automation, segmenting, business empowerment, social sharing, lead scoring, lead scoring, digital body language, campaign analysis, data integration.

Storage Resource Management Ppt Slides
This is a storage resource management ppt slides. This is a one stage process. The stages in this process are data collection, analysis report generation, qsm repository, threshold checker, presentation.\n\n\n\n\n\n
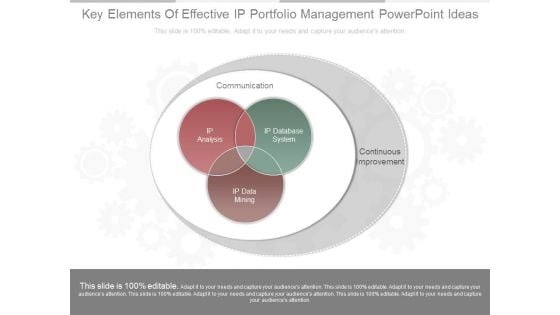
Key Elements Of Effective Ip Portfolio Management Powerpoint Ideas
This is a key elements of effective ip portfolio management powerpoint ideas. This is a three stage process. The stages in this process are communication, continuous improvement, ip analysis, ip database system, ip data mining.
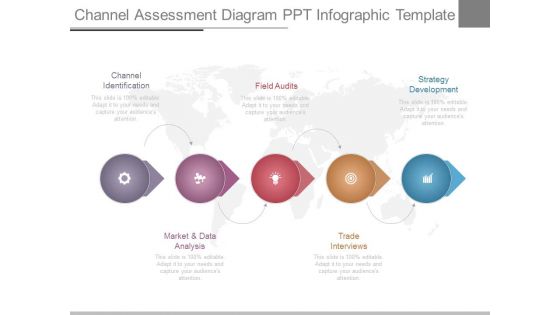
Channel Assessment Diagram Ppt Infographic Template
This is a channel assessment diagram ppt infographic template. This is a five stage process. The stages in this process are channel identification, market and data analysis, field audits, trade interviews, strategy development.
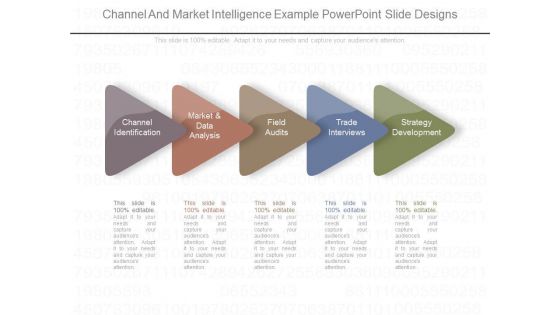
Channel And Market Intelligence Example Powerpoint Slide Designs
This is a channel and market intelligence example powerpoint slide designs. This is a five stage process. The stages in this process are channel identification, market and data analysis, field audits, trade interviews, strategy development.
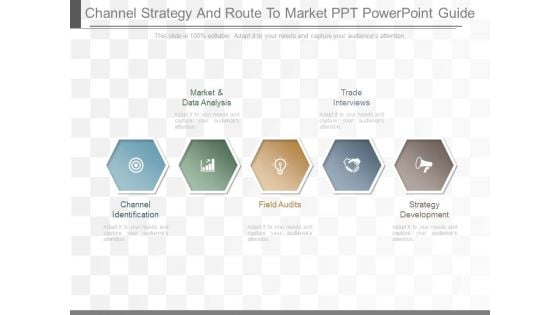
Channel Strategy And Route To Market Ppt Powerpoint Guide
This is a channel strategy and route to market ppt powerpoint guide. This is a five stage process. The stages in this process are market and data analysis, trade interviews, channel identification, field audits, strategy development.
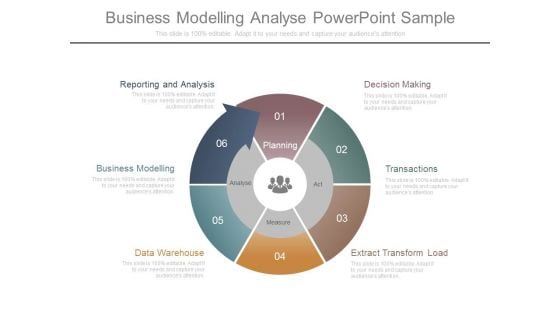
Business Modelling Analyse Powerpoint Sample
This is a business modelling analyse powerpoint sample. This is a six stage process. The stages in this process are decision making, transactions, extract transform load, data warehouse, business modelling, reporting and analysis, planning, act, measure, analyse.
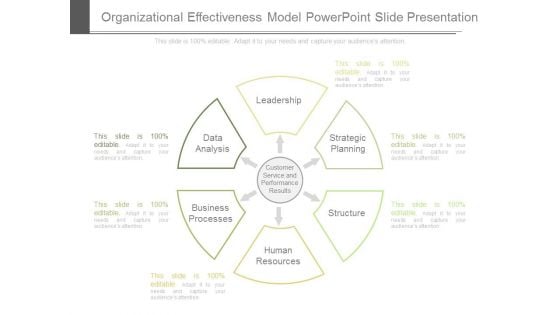
Organizational Effectiveness Model Powerpoint Slide Presentation
This is a organizational effectiveness model powerpoint slide presentation. This is a six stage process. The stages in this process are leadership, strategic planning, structure, human resources, business processes, data analysis, customer service and performance results.
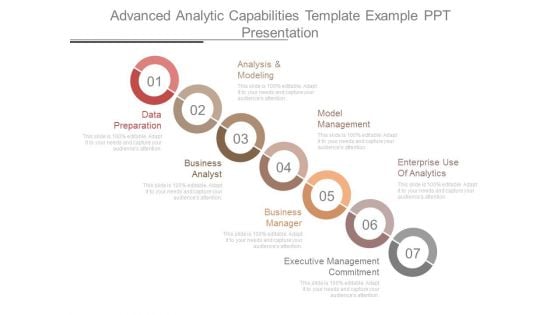
Advanced Analytic Capabilities Template Example Ppt Presentation
This is a advanced analytic capabilities template example ppt presentation. This is a seven stage process. The stages in this process are analysis and modeling, model management, enterprise use of analytics, data preparation, business analyst, business manager, executive management commitment
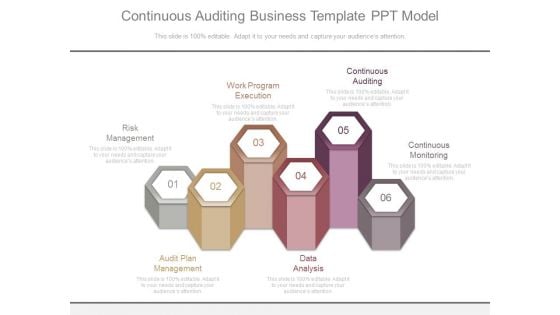
Continuous Auditing Business Template Ppt Model
This is a continuous auditing business template ppt model. This is a six stage process. The stages in this process are risk management, work program execution, continuous auditing, audit plan management, data analysis, continuous monitoring.
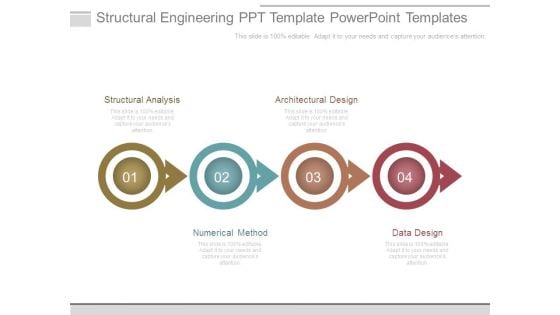
Structural Engineering Ppt Template Powerpoint Templates
This is a structural engineering ppt template powerpoint templates. This is a four stage process. The stages in this process are structural analysis, architectural design, numerical method, data design.
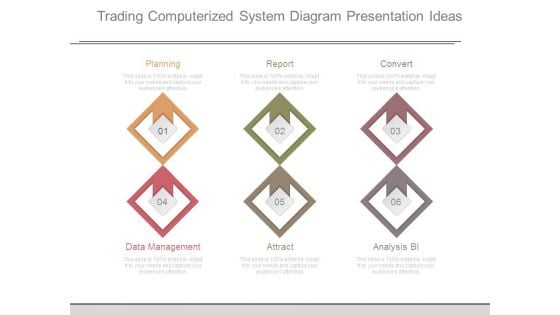
Trading Computerized System Diagram Presentation Ideas
This is a trading computerized system diagram presentation ideas. This is a six stage process. The stages in this process are planning, report, convert, data management, attract, analysis bi.
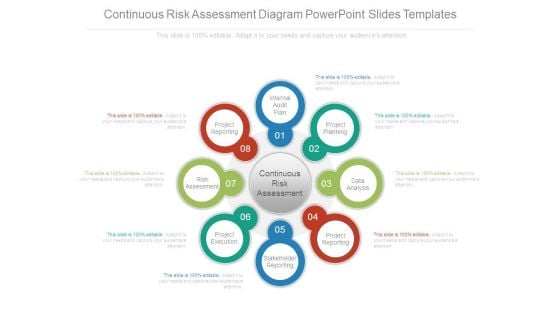
Continuous Risk Assessment Diagram Powerpoint Slides Templates
This is a continuous risk assessment diagram powerpoint slides templates. This is a eight stage process. The stages in this process are internal audit plan, project planning, data analysis, project reporting, stakeholder reporting, project execution, risk assessment, project reporting.
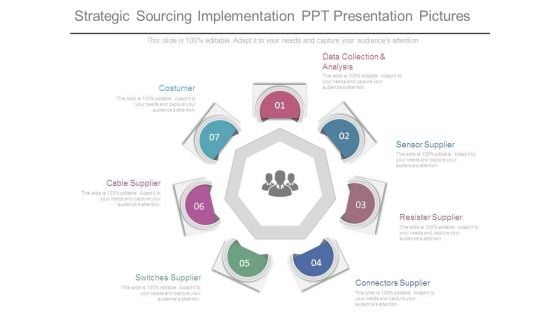
Strategic Sourcing Implementation Ppt Presentation Pictures
This is a strategic sourcing implementation ppt presentation pictures. This is a seven stage process. The stages in this process are data collection and analysis, sensor supplier, resister supplier, connectors supplier, switches supplier, cable supplier, costumer.
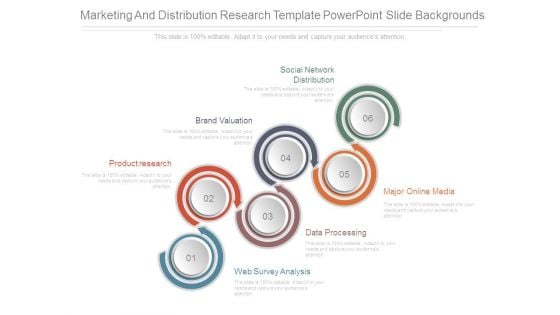
Marketing And Distribution Research Template Powerpoint Slide Backgrounds
This is a marketing and distribution research template powerpoint slide backgrounds. This is a six stage process. The stages in this process are product research, brand valuation, social network distribution, major online media, data processing, web survey analysis.
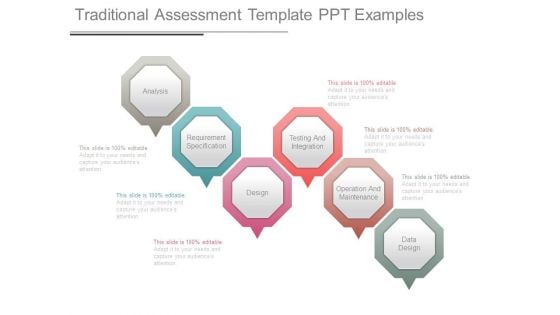
Traditional Assessment Template Ppt Examples
This is a traditional assessment template ppt examples. This is a six stage process. The stages in this process are analysis, requirement specification, design, testing and integration, operation and maintenance, data design.
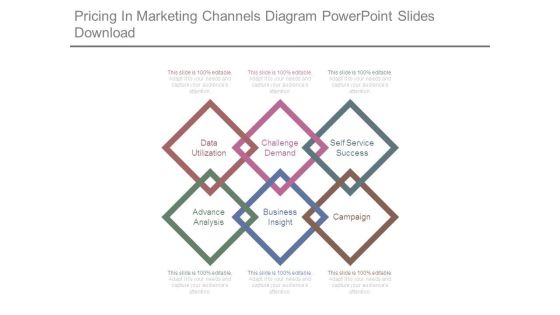
Pricing In Marketing Channels Diagram Powerpoint Slides Download
This is a pricing in marketing channels diagram powerpoint slides download. This is a six stage process. The stages in this process are data utilization, challenge demand, self service success, advance analysis, business insight, campaign.
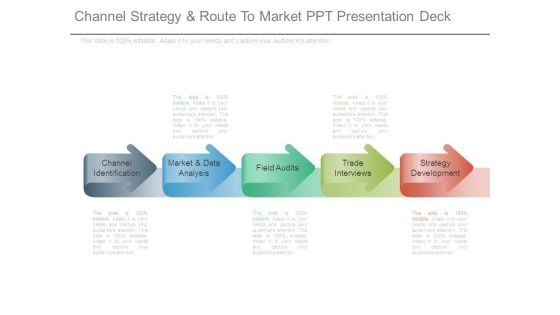
Channel Strategy And Route To Market Ppt Presentation Deck
This is a channel strategy and route to market ppt presentation deck. This is a five stage process. The stages in this process are channel identification, market and data analysis, field audits, trade interviews, strategy development.
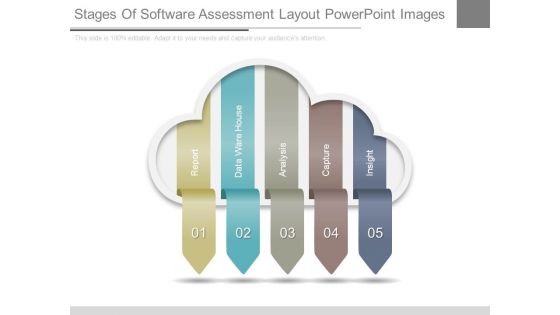
Stages Of Software Assessment Layout Powerpoint Images
This is a stages of software assessment layout powerpoint images. This is a five stage process. The stages in this process are report, data ware house, analysis, capture, insight.
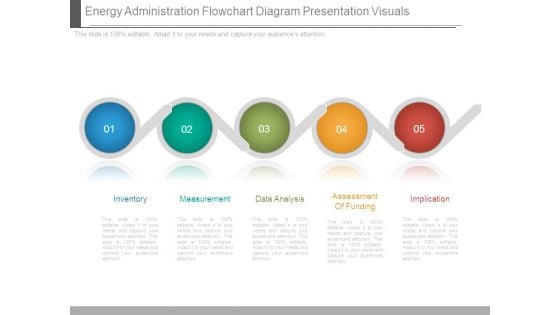
Energy Administration Flowchart Diagram Presentation Visuals
This is a energy administration flowchart diagram presentation visuals. This is a five stage process. The stages in this process are inventory, measurement, data analysis, assessment of funding, implication.

Siem Process Template Powerpoint Slides
This is a siem process template powerpoint slides. This is a six stage process. The stages in this process are add value, reporting, data collection, dashboard, log analysis, log retention.
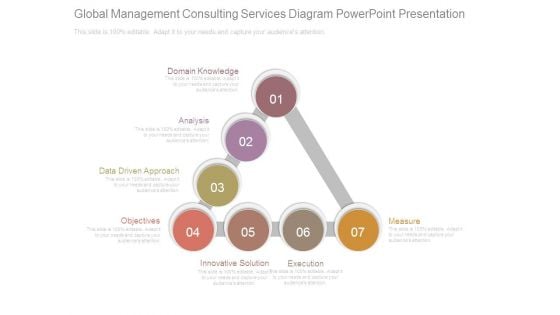
Global Management Consulting Services Diagram Powerpoint Presentation
This is a global management consulting services diagram powerpoint presentation. This is a seven stage process. The stages in this process are domain knowledge, analysis, data driven approach, objectives, innovative solution, execution, measure.
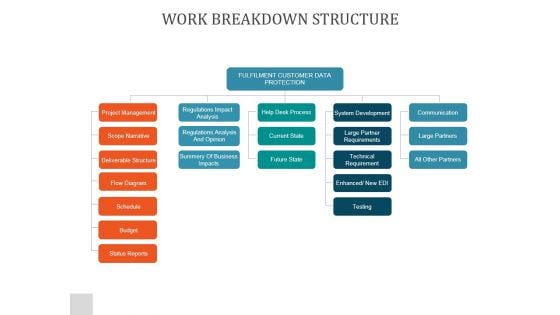
Work Breakdown Structure Ppt PowerPoint Presentation Infographics
This is a work breakdown structure ppt powerpoint presentation infographics. This is a five stage process. The stages in this process are fulfilment customer data protection, project management, regulations impact analysis, help desk process, system development, communication, scope narrative.
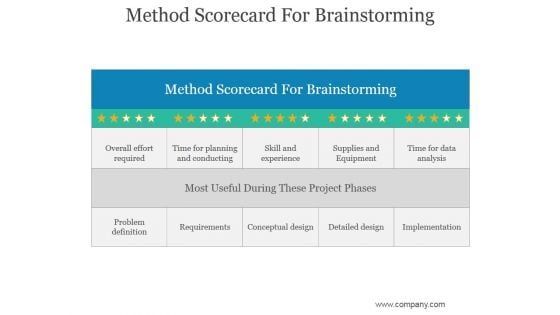
Method Scorecard For Brainstorming Ppt PowerPoint Presentation Introduction
This is a method scorecard for brainstorming ppt powerpoint presentation introduction. This is a five stage process. The stages in this process are time for planning and conducting, overall effort required, skill and experience, time for data analysis, problem definition.
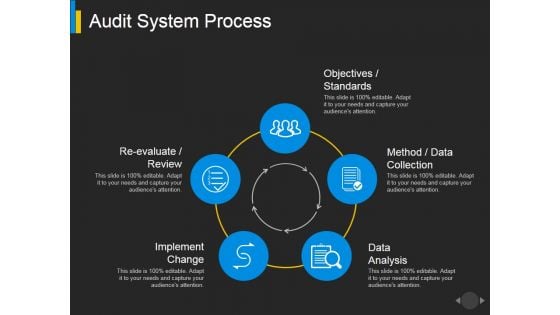
Audit System Process Ppt PowerPoint Presentation File Shapes
This is a audit system process ppt powerpoint presentation file shapes. This is a five stage process. The stages in this process are data analysis, implement change, objectives standards.

Portfolio Revision Ppt PowerPoint Presentation Gallery File Formats
This is a portfolio revision ppt powerpoint presentation gallery file formats. This is a two stage process. The stages in this process are current portfolio, new portfolio, data analysis.

Business Performance Management Ppt PowerPoint Presentation Complete Deck With Slides

Investment Crowdfunding Ppt PowerPoint Presentation Complete Deck With Slides
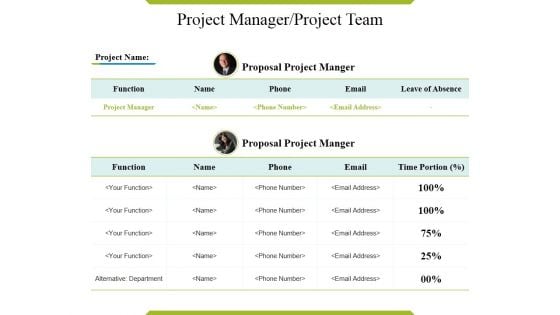
Project Manager Project Team Ppt PowerPoint Presentation Slides Show
This is a project manager project team ppt powerpoint presentation slides show. This is a five stage process. The stages in this process are business, marketing, strategy, table, data analysis.
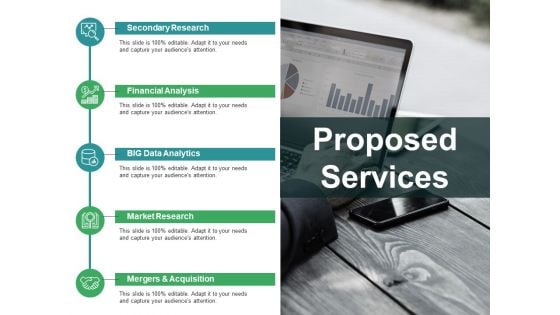
Proposed Services Ppt PowerPoint Presentation Pictures Backgrounds
This is a proposed services ppt powerpoint presentation pictures backgrounds. This is a five stage process. The stages in this process are secondary research, financial analysis, big data analytics, market research.
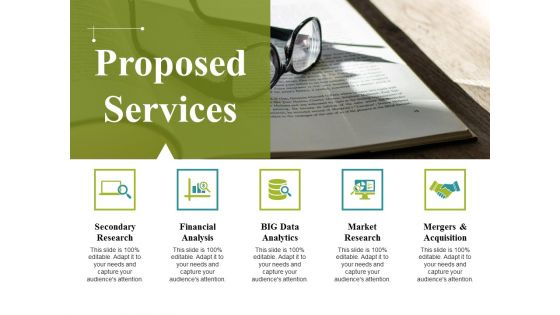
Proposed Services Ppt PowerPoint Presentation Summary Graphics
This is a proposed services ppt powerpoint presentation summary graphics. This is a five stage process. The stages in this process are secondary research, financial analysis, big data analytics, market research, mergers and acquisition.


 Continue with Email

 Home
Home


