Quality Control Dashboard

Quarterly Report To Analyze Marketing Revenue Quarterly Report Ppt Sample
This slide highlights key revenue sources, including data access fees and product sales, alongside detailed expense allocations, with seminars and staff compensation leading costs. If your project calls for a presentation, then Slidegeeks is your go-to partner because we have professionally designed, easy-to-edit templates that are perfect for any presentation. After downloading, you can easily edit Quarterly Report To Analyze Marketing Revenue Quarterly Report Ppt Sample and make the changes accordingly. You can rearrange slides or fill them with different images. Check out all the handy templates This slide highlights key revenue sources, including data access fees and product sales, alongside detailed expense allocations, with seminars and staff compensation leading costs.
Statistical Data Analysis Process Hypotheses Testing Ppt Slide
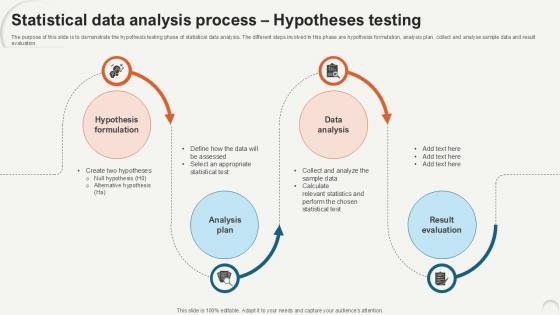
The purpose of this slide is to demonstrate the hypothesis testing phase of statistical data analysis. The different steps involved in this phase are hypothesis formulation, analysis plan, collect and analyse sample data and result evaluation. There are so many reasons you need a Statistical Data Analysis Process Hypotheses Testing Ppt Slide. The first reason is you can not spend time making everything from scratch, Thus, Slidegeeks has made presentation templates for you too. You can easily download these templates from our website easily. The purpose of this slide is to demonstrate the hypothesis testing phase of statistical data analysis. The different steps involved in this phase are hypothesis formulation, analysis plan, collect and analyse sample data and result evaluation.
Working Mechanism Of Monte Carlo Simulation Data Analytics SS V
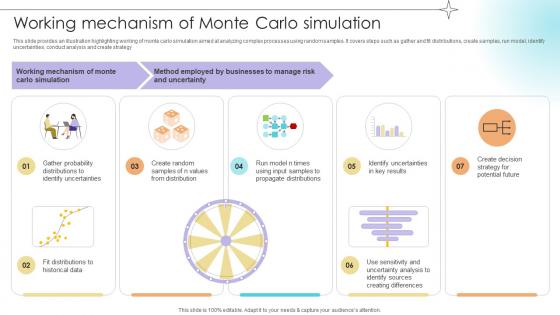
This slide provides an illustration highlighting working of monte carlo simulation aimed at analyzing complex processes using random samples. It covers steps such as gather and fit distributions, create samples, run model, identify uncertainties, conduct analysis and create strategy.Slidegeeks has constructed Working Mechanism Of Monte Carlo Simulation Data Analytics SS V after conducting extensive research and examination. These presentation templates are constantly being generated and modified based on user preferences and critiques from editors. Here, you will find the most attractive templates for a range of purposes while taking into account ratings and remarks from users regarding the content. This is an excellent jumping-off point to explore our content and will give new users an insight into our top-notch PowerPoint Templates. This slide provides an illustration highlighting working of monte carlo simulation aimed at analyzing complex processes using random samples. It covers steps such as gather and fit distributions, create samples, run model, identify uncertainties, conduct analysis and create strategy.
Best AI Tool For Media Monitoring Brand24 Ppt File Format PDF
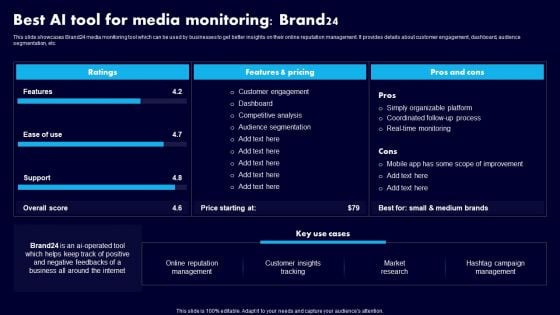
This slide showcases Brand24 media monitoring tool which can be used by businesses to get better insights on their online reputation management. It provides details about customer engagement, dashboard, audience segmentation, etc. If your project calls for a presentation, then Slidegeeks is your go-to partner because we have professionally designed, easy-to-edit templates that are perfect for any presentation. After downloading, you can easily edit Best AI Tool For Media Monitoring Brand24 Ppt File Format PDF and make the changes accordingly. You can rearrange slides or fill them with different images. Check out all the handy templates
Role Of Data Analytics In Decision Making Cybernetic Systems Slides Pdf
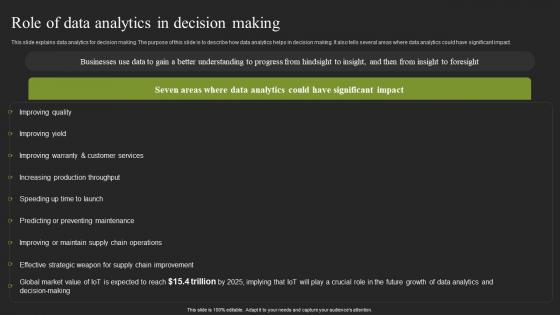
This slide explains data analytics for decision making. The purpose of this slide is to describe how data analytics helps in decision making. It also tells several areas where data analytics could have significant impact. From laying roadmaps to briefing everything in detail, our templates are perfect for you. You can set the stage with your presentation slides. All you have to do is download these easy to edit and customizable templates. Role Of Data Analytics In Decision Making Cybernetic Systems Slides Pdf will help you deliver an outstanding performance that everyone would remember and praise you for. Do download this presentation today. This slide explains data analytics for decision making. The purpose of this slide is to describe how data analytics helps in decision making. It also tells several areas where data analytics could have significant impact.
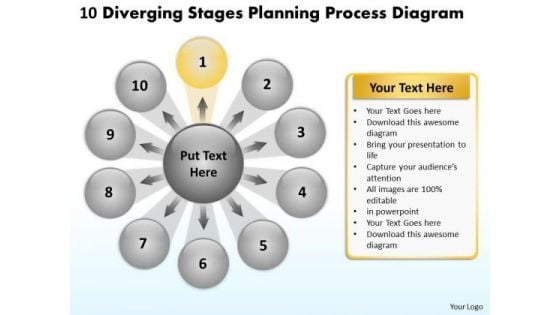
10 Diverging Stages Planning Process Diagram Radial Chart PowerPoint Templates
We present our 10 diverging stages planning process diagram Radial Chart PowerPoint templates.Present our Arrows PowerPoint Templates because you can Show them how to churn out fresh ideas. Present our Flow charts PowerPoint Templates because you can see In any endeavour people matter most. Download our Business PowerPoint Templates because this template helps you to grab the attention of your listeners. Use our Process and Flows PowerPoint Templates because you can enlighten your skills with the help of our topical templates. Download and present our Circle charts PowerPoint Templates because you have the plans ready for them to absorb and understand.Use these PowerPoint slides for presentations relating to Business, chart, circle, colors, concept, corporate, cycle, data, design, detail, development, diagram, engineering, graphic, ideas, illustration, image, implement, implementation, life, lifecycle, management, model, objects, organization, plan, process, product, professional, project, quality, schema, shape, stack, stage, steps, strategy, structure, success, symbol. The prominent colors used in the PowerPoint template are Purple, Black, Gray. You can be sure our 10 diverging stages planning process diagram Radial Chart PowerPoint templates are Efficacious. Presenters tell us our corporate PowerPoint templates and PPT Slides are Dazzling. We assure you our 10 diverging stages planning process diagram Radial Chart PowerPoint templates help you meet deadlines which are an element of today's workplace. Just browse and pick the slides that appeal to your intuitive senses. Customers tell us our circle PowerPoint templates and PPT Slides are Nifty. Presenters tell us our 10 diverging stages planning process diagram Radial Chart PowerPoint templates are Beautiful. You can be sure our corporate PowerPoint templates and PPT Slides are Attractive. Conduct meetings with our 10 Diverging Stages Planning Process Diagram Radial Chart PowerPoint Templates. Download without worries with our money back guaranteee.
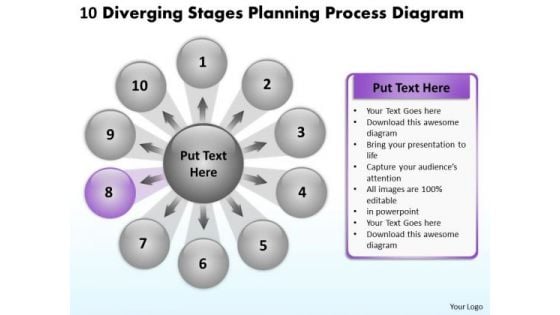
10 Diverging Stages Planning Process Diagram Circular Flow PowerPoint Templates
We present our 10 diverging stages planning process diagram Circular Flow PowerPoint templates.Download our Ring Charts PowerPoint Templates because they help to focus the thoughts of your listeners. Download and present our Flow charts PowerPoint Templates because you have a handle on all the targets, a master of the game, the experienced and consummate juggler. Download our Process and flows PowerPoint Templates because it Creates a winner with your passion and dream. Download our Business PowerPoint Templates because you have churned your mind and come upwith solutions. Download our Arrows PowerPoint Templates because with the help of our Slides you can Illustrate these thoughts with this slide.Use these PowerPoint slides for presentations relating to Business, chart, circle, colors, concept, corporate, cycle, data, design, detail, development, diagram, engineering, graphic, ideas, illustration, image, implement, implementation, life, lifecycle, management, model, objects, organization, process, product, professional, project, quality, schema, shape, steps, strategy, structure, success, symbol. The prominent colors used in the PowerPoint template are Blue light, Black, White. You can be sure our 10 diverging stages planning process diagram Circular Flow PowerPoint templates are Reminiscent. Presenters tell us our circle PowerPoint templates and PPT Slides have awesome images to get your point across. We assure you our 10 diverging stages planning process diagram Circular Flow PowerPoint templates are Versatile. Customers tell us our circle PowerPoint templates and PPT Slides will make the presenter successul in his career/life. Presenters tell us our 10 diverging stages planning process diagram Circular Flow PowerPoint templates are Dynamic. You can be sure our circle PowerPoint templates and PPT Slides are Tranquil. Address them in your charismatic style. Boost your aura with our 10 Diverging Stages Planning Process Diagram Circular Flow PowerPoint Templates.
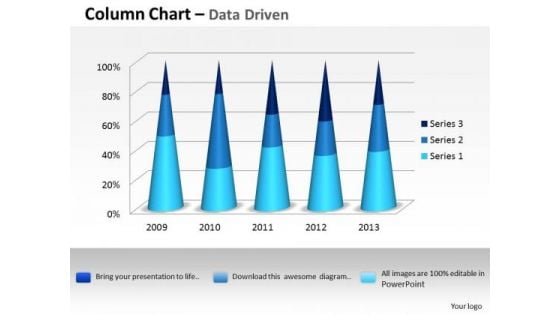
Data Analysis Excel 3d Process Variation Column Chart PowerPoint Templates
Put In A Dollop Of Our data analysis excel 3d process variation column chart Powerpoint Templates. Give Your Thoughts A Distinctive Flavor.
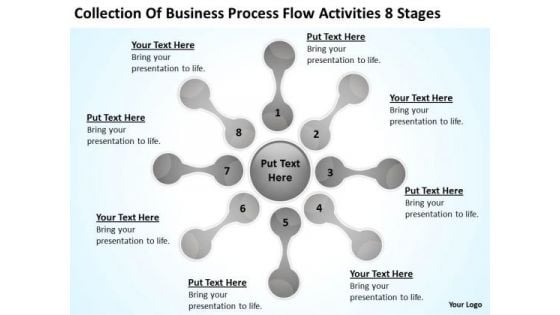
Business Process Flow Activities 8 Stages Ppt Plan PowerPoint Templates
We present our business process flow activities 8 stages ppt plan PowerPoint templates.Download and present our Process and Flows PowerPoint Templates because Our PowerPoint Templates and Slides will definately Enhance the stature of your presentation. Adorn the beauty of your thoughts with their colourful backgrounds. Present our Flow Charts PowerPoint Templates because Our PowerPoint Templates and Slides are topically designed to provide an attractive backdrop to any subject. Download our Business PowerPoint Templates because You can Raise a toast with our PowerPoint Templates and Slides. Spread good cheer amongst your audience. Present our Marketing PowerPoint Templates because Our PowerPoint Templates and Slides will Activate the energies of your audience. Get their creative juices flowing with your words. Download and present our Shapes PowerPoint Templates because Our PowerPoint Templates and Slides are innately eco-friendly. Their high recall value negate the need for paper handouts.Use these PowerPoint slides for presentations relating to Mapping, vector, chart, flow, flowchart, process, model, step, tool, blank, processdiagram, concept, topic, presentation, relate, circle, graphic, data, report, marketing, idea, circlepattern, team, management, graph, cycle, illustration, connection, processchart,direction, plans, color, text, phase, organization, control, connect, link, dotline, explanation, mapping, present. The prominent colors used in the PowerPoint template are Gray, Black, White. No matter how far you have to go. Our Business Process Flow Activities 8 Stages Ppt Plan PowerPoint Templates have the drive to get you there.
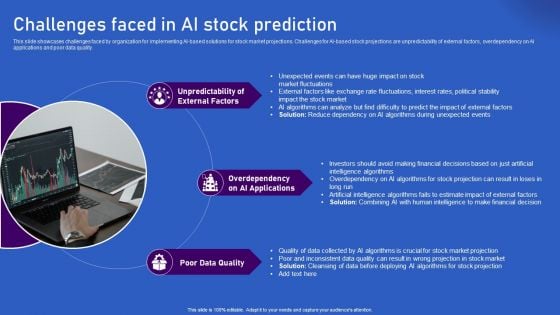
Ways Artificial Intelligence Is Transforming Finance Sector Challenges Faced In AI Stock Prediction Inspiration PDF
This slide showcases challenges faced by organization for implementing AI-based solutions for stock market projections. Challenges for AI-based stock projections are unpredictability of external factors, overdependency on AI applications and poor data quality. Do you have an important presentation coming up Are you looking for something that will make your presentation stand out from the rest Look no further than Ways Artificial Intelligence Is Transforming Finance Sector Challenges Faced In AI Stock Prediction Inspiration PDF. With our professional designs, you can trust that your presentation will pop and make delivering it a smooth process. And with Slidegeeks, you can trust that your presentation will be unique and memorable. So why wait Grab Ways Artificial Intelligence Is Transforming Finance Sector Challenges Faced In AI Stock Prediction Inspiration PDF today and make your presentation stand out from the rest.
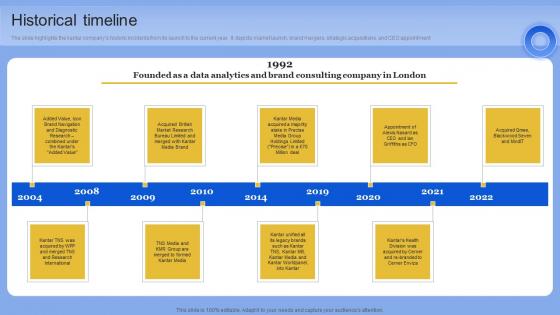
Historical Timeline Data Analytics Company Outline Clipart PDF
This Historical Timeline Data Analytics Company Outline Clipart PDF is perfect for any presentation, be it in front of clients or colleagues. It is a versatile and stylish solution for organizing your meetings. The Historical Timeline Data Analytics Company Outline Clipart PDF features a modern design for your presentation meetings. The adjustable and customizable slides provide unlimited possibilities for acing up your presentation. Slidegeeks has done all the homework before launching the product for you. So, do not wait, grab the presentation templates today The slide highlights the kantar companys historic incidents from its launch to the current year. It depicts market launch, brand mergers, strategic acquisitions, and CEO appointment

Developing Strategic Insights Using Big Data Analytics Across Business Sectors Data Analytics CD V
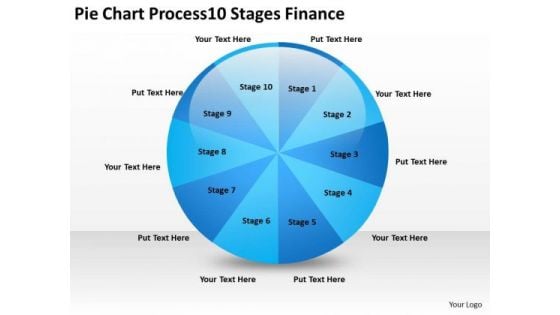
Pie Chart Process 10 Stages Finance Ppt How To Right Business Plan PowerPoint Templates
We present our pie chart process 10 stages finance ppt how to right business plan PowerPoint templates.Present our Circle Charts PowerPoint Templates because You are well armed with penetrative ideas. Our PowerPoint Templates and Slides will provide the gunpowder you need. Present our Signs PowerPoint Templates because Our PowerPoint Templates and Slides will let Your superior ideas hit the target always and everytime. Use our Shapes PowerPoint Templates because Our PowerPoint Templates and Slides will embellish your thoughts. See them provide the desired motivation to your team. Present our Process and Flows PowerPoint Templates because Our PowerPoint Templates and Slides are truly out of this world. Even the MIB duo has been keeping tabs on our team. Download and present our Business PowerPoint Templates because You are well armed with penetrative ideas. Our PowerPoint Templates and Slides will provide the gunpowder you need.Use these PowerPoint slides for presentations relating to chart, pie, graph, wheel, vector, process, market, marketing, diagram, business, catalog, website, network, statistics, model, document, junction, red, plan, presentation, template, circle, brochure, orange, data, stock, management, multicolored, box, options, direction, design, company, navigation, financial, structure, multiple, button, goals, results. The prominent colors used in the PowerPoint template are Blue, Blue navy, Black. Achieve high-quality presentations with our Pie Chart Process 10 Stages Finance Ppt How To Right Business Plan PowerPoint Templates. They will make you look good.
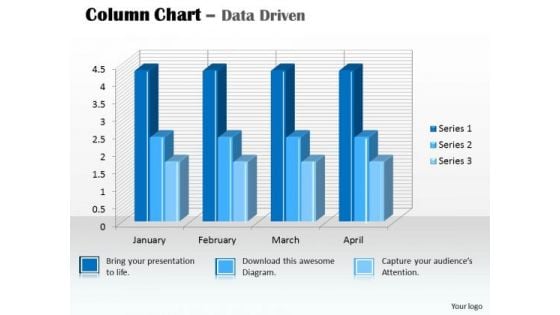
Data Analysis In Excel 3d Column Chart For PowerPoint Templates
Our data analysis in excel 3d column chart for Powerpoint Templates And Your Ideas Make A Great Doubles Pair. Play The Net With Assured Hands.

Microsoft Excel Data Analysis Bar Chart To Handle PowerPoint Templates
Our microsoft excel data analysis bar chart to handle Powerpoint Templates And Your Ideas Make A Great Doubles Pair. Play The Net With Assured Hands.

Big Data Analytics Investor Funding Elevator Pitch Deck Ppt Template
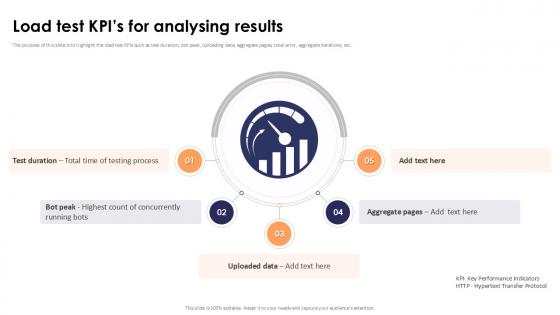
Load Test Kpis For Analysing Results Stress Testing For Robust Ppt Presentation
The purpose of this slide is to highlight the load test KPIs such as test duration, bot peak, uploading data, aggregate pages, total error, aggregate iterations, etc. Present like a pro with Load Test Kpis For Analysing Results Stress Testing For Robust Ppt Presentation Create beautiful presentations together with your team, using our easy-to-use presentation slides. Share your ideas in real-time and make changes on the fly by downloading our templates. So whether you are in the office, on the go, or in a remote location, you can stay in sync with your team and present your ideas with confidence. With Slidegeeks presentation got a whole lot easier. Grab these presentations today. The purpose of this slide is to highlight the load test KPIs such as test duration, bot peak, uploading data, aggregate pages, total error, aggregate iterations, etc.
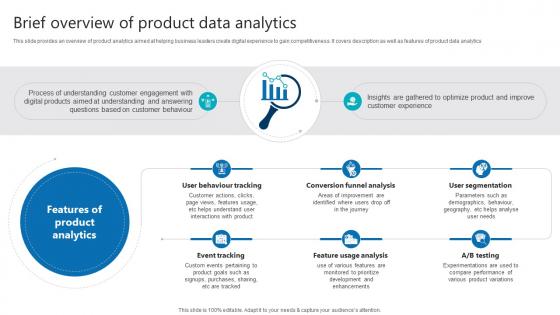
Brief Overview Of Product Data Analytics Product Analytics Implementation Data Analytics V
This slide provides an overview of product analytics aimed at helping business leaders create digital experience to gain competitiveness. It covers description as well as features of product data analytics Get a simple yet stunning designed Brief Overview Of Product Data Analytics Product Analytics Implementation Data Analytics V. It is the best one to establish the tone in your meetings. It is an excellent way to make your presentations highly effective. So, download this PPT today from Slidegeeks and see the positive impacts. Our easy-to-edit Brief Overview Of Product Data Analytics Product Analytics Implementation Data Analytics V can be your go-to option for all upcoming conferences and meetings. So, what are you waiting for Grab this template today. This slide provides an overview of product analytics aimed at helping business leaders create digital experience to gain competitiveness. It covers description as well as features of product data analytics
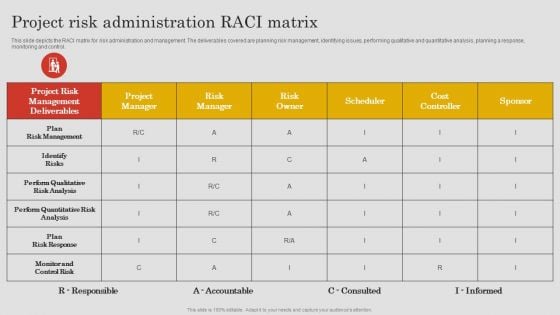
Project Risk Management And Reduction Project Risk Administration Raci Matrix Download PDF
This slide depicts the RACI matrix for risk administration and management. The deliverables covered are planning risk management, identifying issues, performing qualitative and quantitative analysis, planning a response, monitoring and control. The Project Risk Management And Reduction Project Risk Administration Raci Matrix Download PDF is a compilation of the most recent design trends as a series of slides. It is suitable for any subject or industry presentation, containing attractive visuals and photo spots for businesses to clearly express their messages. This template contains a variety of slides for the user to input data, such as structures to contrast two elements, bullet points, and slides for written information. Slidegeeks is prepared to create an impression.
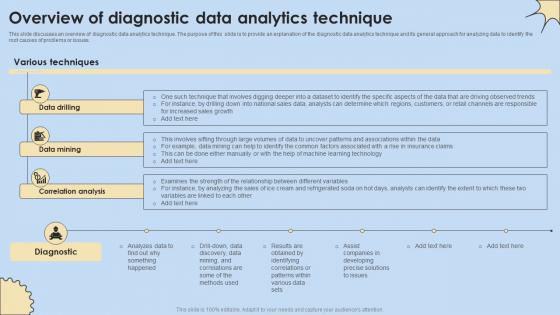
Overview Of Diagnostic Data Analytics Technique Internet Of Things Analysis Introduction Pdf
This slide discusses an overview of diagnostic data analytics technique. The purpose of this slide is to provide an explanation of the diagnostic data analytics technique and its general approach for analyzing data to identify the root causes of problems or issues. Are you searching for a Overview Of Diagnostic Data Analytics Technique Internet Of Things Analysis Introduction Pdf that is uncluttered, straightforward, and original It is easy to edit, and you can change the colors to suit your personal or business branding. For a presentation that expresses how much effort you have put in, this template is ideal With all of its features, including tables, diagrams, statistics, and lists, it is perfect for a business plan presentation. Make your ideas more appealing with these professional slides. Download Overview Of Diagnostic Data Analytics Technique Internet Of Things Analysis Introduction Pdf from Slidegeeks today. This slide discusses an overview of diagnostic data analytics technique. The purpose of this slide is to provide an explanation of the diagnostic data analytics technique and its general approach for analyzing data to identify the root causes of problems or issues.

Ukraine PowerPoint Maps
Ukraine Country Powerpoint Maps-These high quality, editable powerpoint country maps have been carefully created by our professional team to display location and other geographic details in your PowerPoint presentation. Each map is vector based and is 100% editable in powerpoint. Each and every property of any region - color, size, shading etc can be modified to help you build an effective powerpoint presentation. Use these maps to show sales territories, business and new office locations, travel planning etc in your presentations. Any text can be entered at any point in the powerpoint map slide. Simply DOWNLOAD, TYPE and PRESENT! Figure out the market with our Ukraine PowerPoint Maps. Analyse the data accurately for the audience.

Ways Artificial Intelligence Is Transforming Finance Sector Companies Leveraging AI For Stock Market Summary PDF
This slide showcases challenges faced by organization for implementing AI-based solutions for stock market projections. Challenges for AI-based stock projections are unpredictability of external factors, overdependency on AI applications and poor data quality. Find highly impressive Ways Artificial Intelligence Is Transforming Finance Sector Companies Leveraging AI For Stock Market Summary PDF on Slidegeeks to deliver a meaningful presentation. You can save an ample amount of time using these presentation templates. No need to worry to prepare everything from scratch because Slidegeeks experts have already done a huge research and work for you. You need to download Ways Artificial Intelligence Is Transforming Finance Sector Companies Leveraging AI For Stock Market Summary PDF for your upcoming presentation. All the presentation templates are 100 percent editable and you can change the color and personalize the content accordingly. Download now.
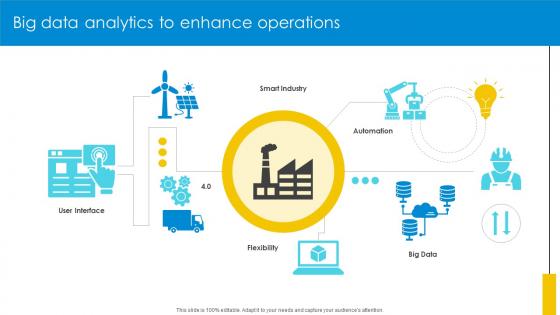
Big Data Analytics To Enhance Operations Optimizing Inventory Management IoT SS V
If your project calls for a presentation, then Slidegeeks is your go-to partner because we have professionally designed, easy-to-edit templates that are perfect for any presentation. After downloading, you can easily edit Big Data Analytics To Enhance Operations Optimizing Inventory Management IoT SS V and make the changes accordingly. You can rearrange slides or fill them with different images. Check out all the handy templates Our Big Data Analytics To Enhance Operations Optimizing Inventory Management IoT SS V are topically designed to provide an attractive backdrop to any subject. Use them to look like a presentation pro.
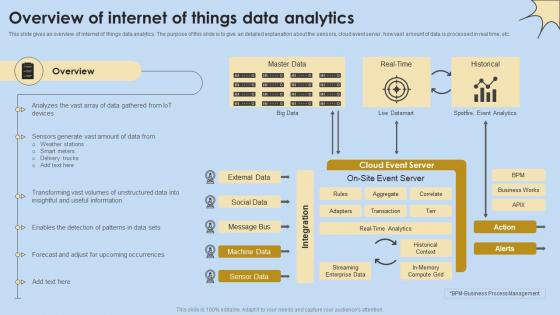
Overview Of Internet Of Things Data Analytics Internet Of Things Analysis Clipart Pdf
This slide gives an overview of internet of things data analytics. The purpose of this slide is to give an detailed explanation about the sensors, cloud event server, how vast amount of data is processed in real time, etc. Retrieve professionally designed Overview Of Internet Of Things Data Analytics Internet Of Things Analysis Clipart Pdf to effectively convey your message and captivate your listeners. Save time by selecting pre-made slideshows that are appropriate for various topics, from business to educational purposes. These themes come in many different styles, from creative to corporate, and all of them are easily adjustable and can be edited quickly. Access them as PowerPoint templates or as Google Slides themes. You do not have to go on a hunt for the perfect presentation because Slidegeeks got you covered from everywhere. This slide gives an overview of internet of things data analytics. The purpose of this slide is to give an detailed explanation about the sensors, cloud event server, how vast amount of data is processed in real time, etc.

Collection Of Business Process Flow Activities 8 Stages New Plan PowerPoint Slides
We present our collection of business process flow activities 8 stages new plan PowerPoint Slides.Present our Process and Flows PowerPoint Templates because It can Bubble and burst with your ideas. Present our Flow Charts PowerPoint Templates because Our PowerPoint Templates and Slides are specially created by a professional team with vast experience. They diligently strive to come up with the right vehicle for your brilliant Ideas. Present our Marketing PowerPoint Templates because Our PowerPoint Templates and Slides will let you Clearly mark the path for others to follow. Download our Shapes PowerPoint Templates because You can Flag mark the road ahead with our PowerPoint Templates and Slides. They will unfurl your brilliant plans to your audience. Download our Business PowerPoint Templates because Our PowerPoint Templates and Slides will let Your superior ideas hit the target always and everytime.Use these PowerPoint slides for presentations relating to Mapping, vector, chart, flow, flowchart, process, model, step, tool, blank, processdiagram, concept, topic, presentation, relate, circle, graphic, data, report, marketing, idea, circlepattern, team, management, graph, cycle, illustration, connection, processchart,direction, plans, color, text, phase, organization, control, connect, link, explanation, mapping, present. The prominent colors used in the PowerPoint template are Green, Gray, Black. Cover the gaps with our Collection Of Business Process Flow Activities 8 Stages New Plan PowerPoint Slides. They provide an ideal filling.
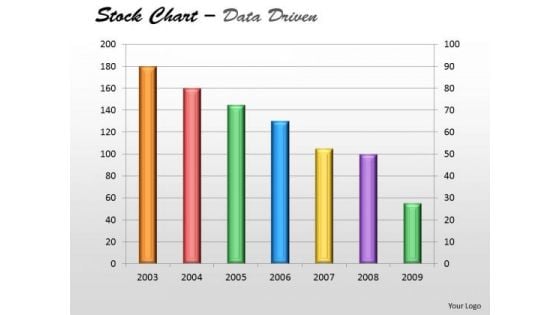
Data Analysis In Excel Of Stock Chart PowerPoint Templates
Plan Your Storyboard With Our data analysis in excel of stock chart Powerpoint Templates . Give An Outline To The Solutions You Have.
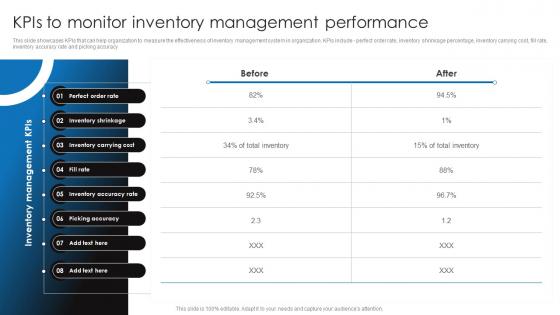
Kpis To Monitor Inventory Management Retail Stock Administration Strategies Pictures Pdf
This slide showcases KPIs that can help organization to measure the effectiveness of inventory management system in organization. KPIs include - perfect order rate, inventory shrinkage percentage, inventory carrying cost, fill rate, inventory accuracy rate and picking accuracy.This Kpis To Monitor Inventory Management Retail Stock Administration Strategies Pictures Pdf from Slidegeeks makes it easy to present information on your topic with precision. It provides customization options, so you can make changes to the colors, design, graphics, or any other component to create a unique layout. It is also available for immediate download, so you can begin using it right away. Slidegeeks has done good research to ensure that you have everything you need to make your presentation stand out. Make a name out there for a brilliant performance. This slide showcases KPIs that can help organization to measure the effectiveness of inventory management system in organization. KPIs include perfect order rate, inventory shrinkage percentage, inventory carrying cost, fill rate, inventory accuracy rate and picking accuracy
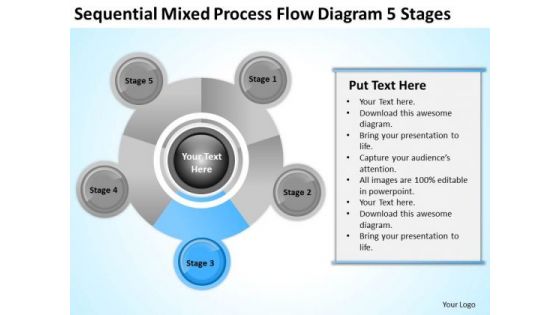
Business Organizational Chart Examples Mixed Process Flow Diagram 5 Stages PowerPoint Slide
We present our business organizational chart examples mixed process flow diagram 5 stages PowerPoint Slide.Download our Construction PowerPoint Templates because You can Hit the nail on the head with our PowerPoint Templates and Slides. Embed your ideas in the minds of your audience. Use our Advertising PowerPoint Templates because Our PowerPoint Templates and Slides are conceived by a dedicated team. Use them and give form to your wondrous ideas. Use our Circle Charts PowerPoint Templates because You can Be the puppeteer with our PowerPoint Templates and Slides as your strings. Lead your team through the steps of your script. Use our Business PowerPoint Templates because You can Channelise the thoughts of your team with our PowerPoint Templates and Slides. Urge them to focus on the goals you have set. Download our Shapes PowerPoint Templates because Our PowerPoint Templates and Slides have the Brilliant backdrops. Guaranteed to illuminate the minds of your audience.Use these PowerPoint slides for presentations relating to Development, diagram, life, test, process, chart, concept, vector, stage, project, business, workflow, team, design, phase, product, model, schema, corporate, implementation, tag, plan, engineering, success, symbol, stack, circle, graphic, data, shape, management, cycle, steps, illustration, system, strategy, waterfall, colors, objects, lifecycle, professional, quality, organization, implement, background, image, detail, software, structure, ideas. The prominent colors used in the PowerPoint template are Blue, Gray, Black. Our Business Organizational Chart Examples Mixed Process Flow Diagram 5 Stages PowerPoint Slide are really enterprising. They dig out ways to convey your ideas.
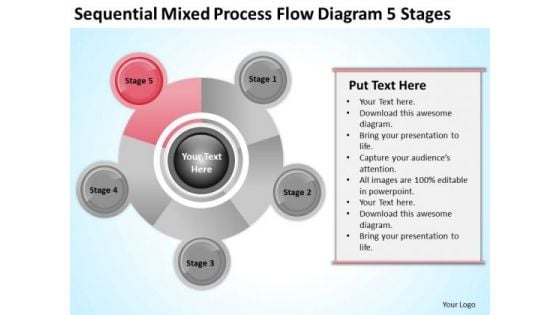
Business Organizational Chart Examples Mixed Process Flow Diagram 5 Stages Ppt PowerPoint Slides
We present our business organizational chart examples mixed process flow diagram 5 stages ppt PowerPoint Slides.Download and present our Construction PowerPoint Templates because Our PowerPoint Templates and Slides are created with admirable insight. Use them and give your group a sense of your logical mind. Download our Advertising PowerPoint Templates because These PowerPoint Templates and Slides will give the updraft to your ideas. See them soar to great heights with ease. Download and present our Circle Charts PowerPoint Templates because They will bring a lot to the table. Their alluring flavours will make your audience salivate. Use our Business PowerPoint Templates because Our PowerPoint Templates and Slides will effectively help you save your valuable time. They are readymade to fit into any presentation structure. Download and present our Shapes PowerPoint Templates because Our PowerPoint Templates and Slides will let you Hit the right notes. Watch your audience start singing to your tune.Use these PowerPoint slides for presentations relating to Development, diagram, life, test, process, chart, concept, vector, stage, project, business, workflow, team, design, phase, product, model, schema, corporate, implementation, tag, plan, engineering, success, symbol, stack, circle, graphic, data, shape, management, cycle, steps, illustration, system, strategy, waterfall, colors, objects, lifecycle, professional, quality, organization, implement, background, image, detail, software, structure, ideas. The prominent colors used in the PowerPoint template are Red, Gray, Black. Let your ideas explode on the scene. Trigger the fuse with our Business Organizational Chart Examples Mixed Process Flow Diagram 5 Stages Ppt PowerPoint Slides.
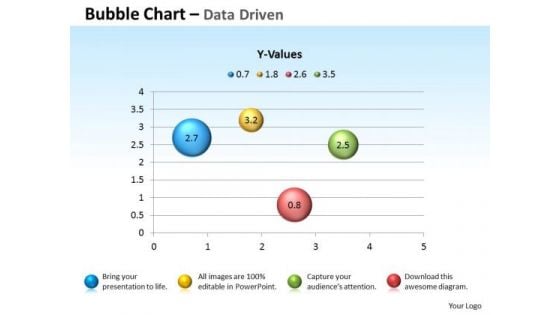
Excel Data Analysis Data Tools Data Methods Statistical Chart For Process PowerPoint Templates
Blend Your Views With Our excel data analysis data tools data methods statistical chart for process Powerpoint Templates . They Are Made For Each Other.

Data Analysis Techniques 3d Effective Display Chart PowerPoint Templates
Dribble Away With Our data analysis techniques 3d effective display chart Powerpoint Templates . Score A Goal With Your Ideas.
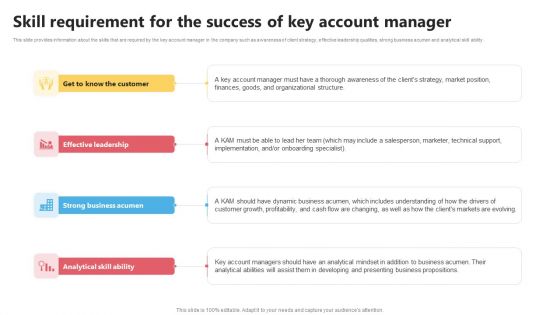
KAM Evaluation Procedure In The Organization Skill Requirement For The Success Designs PDF
This slide provides information about the skills that are required by the key account manager in the company such as awareness of client strategy, effective leadership qualities, strong business acumen and analytical skill ability. The KAM Evaluation Procedure In The Organization Skill Requirement For The Success Designs PDF is a compilation of the most recent design trends as a series of slides. It is suitable for any subject or industry presentation, containing attractive visuals and photo spots for businesses to clearly express their messages. This template contains a variety of slides for the user to input data, such as structures to contrast two elements, bullet points, and slides for written information. Slidegeeks is prepared to create an impression.
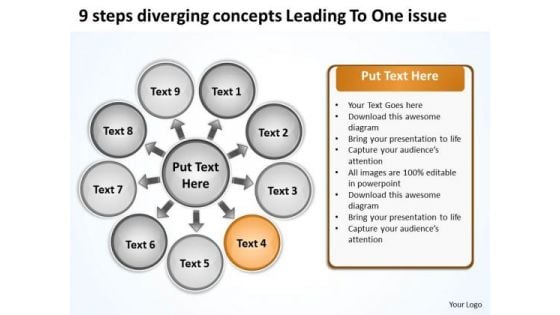
9 Steps Diverging Concepts Leading To One Issue Arrows Chart Software PowerPoint Slides
We present our 9 steps diverging concepts leading to one issue Arrows Chart Software PowerPoint Slides.Use our Circle charts PowerPoint Templates because you can asked to strive to give true form to your great dream. Use our Shapes PowerPoint Templates because the graphic is a symbol of growth and success. Present our Ring charts PowerPoint Templates because this diagram helps to reaffirm to your team your faith in maintaining the highest ethical standards. Present our Process and Flows PowerPoint Templates because you will be able to Highlight these individual targets and the paths to their achievement. Download and present our Signs PowerPoint Templates because this diagram helps in examine each brilliant thought in thorough detail highlighting all the pros and cons as minutely as possible.Use these PowerPoint slides for presentations relating to Business, chart, circle, colors, concept, corporate, cycle, data, design, detail, development, diagram, engineering, graphic, ideas, illustration, image, implement, implementation, life, lifecycle, management, model, objects, organization, plan, process, product, professional, project, quality, schema, shape, stack, stage, steps, strategy, structure, success, symbol. The prominent colors used in the PowerPoint template are Green, Black, White. You can be sure our 9 steps diverging concepts leading to one issue Arrows Chart Software PowerPoint Slides are Dynamic. Presenters tell us our concept PowerPoint templates and PPT Slides are Dynamic. We assure you our 9 steps diverging concepts leading to one issue Arrows Chart Software PowerPoint Slides are aesthetically designed to attract attention. We guarantee that they will grab all the eyeballs you need. Customers tell us our concept PowerPoint templates and PPT Slides are Royal. Presenters tell us our 9 steps diverging concepts leading to one issue Arrows Chart Software PowerPoint Slides have awesome images to get your point across. You can be sure our circle PowerPoint templates and PPT Slides are Quaint. Keep them driven with our 9 Steps Diverging Concepts Leading To One Issue Arrows Chart Software PowerPoint Slides. You will come out on top.
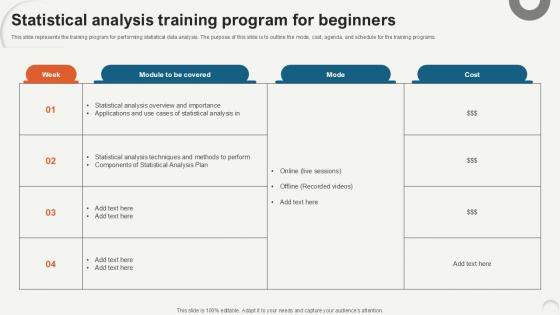
Statistical Analysis Training Program Data Analytics For Informed Decision Ppt Template
This slide represents the training program for performing statistical data analysis. The purpose of this slide is to outline the mode, cost, agenda, and schedule for the training programs. Take your projects to the next level with our ultimate collection of Statistical Analysis Training Program Data Analytics For Informed Decision Ppt Template. Slidegeeks has designed a range of layouts that are perfect for representing task or activity duration, keeping track of all your deadlines at a glance. Tailor these designs to your exact needs and give them a truly corporate look with your own brand colors they will make your projects stand out from the rest This slide represents the training program for performing statistical data analysis. The purpose of this slide is to outline the mode, cost, agenda, and schedule for the training programs.

Best Data Mining Tools TIBCO Using Data Mining Tools To Optimize Processes AI SS V
This slide showcases TIBCO, one of the best data mining tools available in the latter market. It provides details about data sources, data preparation, data exploration, data analytics, shared workspace, drag and drop. Get a simple yet stunning designed Best Data Mining Tools TIBCO Using Data Mining Tools To Optimize Processes AI SS V. It is the best one to establish the tone in your meetings. It is an excellent way to make your presentations highly effective. So, download this PPT today from Slidegeeks and see the positive impacts. Our easy-to-edit Best Data Mining Tools TIBCO Using Data Mining Tools To Optimize Processes AI SS V can be your go-to option for all upcoming conferences and meetings. So, what are you waiting for Grab this template today. This slide showcases TIBCO, one of the best data mining tools available in the latter market. It provides details about data sources, data preparation, data exploration, data analytics, shared workspace, drag and drop.
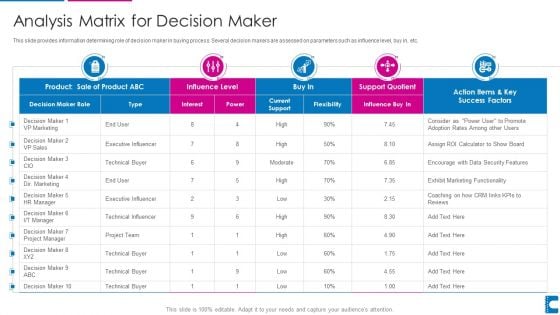
How To Administer Accounts To Increase Sales Revenue Analysis Matrix For Decision Maker Summary PDF
This slide provides information determining role of decision maker in buying process. Several decision makers are assessed on parameters such as influence level, buy in, etc. Deliver an awe inspiring pitch with this creative how to administer accounts to increase sales revenue analysis matrix for decision maker summary pdf bundle. Topics like product, marketing functionality, data security can be discussed with this completely editable template. It is available for immediate download depending on the needs and requirements of the user.
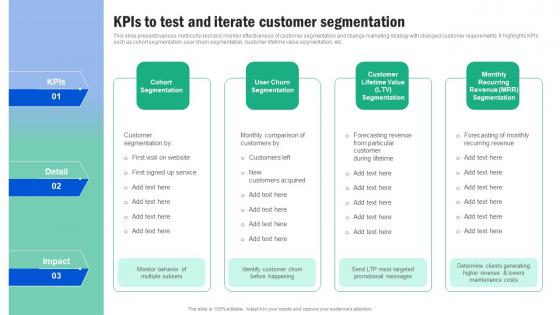
Kpis To Test And Iterate Customer Segmentation Guide For Segmenting And Formulating Summary Pdf
This slide presents various metrics for test and monitor effectiveness of customer segmentation and change marketing strategy with changed customer requirements. It highlights KPIs such as cohort segmentation, user churn segmentation, customer lifetime value segmentation, etc Slidegeeks is one of the best resources for PowerPoint templates. You can download easily and regulate Kpis To Test And Iterate Customer Segmentation Guide For Segmenting And Formulating Summary Pdf for your personal presentations from our wonderful collection. A few clicks is all it takes to discover and get the most relevant and appropriate templates. Use our Templates to add a unique zing and appeal to your presentation and meetings. All the slides are easy to edit and you can use them even for advertisement purposes. This slide presents various metrics for test and monitor effectiveness of customer segmentation and change marketing strategy with changed customer requirements. It highlights KPIs such as cohort segmentation, user churn segmentation, customer lifetime value segmentation, etc
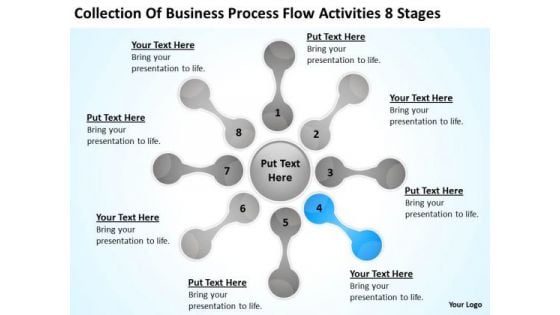
Business Process Flow Activities 8 Stages Plan Forms PowerPoint Slides
We present our business process flow activities 8 stages plan forms PowerPoint Slides.Download our Flow Charts PowerPoint Templates because Our PowerPoint Templates and Slides ensures Effective communication. They help you put across your views with precision and clarity. Present our Process and Flows PowerPoint Templates because Our PowerPoint Templates and Slides will provide you the cutting edge. Slice through the doubts in the minds of your listeners. Download and present our Shapes PowerPoint Templates because You have a driving passion to excel in your field. Our PowerPoint Templates and Slides will prove ideal vehicles for your ideas. Present our Marketing PowerPoint Templates because Our PowerPoint Templates and Slides are effectively colour coded to prioritise your plans They automatically highlight the sequence of events you desire. Use our Business PowerPoint Templates because Our PowerPoint Templates and Slides provide you with a vast range of viable options. Select the appropriate ones and just fill in your text. Use these PowerPoint slides for presentations relating to Mapping, vector, chart, flow, flowchart, process, model, step, tool, blank, processdiagram, concept, topic, presentation, relate, circle, graphic, data, report, marketing, idea, circlepattern, team, management, graph, cycle, illustration, connection, processchart,direction, plans, color, text, phase, organization, control, connect, link, dotline, explanation, mapping, present. The prominent colors used in the PowerPoint template are Blue, Gray, Black. Entertain your audience with our Business Process Flow Activities 8 Stages Plan Forms PowerPoint Slides. You will come out on top.
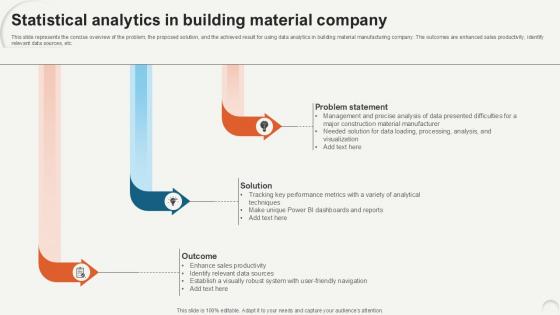
Statistical Analytics In Building Data Analytics For Informed Decision Ppt PowerPoint
This slide represents the concise overview of the problem, the proposed solution, and the achieved result for using data analytics in building material manufacturing company. The outcomes are enhanced sales productivity, identify relevant data sources, etc. Do you know about Slidesgeeks Statistical Analytics In Building Data Analytics For Informed Decision Ppt PowerPoint These are perfect for delivering any kind od presentation. Using it, create PowerPoint presentations that communicate your ideas and engage audiences. Save time and effort by using our pre-designed presentation templates that are perfect for a wide range of topic. Our vast selection of designs covers a range of styles, from creative to business, and are all highly customizable and easy to edit. Download as a PowerPoint template or use them as Google Slides themes. This slide represents the concise overview of the problem, the proposed solution, and the achieved result for using data analytics in building material manufacturing company. The outcomes are enhanced sales productivity, identify relevant data sources, etc.
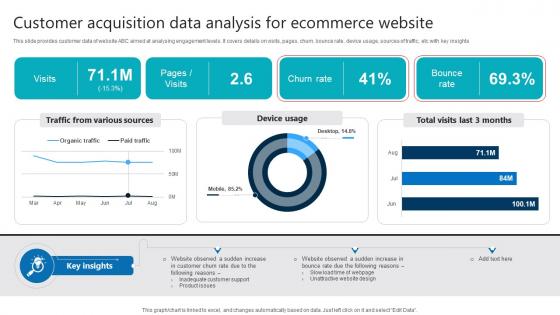
Customer Acquisition Data Analysis For Ecommerce Website Product Analytics Implementation Data Analytics V
This slide provides customer data of website ABC aimed at analysing engagement levels. It covers details on visits, pages, churn, bounce rate, device usage, sources of traffic, etc with key insights If you are looking for a format to display your unique thoughts, then the professionally designed Customer Acquisition Data Analysis For Ecommerce Website Product Analytics Implementation Data Analytics V is the one for you. You can use it as a Google Slides template or a PowerPoint template. Incorporate impressive visuals, symbols, images, and other charts. Modify or reorganize the text boxes as you desire. Experiment with shade schemes and font pairings. Alter, share or cooperate with other people on your work. Download Customer Acquisition Data Analysis For Ecommerce Website Product Analytics Implementation Data Analytics V and find out how to give a successful presentation. Present a perfect display to your team and make your presentation unforgettable. This slide provides customer data of website ABC aimed at analysing engagement levels. It covers details on visits, pages, churn, bounce rate, device usage, sources of traffic, etc with key insights
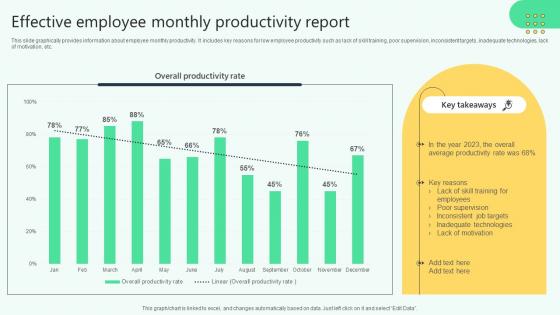
Effective Employee Monthly Productivity Report Analysing Hr Data For Effective Decision Making
This slide graphically provides information about employee monthly productivity. It includes key reasons for low employee productivity such as lack of skill training, poor supervision, inconsistent targets, inadequate technologies, lack of motivation, etc. If your project calls for a presentation, then Slidegeeks is your go-to partner because we have professionally designed, easy-to-edit templates that are perfect for any presentation. After downloading, you can easily edit Effective Employee Monthly Productivity Report Analysing Hr Data For Effective Decision Making and make the changes accordingly. You can rearrange slides or fill them with different images. Check out all the handy templates This slide graphically provides information about employee monthly productivity. It includes key reasons for low employee productivity such as lack of skill training, poor supervision, inconsistent targets, inadequate technologies, lack of motivation, etc.

Examining Customer Experience Path To Enhance Adoption Rate Customer Reviews And Ratings For Product Pictures PDF
This slide provides glimpse about client reviews about the product offered by the brand so the customers can check reviews of products users and realize the products value. It includes multiple KPIs such as quality, effectiveness, fragrance, etc. Boost your pitch with our creative Examining Customer Experience Path To Enhance Adoption Rate Customer Reviews And Ratings For Product Pictures PDF. Deliver an awe-inspiring pitch that will mesmerize everyone. Using these presentation templates you will surely catch everyones attention. You can browse the ppts collection on our website. We have researchers who are experts at creating the right content for the templates. So you do not have to invest time in any additional work. Just grab the template now and use them.
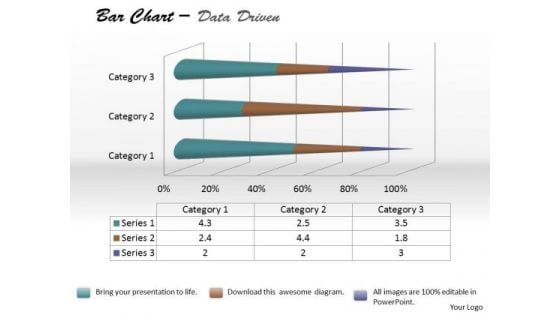
Data Analysis Bar Chart For Foreign Trade PowerPoint Templates
Be The Doer With Our data analysis bar chart for foreign trade Powerpoint Templates. Put Your Thoughts Into Practice.
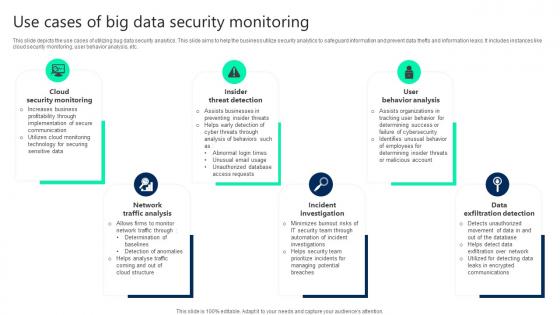
Use Cases Of Big Data Security Monitoring Clipart pdf
This slide depicts the use cases of utilizing bug data security analytics. This slide aims to help the business utilize security analytics to safeguard information and prevent data thefts and information leaks. It includes instances like cloud security monitoring, user behavior analysis, etc. Pitch your topic with ease and precision using this Use Cases Of Big Data Security Monitoring Clipart pdf. This layout presents information on Cloud Security Monitoring, Insider Threat Detection, User Behavior Analysis. It is also available for immediate download and adjustment. So, changes can be made in the color, design, graphics or any other component to create a unique layout. This slide depicts the use cases of utilizing bug data security analytics. This slide aims to help the business utilize security analytics to safeguard information and prevent data thefts and information leaks. It includes instances like cloud security monitoring, user behavior analysis, etc.
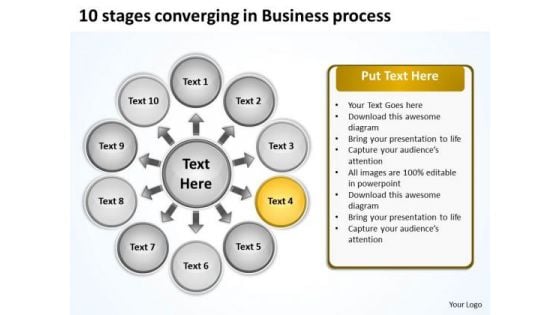
10 Stages Converging Business PowerPoint Theme Process Radial Network Slides
We present our 10 stages converging business powerpoint theme process Radial Network Slides.Use our Arrows PowerPoint Templates because this Diagram emphasizes on any critical or key factors within them. Use our Flow charts PowerPoint Templates because you can Amplify your views, ideas and thoughts from very basic aspects to the highly technical and complicated issus using this template as a tool. Download and present our Business PowerPoint Templates because this is the unerring accuracy in reaching the target. the effortless ability to launch into flight. Use our Process and Flows PowerPoint Templates because your team and you always raise a toast. Download and present our Circle charts PowerPoint Templates because this slide helps you to give your team an overview of your capability and insight into the minute details of the overall picture highlighting the interdependence at every operational level.Use these PowerPoint slides for presentations relating to Business, chart, circle, colors, concept, corporate, cycle, data, design, detail, development, diagram, engineering, graphic, ideas, illustration, image, implement, implementation, life, lifecycle, management, model, objects, organization, plan, process, product, professional, project, quality, schema, shape, stack, stage, steps, strategy, structure, success, symbol. The prominent colors used in the PowerPoint template are Yellow, White, Black. You can be sure our 10 stages converging business powerpoint theme process Radial Network Slides are Swanky. Presenters tell us our colors PowerPoint templates and PPT Slides are specially created by a professional team with vast experience. They diligently strive to come up with the right vehicle for your brilliant Ideas. We assure you our 10 stages converging business powerpoint theme process Radial Network Slides are Nice. Customers tell us our concept PowerPoint templates and PPT Slides are Delightful. Presenters tell us our 10 stages converging business powerpoint theme process Radial Network Slides are Efficacious. You can be sure our data PowerPoint templates and PPT Slides are Elevated. Attract attention with our 10 Stages Converging Business PowerPoint Theme Process Radial Network Slides. You will come out on top.
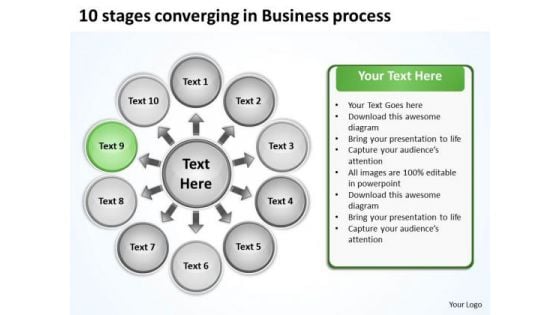
10 Stages Converging Business PowerPoint Theme Process Radial Chart Slides
We present our 10 stages converging business powerpoint theme process Radial Chart Slides.Use our Arrows PowerPoint Templates because they help to lay the base of your trend of thought. Use our Flow charts PowerPoint Templates because this template with an image of helps you chart the course of your presentation. Download and present our Business PowerPoint Templates because the majestic tiger lord of all it surveys.It exudes power even when it is in repose. Present our Process and Flows PowerPoint Templates because you can Take your team along by explaining your plans. Present our Circle charts PowerPoint Templates because it is the time to bond with family, friends, colleagues and any other group of your choice.Use these PowerPoint slides for presentations relating to Business, chart, circle, colors, concept, corporate, cycle, data, design, detail, development, diagram, engineering, graphic, ideas, illustration, image, implement, implementation, life, lifecycle, management, model, objects, organization, plan, process, product, professional, project, quality, schema, shape, stack, stage, steps, strategy, structure, success, symbol. The prominent colors used in the PowerPoint template are Yellow, Black, Gray. You can be sure our 10 stages converging business powerpoint theme process Radial Chart Slides are Luxuriant. Presenters tell us our corporate PowerPoint templates and PPT Slides are effectively colour coded to prioritise your plans They automatically highlight the sequence of events you desire. We assure you our 10 stages converging business powerpoint theme process Radial Chart Slides are Efficient. Customers tell us our data PowerPoint templates and PPT Slides are One-of-a-kind. Presenters tell us our 10 stages converging business powerpoint theme process Radial Chart Slides are Stunning. You can be sure our cycle PowerPoint templates and PPT Slides are Lush. Get rid of the blues with our 10 Stages Converging Business PowerPoint Theme Process Radial Chart Slides. Let hope and happiness flow into your mind.
Product Kpis Ppt PowerPoint Presentation Complete With Slides
Share a great deal of information on the topic by deploying this product kpis ppt powerpoint presentation complete with slides. Support your ideas and thought process with this prefabricated set. It includes a set of twelve slides, all fully modifiable and editable. Each slide can be restructured and induced with the information and content of your choice. You can add or remove large content boxes as well, to make this PPT slideshow more personalized. Its high-quality graphics and visuals help in presenting a well-coordinated pitch. This PPT template is also a resourceful tool to take visual cues from and implement the best ideas to help your business grow and expand. The main attraction of this well-formulated deck is that everything is editable, giving you the freedom to adjust it to your liking and choice. Changes can be made in the background and theme as well to deliver an outstanding pitch. Therefore, click on the download button now to gain full access to this multifunctional set.
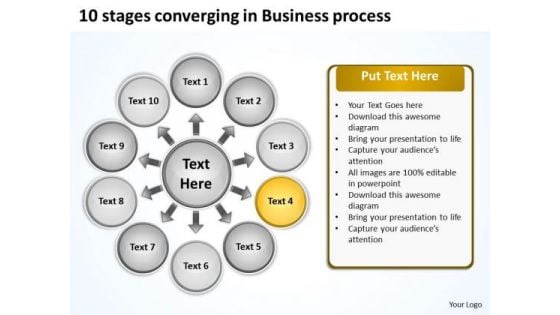
10 Stages Converging Business Process Circular Flow Diagram PowerPoint Slides
We present our 10 stages converging business process Circular Flow Diagram PowerPoint Slides.Download and present our Arrows PowerPoint Templates because they enhance the essence of your viable ideas. Download and present our Flow charts PowerPoint Templates because this slide can help to bullet point your views. Download our Business PowerPoint Templates because it will demonstrate the strength of character under severe stress. Shine the torch ahead and bring the light to shine on all. Present our Process and Flows PowerPoint Templates because you are aware of some pitfalls ahead where you need to be cautious not to overrun and avoid a stall. Download and present our Circle charts PowerPoint Templates because you have what it takes to grow.Use these PowerPoint slides for presentations relating to Business, chart, circle, colors, concept, corporate, cycle, data, design, detail, development, diagram, engineering, graphic, ideas, illustration, image, implement, implementation, life, lifecycle, management, model, objects, organization, plan, process, product, professional, project, quality, schema, shape, stack, stage, steps, strategy, structure, success, symbol. The prominent colors used in the PowerPoint template are Yellow, Black, White. You can be sure our 10 stages converging business process Circular Flow Diagram PowerPoint Slides have awesome images to get your point across. Presenters tell us our data PowerPoint templates and PPT Slides are Beautiful. We assure you our 10 stages converging business process Circular Flow Diagram PowerPoint Slides are Delightful. Customers tell us our corporate PowerPoint templates and PPT Slides will impress their bosses and teams. Presenters tell us our 10 stages converging business process Circular Flow Diagram PowerPoint Slides are Perfect. You can be sure our corporate PowerPoint templates and PPT Slides will impress their bosses and teams. Exhibit your plan with our 10 Stages Converging Business Process Circular Flow Diagram PowerPoint Slides. Display the clarity of your ideas.
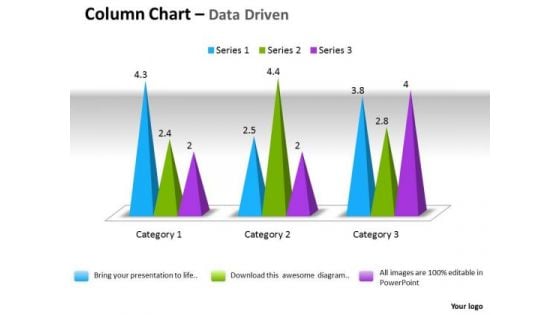
Microsoft Excel Data Analysis 3d Change In Business Process Chart PowerPoint Templates
Double Your Chances With Our microsoft excel data analysis 3d change in business process chart Powerpoint Templates . The Value Of Your Thoughts Will Increase Two-Fold.
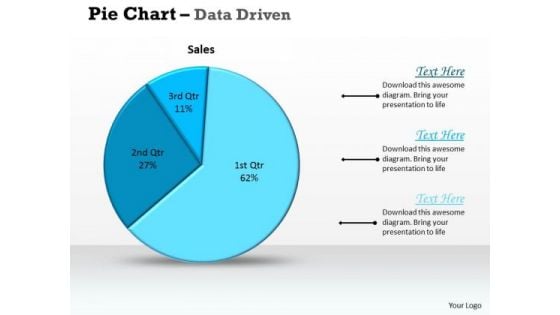
Data Analysis Excel Driven Pie Chart For Sales Process PowerPoint Slides Templates
Deliver The Right Dose With Our data analysis excel driven pie chart for sales process powerpoint slides Templates . Your Ideas Will Get The Correct Illumination.
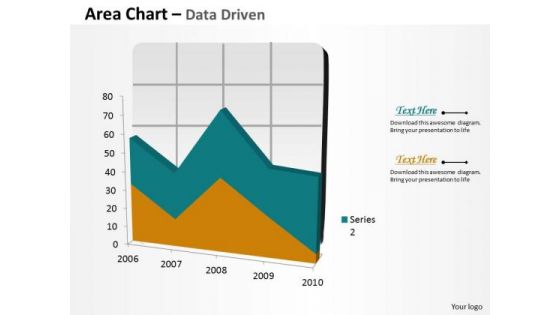
Data Analysis In Excel Area Chart For Business Process PowerPoint Templates
Your Grasp Of Economics Is Well Known. Help Your Audience Comprehend Issues With Our data analysis in excel area chart for business process Powerpoint Templates .
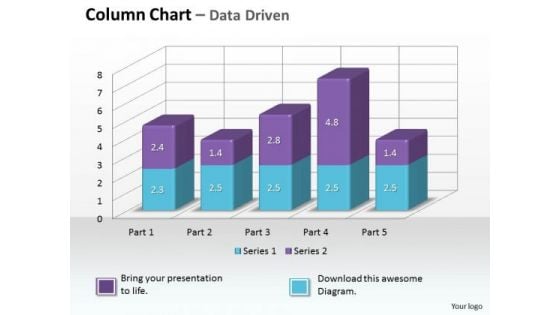
Data Analysis On Excel 3d Chart To Monitor Business Process PowerPoint Templates
Make Some Dough With Our data analysis on excel 3d chart to monitor business process Powerpoint Templates . Your Assets Will Rise Significantly.
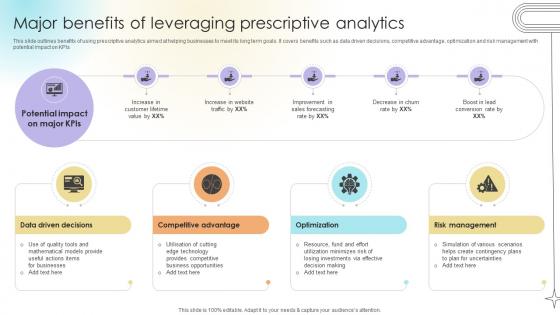
Major Benefits Of Leveraging Prescriptive Analytics Data Analytics SS V
This slide outlines benefits of using prescriptive analytics aimed at helping businesses to meet its long term goals. It covers benefits such as data driven decisions, competitive advantage, optimization and risk management with potential impact on KPIs.Are you in need of a template that can accommodate all of your creative concepts This one is crafted professionally and can be altered to fit any style. Use it with Google Slides or PowerPoint. Include striking photographs, symbols, depictions, and other visuals. Fill, move around, or remove text boxes as desired. Test out color palettes and font mixtures. Edit and save your work, or work with colleagues. Download Major Benefits Of Leveraging Prescriptive Analytics Data Analytics SS V and observe how to make your presentation outstanding. Give an impeccable presentation to your group and make your presentation unforgettable. This slide outlines benefits of using prescriptive analytics aimed at helping businesses to meet its long term goals. It covers benefits such as data driven decisions, competitive advantage, optimization and risk management with potential impact on KPIs.
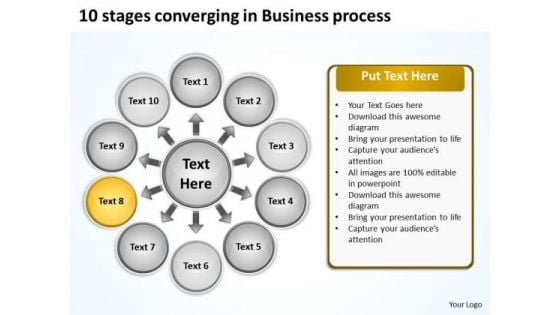
10 Stages Converging Business Process Cycle Chart PowerPoint Slides
We present our 10 stages converging business process Cycle Chart PowerPoint Slides.Use our Arrows PowerPoint Templates because there are various viable propositions available to further your commercial interests. Download our Flow charts PowerPoint Templates because you have developed a vision of where you want to be a few years from now. Download our Business PowerPoint Templates because you are ready to flap your wings and launch off. All poised are you to touch the sky with glory. Present our Process and Flows PowerPoint Templates because this is An innovative slide design depicting driving home the relevance of a steady rhythm. Present our Circle charts PowerPoint Templates because you watch them slowly start to savour the flavour you have served them.Use these PowerPoint slides for presentations relating to Business, chart, circle, colors, concept, corporate, cycle, data, design, detail, development, diagram, engineering, graphic, ideas, illustration, image, implement, implementation, life, lifecycle, management, model, objects, organization, plan, process, product, professional, project, quality, schema, shape, stack, stage, steps, strategy, structure, success, symbol. The prominent colors used in the PowerPoint template are Yellow, White, Gray. You can be sure our 10 stages converging business process Cycle Chart PowerPoint Slides are Swanky. Presenters tell us our corporate PowerPoint templates and PPT Slides are Classic. We assure you our 10 stages converging business process Cycle Chart PowerPoint Slides are One-of-a-kind. Customers tell us our data PowerPoint templates and PPT Slides are Bold. Presenters tell us our 10 stages converging business process Cycle Chart PowerPoint Slides are Handsome. You can be sure our circle PowerPoint templates and PPT Slides are Festive. Collect the facts together on our 10 Stages Converging Business Process Cycle Chart PowerPoint Slides. Draw your conclusions with comparative ease.
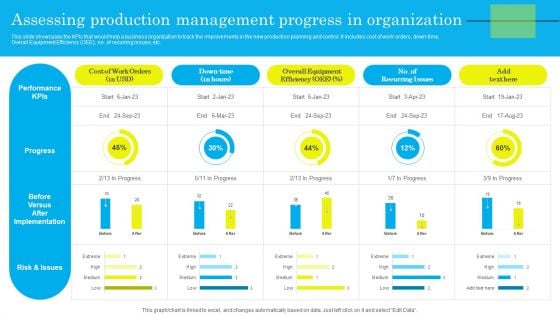
Assessing Production Management Progress In Organization Template PDF
This slide showcases the KPIs that would help a business organization to track the improvements in the new production planning and control. It includes cost of work orders, down-time, Overall Equipment Efficiency OEE, no. of recurring issues, etc. Presenting this PowerPoint presentation, titled Assessing Production Management Progress In Organization Template PDF, with topics curated by our researchers after extensive research. This editable presentation is available for immediate download and provides attractive features when used. Download now and captivate your audience. Presenting this Assessing Production Management Progress In Organization Template PDF. Our researchers have carefully researched and created these slides with all aspects taken into consideration. This is a completely customizable Assessing Production Management Progress In Organization Template PDF that is available for immediate downloading. Download now and make an impact on your audience. Highlight the attractive features available with our PPTs.

Pie Chart Circular 8 Stages Process Cleaning Service Business Plan PowerPoint Slides
We present our pie chart circular 8 stages process cleaning service business plan PowerPoint Slides.Use our Circle Charts PowerPoint Templates because You can Stir your ideas in the cauldron of our PowerPoint Templates and Slides. Cast a magic spell on your audience. Download and present our Signs PowerPoint Templates because It will Strengthen your hand with your thoughts. They have all the aces you need to win the day. Present our Shapes PowerPoint Templates because Our PowerPoint Templates and Slides will provide you a launch platform. Give a lift off to your ideas and send them into orbit. Download our Process and Flows PowerPoint Templates because Our PowerPoint Templates and Slides will provide weight to your words. They will bring out the depth of your thought process. Use our Business PowerPoint Templates because Our PowerPoint Templates and Slides will let Your superior ideas hit the target always and everytime.Use these PowerPoint slides for presentations relating to sign, overview, chart, market, statistics, sales, forecasting, slice, economy, display, corporate, business, concept, presentation, symbol, diagram, percentage, graphic, finance, data, bank, report, marketing, analyzing, trading, accounting, management, graph, icon, earnings, piece, circular, strategy, growth, company, control, competition, progress, account, profit, part, information, investment, banking, index, financial, results, portion, performance, exchange. The prominent colors used in the PowerPoint template are Green, Blue, White. Fall back on our Pie Chart Circular 8 Stages Process Cleaning Service Business Plan PowerPoint Slides at anytime. They are always ready and able to answer your call.
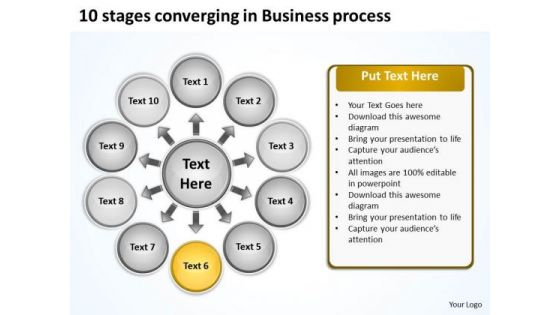
10 Stages Converging Business Process Cycle Layout Diagram PowerPoint Templates
We present our 10 stages converging business process Cycle Layout Diagram PowerPoint templates.Present our Arrows PowerPoint Templates because this is a good example of the strength of teamwork. Use our Flow charts PowerPoint Templates because it gives you really bright ideas. Download and present our Business PowerPoint Templates because maximising sales of your product is the intended destination. Present our Process and Flows PowerPoint Templates because it demonstrates the seeds of many of our successes. Download our Circle charts PowerPoint Templates because it expound on why you have discarded some plans as you went along to the apex and came out with the final selection which you know will make you and your team shine.Use these PowerPoint slides for presentations relating to Business, chart, circle, colors, concept, corporate, cycle, data, design, detail, development, diagram, engineering, graphic, ideas, illustration, image, implement, implementation, life, lifecycle, management, model, objects, organization, plan, process, product, professional, project, quality, schema, shape, stack, stage, steps, strategy, structure, success, symbol. The prominent colors used in the PowerPoint template are Blue, White, Black. You can be sure our 10 stages converging business process Cycle Layout Diagram PowerPoint templates are topically designed to provide an attractive backdrop to any subject. Presenters tell us our colors PowerPoint templates and PPT Slides are Energetic. We assure you our 10 stages converging business process Cycle Layout Diagram PowerPoint templates will save the presenter time. Customers tell us our corporate PowerPoint templates and PPT Slides are Splendid. Presenters tell us our 10 stages converging business process Cycle Layout Diagram PowerPoint templates are Handsome. You can be sure our circle PowerPoint templates and PPT Slides are Cheerful. Excite the connoisseurs with our 10 Stages Converging Business Process Cycle Layout Diagram PowerPoint Templates. Your thoughts will get a befitting display.
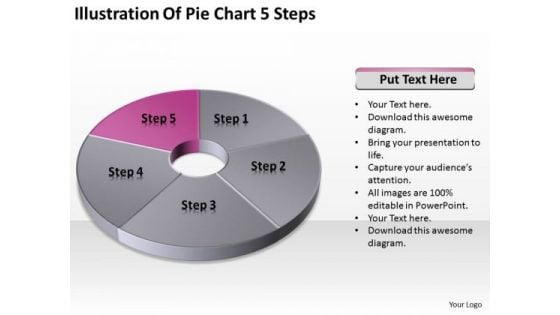
Illustration Of Pie Chart 5 Step Ppt Samples Business Plan PowerPoint Templates
We present our illustration of pie chart 5 step ppt samples business plan PowerPoint templates.Download our Circle Charts PowerPoint Templates because Our PowerPoint Templates and Slides are designed to help you succeed. They have all the ingredients you need. Present our Shapes PowerPoint Templates because You can Channelise the thoughts of your team with our PowerPoint Templates and Slides. Urge them to focus on the goals you have set. Use our Success PowerPoint Templates because Our PowerPoint Templates and Slides will let your ideas bloom. Create a bed of roses for your audience. Use our Business PowerPoint Templates because It will let you Set new benchmarks with our PowerPoint Templates and Slides. They will keep your prospects well above par. Download our Process and Flows PowerPoint Templates because Our PowerPoint Templates and Slides will let Your superior ideas hit the target always and everytime.Use these PowerPoint slides for presentations relating to pie, chart, market, statistics, sales, slice, economy, display, corporate, business, concept, render, success, presentation, diagram, percentage, graphic, finance, data, bank, report, marketing, accounting, management, graph, illustration, icon, piece, strategy, money, growth, company, control, competition, progress, account, sheet, profit, part, information, investment, improvement, banking, index, financial, reflect, results, performance, exchange. The prominent colors used in the PowerPoint template are Pink, Gray, Black. There is one thing our Illustration Of Pie Chart 5 Step Ppt Samples Business Plan PowerPoint Templates cannot do. They cannot be drab and dreary.
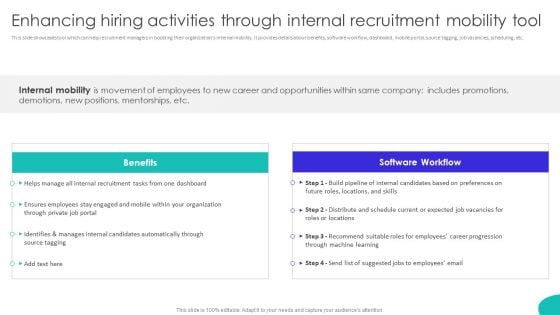
Improving Technology Based Enhancing Hiring Activities Through Internal Recruitment Infographics PDF
This slide showcases tool which can help recruitment managers in boosting their organizations internal mobility. It provides details about benefits, software workflow, dashboard, mobile portal, source tagging, job vacancies, scheduling, etc. If you are looking for a format to display your unique thoughts, then the professionally designed Improving Technology Based Enhancing Hiring Activities Through Internal Recruitment Infographics PDF is the one for you. You can use it as a Google Slides template or a PowerPoint template. Incorporate impressive visuals, symbols, images, and other charts. Modify or reorganize the text boxes as you desire. Experiment with shade schemes and font pairings. Alter, share or cooperate with other people on your work. Download Improving Technology Based Enhancing Hiring Activities Through Internal Recruitment Infographics PDF and find out how to give a successful presentation. Present a perfect display to your team and make your presentation unforgettable.
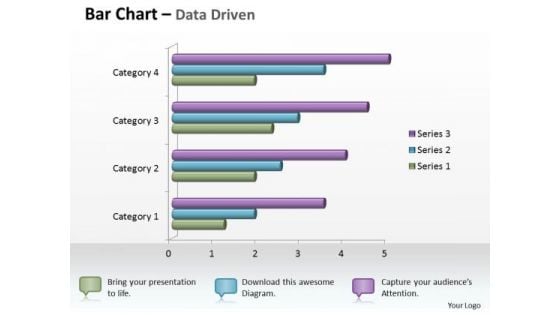
Data Analysis In Excel 3d Bar Chart For Business Statistics PowerPoint Templates
Knock On The Door To Success With Our data analysis in excel 3d bar chart for business statistics Powerpoint Templates . Be Assured Of Gaining Entry.


 Continue with Email

 Home
Home


