Quality Dashboard

Data Lineage Implementation Working Process Of Data Lineage System Designs PDF
This slide talks about the working process of the data lineage system, from metadata to final reports or dashboards for non-technical end users. The components include metadata, process, database systems and reports. This Data Lineage Implementation Working Process Of Data Lineage System Designs PDF is perfect for any presentation, be it in front of clients or colleagues. It is a versatile and stylish solution for organizing your meetings. The Data Lineage Implementation Working Process Of Data Lineage System Designs PDF features a modern design for your presentation meetings. The adjustable and customizable slides provide unlimited possibilities for acing up your presentation. Slidegeeks has done all the homework before launching the product for you. So, do not wait, grab the presentation templates today
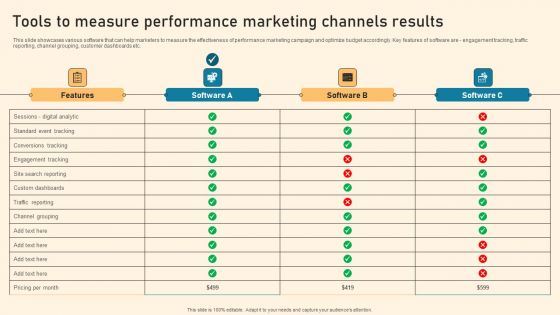
Tools To Measure Performance Marketing Channels Results Ppt PowerPoint Presentation File Backgrounds PDF
This slide showcases various software that can help marketers to measure the effectiveness of performance marketing campaign and optimize budget accordingly. Key features of software are - engagement tracking, traffic reporting, channel grouping, customer dashboards etc. Retrieve professionally designed Tools To Measure Performance Marketing Channels Results Ppt PowerPoint Presentation File Backgrounds PDF to effectively convey your message and captivate your listeners. Save time by selecting pre made slideshows that are appropriate for various topics, from business to educational purposes. These themes come in many different styles, from creative to corporate, and all of them are easily adjustable and can be edited quickly. Access them as PowerPoint templates or as Google Slides themes. You do not have to go on a hunt for the perfect presentation because Slidegeeks got you covered from everywhere.

Checklist For Successful SEO Strategy In Healthcare Training Ppt
This slide covers healthcare SEO strategy checklist. It includes optimization of meta and title tags, correct internal link utilizations, optimization of media, generating high-quality backlinks, etc.
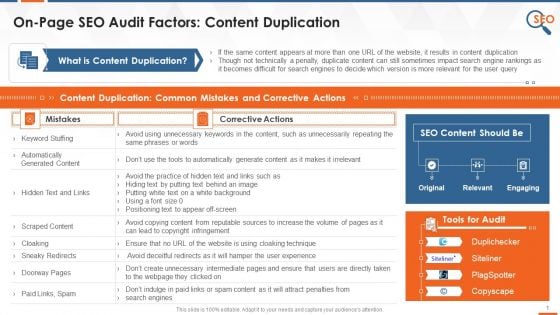
On Page SEO Audit Factor Content Duplication Training Ppt
This slide provides information regarding the content duplication issues and associated corrective actions in On-Page SEO audit. It also contains details of features of high-quality SEO content.

Definition And Uses Of Search Engine Optimization SEO As A Business Tool Training Ppt
This slide provides information regarding the definition of search engine optimization and its uses, i.e. improving search engine ranking and increasing website traffic quantity and quality.
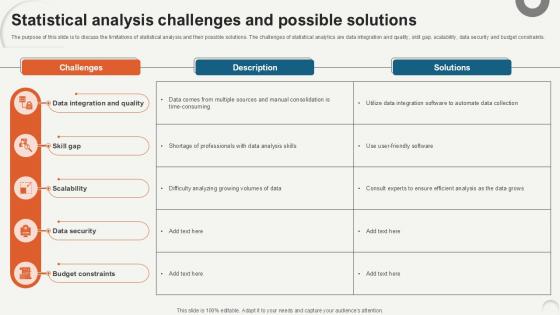
Statistical Analysis Challenges Data Analytics For Informed Decision Ppt Example
The purpose of this slide is to discuss the limitations of statistical analysis and their possible solutions. The challenges of statistical analytics are data integration and quality, skill gap, scalability, data security and budget constraints. Slidegeeks has constructed Statistical Analysis Challenges Data Analytics For Informed Decision Ppt Example after conducting extensive research and examination. These presentation templates are constantly being generated and modified based on user preferences and critiques from editors. Here, you will find the most attractive templates for a range of purposes while taking into account ratings and remarks from users regarding the content. This is an excellent jumping-off point to explore our content and will give new users an insight into our top-notch PowerPoint Templates. The purpose of this slide is to discuss the limitations of statistical analysis and their possible solutions. The challenges of statistical analytics are data integration and quality, skill gap, scalability, data security and budget constraints.
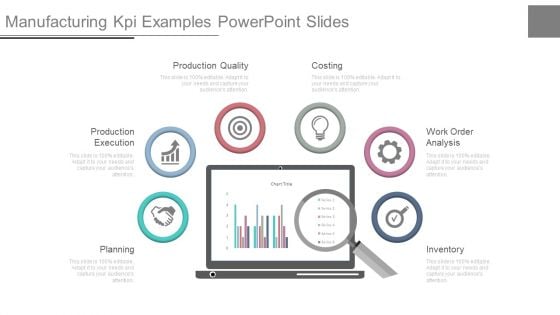
Manufacturing Kpi Examples Powerpoint Slides
This is a manufacturing kpi examples powerpoint slides. This is a six stage process. The stages in this process are planning, production execution, production quality, costing, work order analysis, inventory.
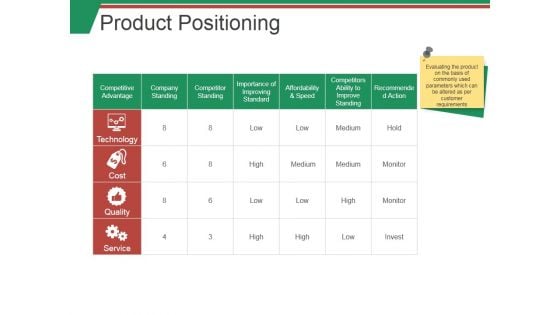
Product Positioning Ppt PowerPoint Presentation Infographics Examples
This is a product positioning ppt powerpoint presentation infographics examples. This is a four stage process. The stages in this process are competitive, advantage, technology, cost, quality.
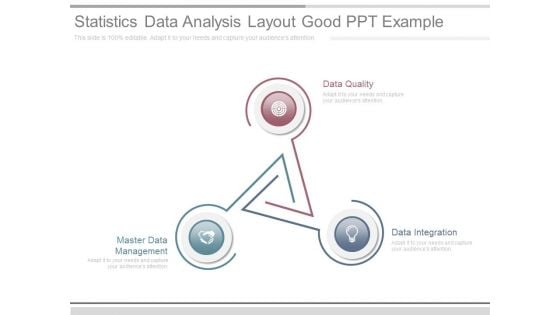
Statistics Data Analysis Layout Good Ppt Example
This is a statistics data analysis layout good ppt example. This is a three stage process. The stages in this process are data quality, data integration, master data management.
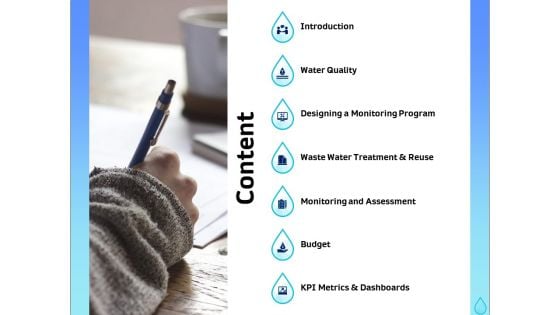
Integrated Water Resource Management Content Ppt Model Graphic Images PDF
Presenting this set of slides with name integrated water resource management content ppt model graphic images pdf. This is a seven stage process. The stages in this process are introduction, water quality, designing a monitoring program, waste water treatment and reuse, monitoring and assessment, budget, kpi metrics and dashboards. This is a completely editable PowerPoint presentation and is available for immediate download. Download now and impress your audience.
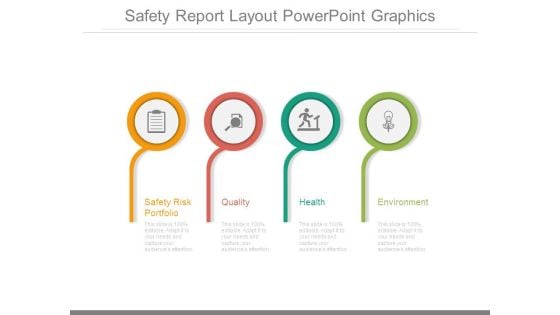
Safety Report Layout Powerpoint Graphics
This is a safety report layout powerpoint graphics. This is a four stage process. The stages in this process are safety risk portfolio, quality, health, environment.
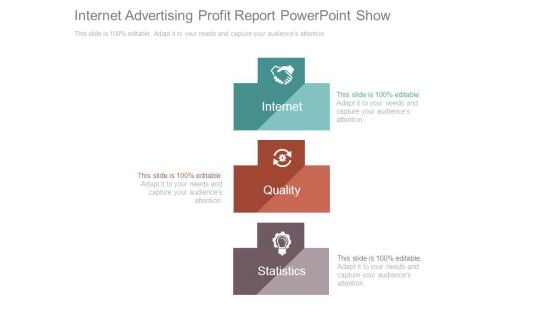
Internet Advertising Profit Report Powerpoint Show
This is a internet advertising profit report powerpoint show. This is a three stage process. The stages in this process are internet, quality, statistics.
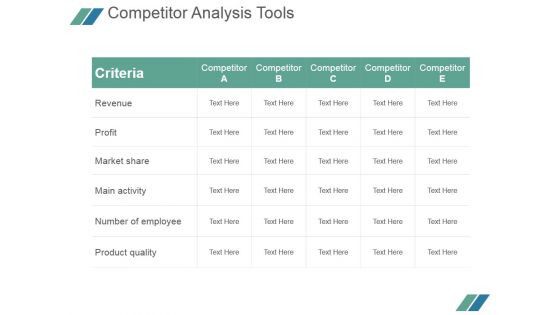
Competitor Analysis Tools Ppt PowerPoint Presentation Example File
This is a competitor analysis tools ppt powerpoint presentation example file. This is a five stage process. The stages in this process are criteria, revenue, profit, market share, main activity, number of employee, product quality.

Before Vs After Performing Data Analytics For Informed Decision Ppt Template
This slide shows the before vs. after comparison of statistical analysis of business data. The different aspects compared in this slide are decision-making, operational efficiency, customer insights, product quality, revenue generation, supply chain efficiency, etc. Create an editable Before Vs After Performing Data Analytics For Informed Decision Ppt Template that communicates your idea and engages your audience. Whether you are presenting a business or an educational presentation, pre-designed presentation templates help save time. Before Vs After Performing Data Analytics For Informed Decision Ppt Template is highly customizable and very easy to edit, covering many different styles from creative to business presentations. Slidegeeks has creative team members who have crafted amazing templates. So, go and get them without any delay. This slide shows the before vs. after comparison of statistical analysis of business data. The different aspects compared in this slide are decision-making, operational efficiency, customer insights, product quality, revenue generation, supply chain efficiency, etc.
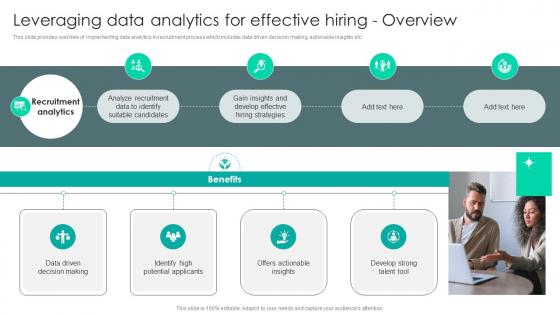
Strategic Staffing Using Data Leveraging Data Analytics For Effective Hiring Overview CRP DK SS V
This slide provides overview of implementing data analytics in recruitment process which includes data driven decision making, actionable insights etc. Here you can discover an assortment of the finest PowerPoint and Google Slides templates. With these templates, you can create presentations for a variety of purposes while simultaneously providing your audience with an eye-catching visual experience. Download Strategic Staffing Using Data Leveraging Data Analytics For Effective Hiring Overview CRP DK SS V to deliver an impeccable presentation. These templates will make your job of preparing presentations much quicker, yet still, maintain a high level of quality. Slidegeeks has experienced researchers who prepare these templates and write high-quality content for you. Later on, you can personalize the content by editing the Strategic Staffing Using Data Leveraging Data Analytics For Effective Hiring Overview CRP DK SS V. This slide provides overview of implementing data analytics in recruitment process which includes data driven decision making, actionable insights etc.

Big Data Management And Analytics Revolutionizing Production IoT Ppt Sample
The following slide is to represent big data management challenges faced in manufacturing facilities. It includes challenges such as data silos, poor data quality, etc. Do you have to make sure that everyone on your team knows about any specific topic I yes, then you should give Big Data Management And Analytics Revolutionizing Production IoT Ppt Sample a try. Our experts have put a lot of knowledge and effort into creating this impeccable Big Data Management And Analytics Revolutionizing Production IoT Ppt Sample. You can use this template for your upcoming presentations, as the slides are perfect to represent even the tiniest detail. You can download these templates from the Slidegeeks website and these are easy to edit. So grab these today The following slide is to represent big data management challenges faced in manufacturing facilities. It includes challenges such as data silos, poor data quality, etc.
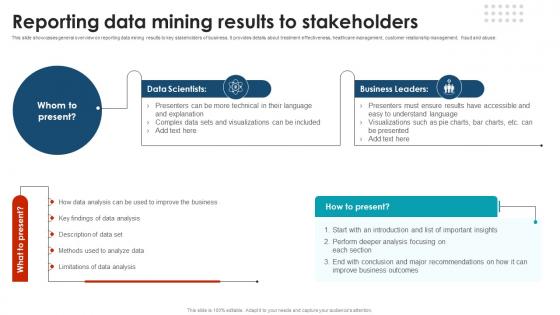
Reporting Data Mining Results To Stakeholders Using Data Mining Tools To Optimize Processes AI SS V
This slide showcases general overview on reporting data mining results to key stakeholders of business. It provides details about treatment effectiveness, healthcare management, customer relationship management, fraud and abuse. Here you can discover an assortment of the finest PowerPoint and Google Slides templates. With these templates, you can create presentations for a variety of purposes while simultaneously providing your audience with an eye-catching visual experience. Download Reporting Data Mining Results To Stakeholders Using Data Mining Tools To Optimize Processes AI SS V to deliver an impeccable presentation. These templates will make your job of preparing presentations much quicker, yet still, maintain a high level of quality. Slidegeeks has experienced researchers who prepare these templates and write high-quality content for you. Later on, you can personalize the content by editing the Reporting Data Mining Results To Stakeholders Using Data Mining Tools To Optimize Processes AI SS V. This slide showcases general overview on reporting data mining results to key stakeholders of business. It provides details about treatment effectiveness, healthcare management, customer relationship management, fraud and abuse.

Global Data Security Industry Report Global Cybersecurity Industry A Quick Snapshot IR SS V
This slide provides a glimpse of key highlights of the cybersecurity industry, enabling executives to grasp the main findings quickly. It serves as a snapshot highlighting revenue, CAGR, fastest growing region, segments, regional breakdown, and key market players. If you are looking for a format to display your unique thoughts, then the professionally designed Global Data Security Industry Report Global Cybersecurity Industry A Quick Snapshot IR SS V is the one for you. You can use it as a Google Slides template or a PowerPoint template. Incorporate impressive visuals, symbols, images, and other charts. Modify or reorganize the text boxes as you desire. Experiment with shade schemes and font pairings. Alter, share or cooperate with other people on your work. Download Global Data Security Industry Report Global Cybersecurity Industry A Quick Snapshot IR SS V and find out how to give a successful presentation. Present a perfect display to your team and make your presentation unforgettable. This slide provides a glimpse of key highlights of the cybersecurity industry, enabling executives to grasp the main findings quickly. It serves as a snapshot highlighting revenue, CAGR, fastest growing region, segments, regional breakdown, and key market players.
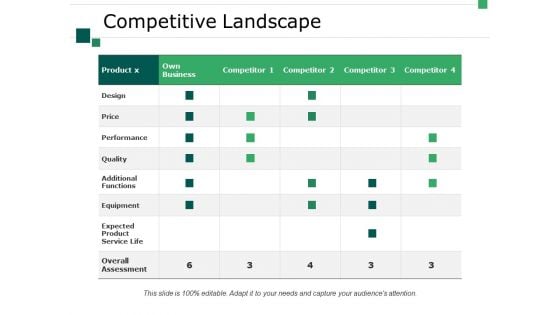
Competitive Landscape Ppt PowerPoint Presentation Infographics Ideas
This is a competitive landscape ppt powerpoint presentation infographics ideas. This is a four stage process. The stages in this process are design, price, performance, quality, additional functions.
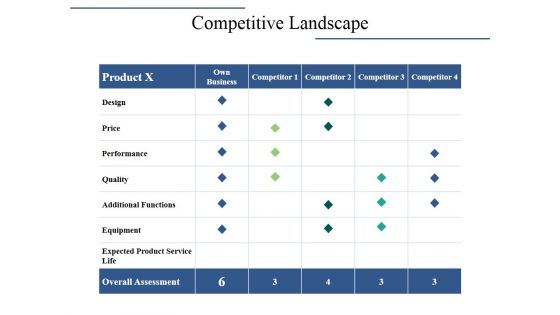
Competitive Landscape Ppt PowerPoint Presentation Infographics Visual Aids
This is a competitive landscape ppt powerpoint presentation infographics visual aids. This is a four stage process. The stages in this process are design, price, performance, quality, equipment.
Assessment And Market Position Of Competitors Product Product Range Ppt PowerPoint Presentation Pictures Icons
This is a assessment and market position of competitors product product range ppt powerpoint presentation pictures icons. This is a four stage process. The stages in this process are design, price, performance, quality, additional functions.

Assessment And Market Position Of Competitors Product Product Range Ppt PowerPoint Presentation Pictures Design Ideas
This is a assessment and market position of competitors product product range ppt powerpoint presentation pictures design ideas. This is a five stage process. The stages in this process are design, price, performance, quality, additional functions.
Communication And Coordination Framework Ppt Icon
This is a communication and coordination framework ppt icon. This is a four stage process. The stages in this process are workflow tools, quality, reporting, communication, technology.
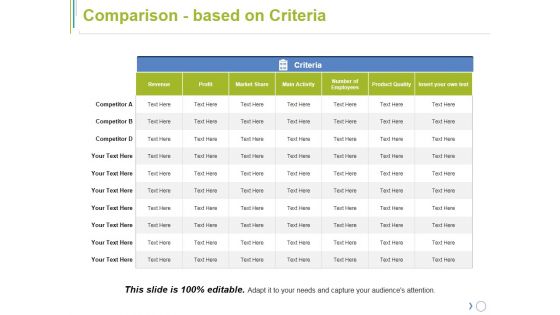
Comparison Based On Criteria Ppt PowerPoint Presentation Model Inspiration
This is a comparison based on criteria ppt powerpoint presentation model inspiration. This is a seven stage process. The stages in this process are revenue, profit, market share, number of employees, product quality.
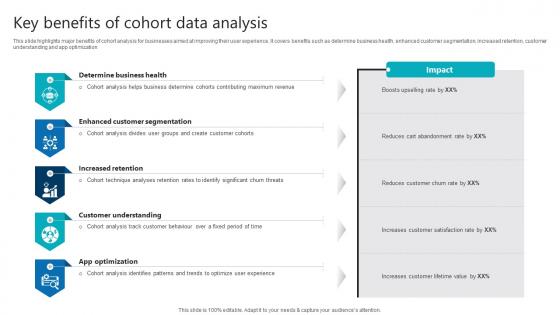
Key Benefits Of Cohort Data Analysis Product Analytics Implementation Data Analytics V
This slide highlights major benefits of cohort analysis for businesses aimed at improving their user experience. It covers benefits such as determine business health, enhanced customer segmentation, increased retention, customer understanding and app optimization Here you can discover an assortment of the finest PowerPoint and Google Slides templates. With these templates, you can create presentations for a variety of purposes while simultaneously providing your audience with an eye-catching visual experience. Download Key Benefits Of Cohort Data Analysis Product Analytics Implementation Data Analytics V to deliver an impeccable presentation. These templates will make your job of preparing presentations much quicker, yet still, maintain a high level of quality. Slidegeeks has experienced researchers who prepare these templates and write high-quality content for you. Later on, you can personalize the content by editing the Key Benefits Of Cohort Data Analysis Product Analytics Implementation Data Analytics V. This slide highlights major benefits of cohort analysis for businesses aimed at improving their user experience. It covers benefits such as determine business health, enhanced customer segmentation, increased retention, customer understanding and app optimization
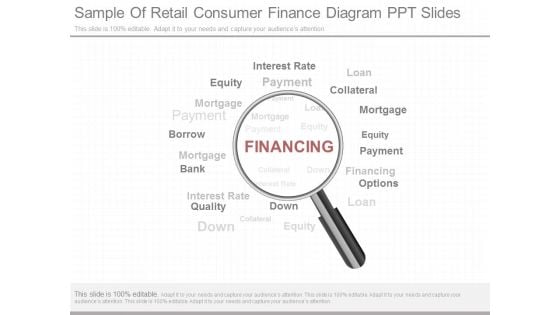
Sample Of Retail Consumer Finance Diagram Ppt Slides
This is a sample of retail consumer finance diagram ppt slides. This is a one stage process. The stages in this process are payment, options, down, quality, bank, borrow, equity.
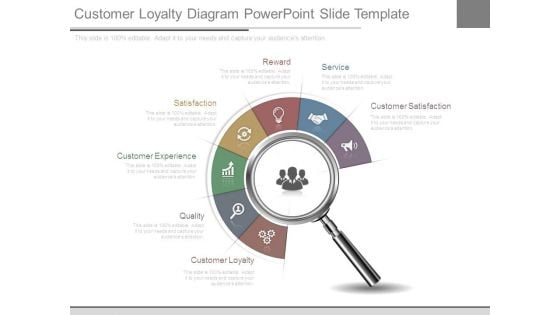
Customer Loyalty Diagram Powerpoint Slide Template
This is a customer loyalty diagram powerpoint slide template. This is a seven stage process. The stages in this process are customer loyalty, quality, customer experience, satisfaction, reward, service, customer satisfaction.
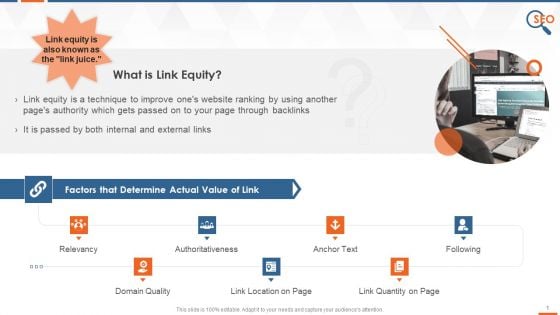
Building Link Equity And Contributing Factors Training Ppt
This slide provides information regarding the link juice and multiple factors that determine the links actual value, such as relevancy, authoritativeness, anchor text, following, domain quality, link location and quantity on page, and HTTPS status.
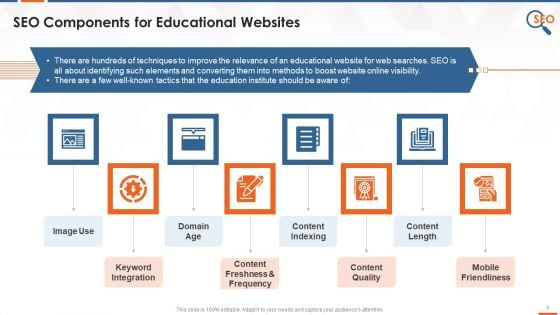
SEO Tactics For Educational Websites Training Ppt
This slide covers SEO techniques for schools, institutions, universities, departments, programs, and streams such as use of visual elements, keywords integration, domain age, fresh content and frequency, content indexing, quality, length, and mobile optimization
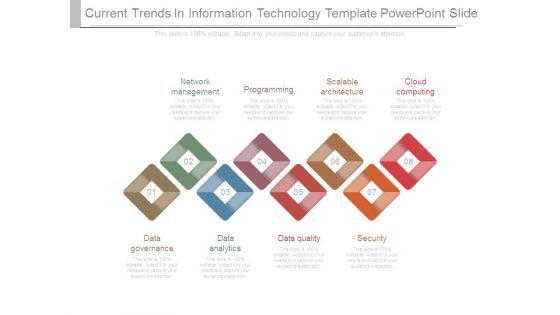
Current Trends In Information Technology Template Powerpoint Slide
This is a current trends in information technology template powerpoint slide. This is a eight stage process. The stages in this process are network management, programming, scalable architecture, cloud computing, data governance, data analytics, data quality, security.
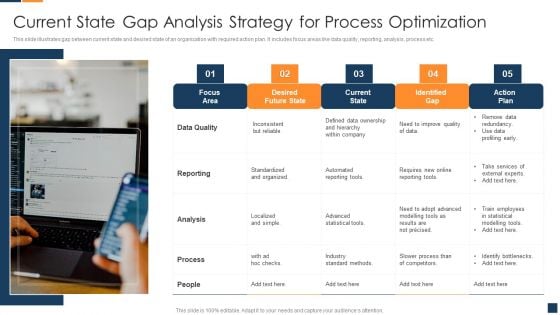
Current State Gap Analysis Strategy For Process Optimization Diagrams PDF
This slide illustrates gap between current state and desired state of an organization with required action plan. It includes focus areas like data quality, reporting, analysis, process etc. Presenting Current State Gap Analysis Strategy For Process Optimization Diagrams PDF to dispense important information. This template comprises five stages. It also presents valuable insights into the topics including Data Quality, Reporting, Analysis. This is a completely customizable PowerPoint theme that can be put to use immediately. So, download it and address the topic impactfully.
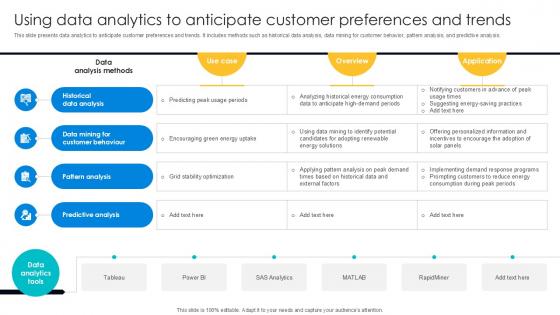
Using Data Analytics To Anticipate Digital Transformation Journey PPT PowerPoint DT SS V
This slide presents data analytics to anticipate customer preferences and trends. It includes methods such as historical data analysis, data mining for customer behavior, pattern analysis, and predictive analysis. Here you can discover an assortment of the finest PowerPoint and Google Slides templates. With these templates, you can create presentations for a variety of purposes while simultaneously providing your audience with an eye-catching visual experience. Download Historical Data Analysis, Data Mining For Customer Behaviour, Pattern Analysis to deliver an impeccable presentation. These templates will make your job of preparing presentations much quicker, yet still, maintain a high level of quality. Slidegeeks has experienced researchers who prepare these templates and write high-quality content for you. Later on, you can personalize the content by editing the Historical Data Analysis, Data Mining For Customer Behaviour, Pattern Analysis. This slide presents data analytics to anticipate customer preferences and trends. It includes methods such as historical data analysis, data mining for customer behavior, pattern analysis, and predictive analysis.
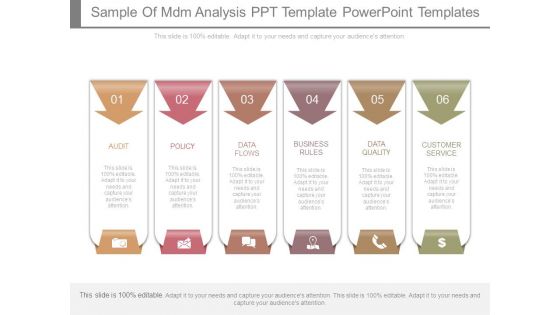
Sample Of Mdm Analysis Ppt Template Powerpoint Templates
This is a sample of mdm analysis ppt template powerpoint templates. This is a six stage process. The stages in this process are audit, policy, data flows, business rules, data quality, customer service.
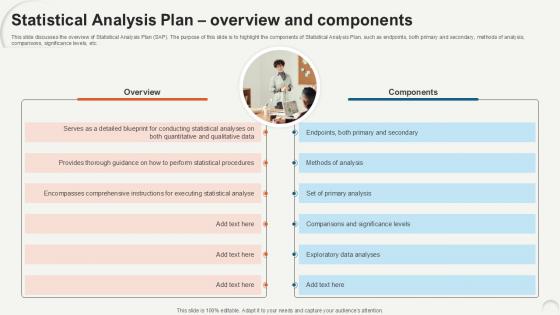
Statistical Analysis Plan Overview Data Analytics For Informed Decision Ppt Template
This slide discusses the overview of Statistical Analysis Plan SAP. The purpose of this slide is to highlight the components of Statistical Analysis Plan, such as endpoints, both primary and secondary, methods of analysis, comparisons, significance levels, etc. Here you can discover an assortment of the finest PowerPoint and Google Slides templates. With these templates, you can create presentations for a variety of purposes while simultaneously providing your audience with an eye-catching visual experience. Download Statistical Analysis Plan Overview Data Analytics For Informed Decision Ppt Template to deliver an impeccable presentation. These templates will make your job of preparing presentations much quicker, yet still, maintain a high level of quality. Slidegeeks has experienced researchers who prepare these templates and write high-quality content for you. Later on, you can personalize the content by editing the Statistical Analysis Plan Overview Data Analytics For Informed Decision Ppt Template. This slide discusses the overview of Statistical Analysis Plan SAP. The purpose of this slide is to highlight the components of Statistical Analysis Plan, such as endpoints, both primary and secondary, methods of analysis, comparisons, significance levels, etc.
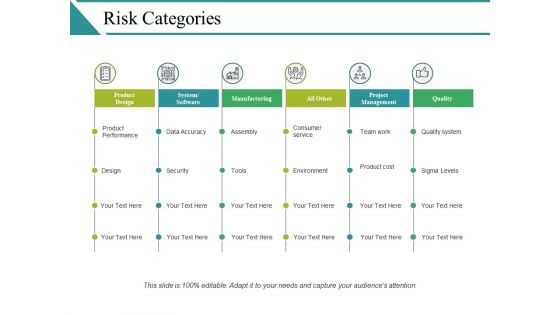
Risk Categories Ppt PowerPoint Presentation Portfolio Graphics
This is a risk categories ppt powerpoint presentation portfolio graphics. This is a six stage process. The stages in this process are product design, manufacturing, all other, project management, quality.
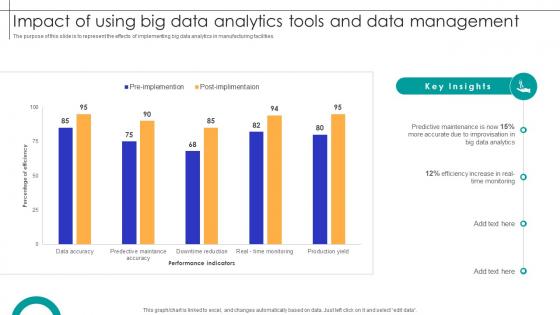
Impact Of Using Big Data Analytics Tools And Data Management Streamlining Production Ppt Example
The purpose of this slide is to represent the effects of implementing big data analytics in manufacturing facilities. Here you can discover an assortment of the finest PowerPoint and Google Slides templates. With these templates, you can create presentations for a variety of purposes while simultaneously providing your audience with an eye-catching visual experience. Download Impact Of Using Big Data Analytics Tools And Data Management Streamlining Production Ppt Example to deliver an impeccable presentation. These templates will make your job of preparing presentations much quicker, yet still, maintain a high level of quality. Slidegeeks has experienced researchers who prepare these templates and write high-quality content for you. Later on, you can personalize the content by editing the Impact Of Using Big Data Analytics Tools And Data Management Streamlining Production Ppt Example The purpose of this slide is to represent the effects of implementing big data analytics in manufacturing facilities.
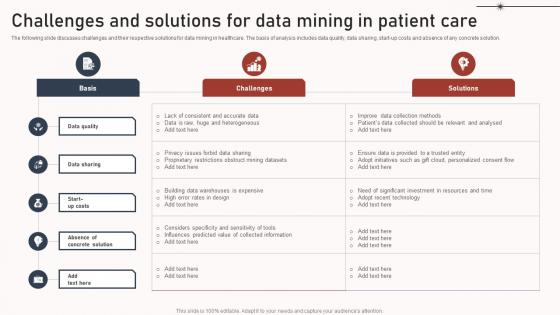
Challenges And Solutions For Data Mining In Patient Care Microsoft Pdf
The following slide discusses challenges and their respective solutions for data mining in healthcare. The basis of analysis includes data quality, data sharing, start up costs and absence of any concrete solution. Pitch your topic with ease and precision using this Challenges And Solutions For Data Mining In Patient Care Microsoft Pdf. This layout presents information on Data Quality, Data Sharing, Start Up Costs. It is also available for immediate download and adjustment. So, changes can be made in the color, design, graphics or any other component to create a unique layout. The following slide discusses challenges and their respective solutions for data mining in healthcare. The basis of analysis includes data quality, data sharing, start up costs and absence of any concrete solution.
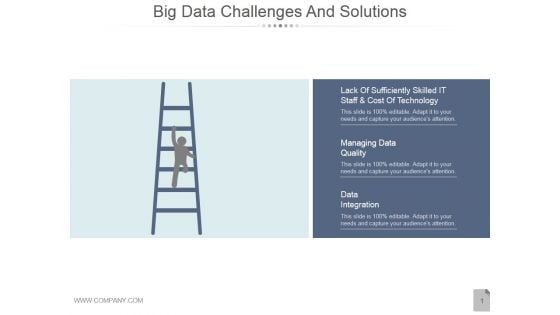
Big Data Challenges And Solutions Ppt PowerPoint Presentation Background Images
This is a big data challenges and solutions ppt powerpoint presentation background images. This is a one stage process. The stages in this process are lack of sufficiently skilled it staff and cost of technology, managing data quality, data integration.
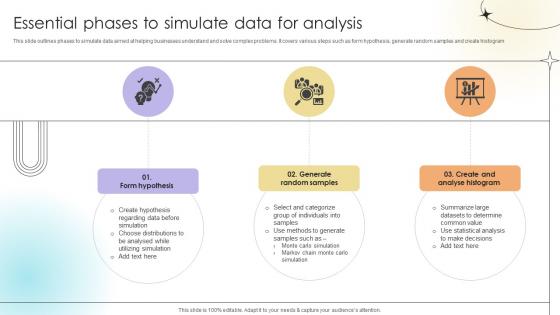
Essential Phases To Simulate Data For Analysis Data Analytics SS V
This slide outlines phases to simulate data aimed at helping businesses understand and solve complex problems. It covers various steps such as form hypothesis, generate random samples and create histogram.Here you can discover an assortment of the finest PowerPoint and Google Slides templates. With these templates, you can create presentations for a variety of purposes while simultaneously providing your audience with an eye-catching visual experience. Download Essential Phases To Simulate Data For Analysis Data Analytics SS V to deliver an impeccable presentation. These templates will make your job of preparing presentations much quicker, yet still, maintain a high level of quality. Slidegeeks has experienced researchers who prepare these templates and write high-quality content for you. Later on, you can personalize the content by editing the Essential Phases To Simulate Data For Analysis Data Analytics SS V. This slide outlines phases to simulate data aimed at helping businesses understand and solve complex problems. It covers various steps such as form hypothesis, generate random samples and create histogram.
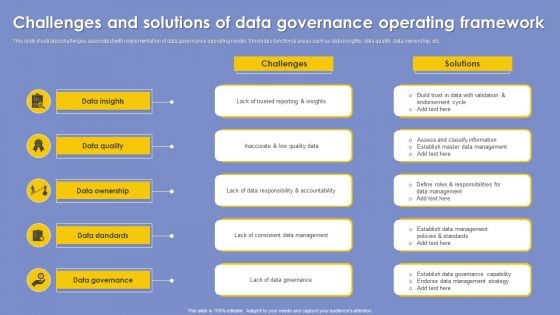
Challenges And Solutions Of Data Governance Operating Framework Rules PDF
This slide illustrates challenges associated with implementation of data governance operating model. It includes functional areas such as data insights, data quality, data ownership, etc. Presenting Challenges And Solutions Of Data Governance Operating Framework Rules PDF to dispense important information. This template comprises five stages. It also presents valuable insights into the topics including Data Insights, Data Quality, Data Ownership. This is a completely customizable PowerPoint theme that can be put to use immediately. So, download it and address the topic impactfully.
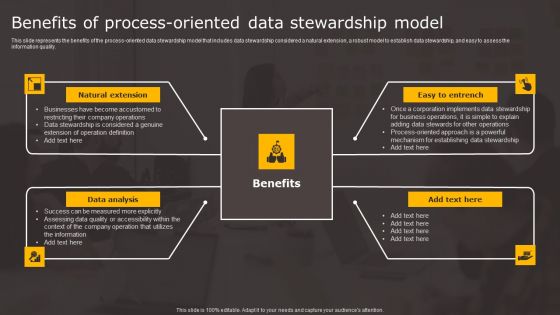
Data Stewardship In Business Processes Benefits Process Oriented Data Formats Pdf
This slide represents the benefits of the process oriented data stewardship model that includes data stewardship considered a natural extension, a robust model to establish data stewardship, and easy to assess the information quality. Welcome to our selection of the Data Stewardship In Business Processes Benefits Process Oriented Data Formats Pdf. These are designed to help you showcase your creativity and bring your sphere to life. Planning and Innovation are essential for any business that is just starting out. This collection contains the designs that you need for your everyday presentations. All of our PowerPoints are 100 percent editable, so you can customize them to suit your needs. This multi purpose template can be used in various situations. Grab these presentation templates today This slide represents the benefits of the process oriented data stewardship model that includes data stewardship considered a natural extension, a robust model to establish data stewardship, and easy to assess the information quality.
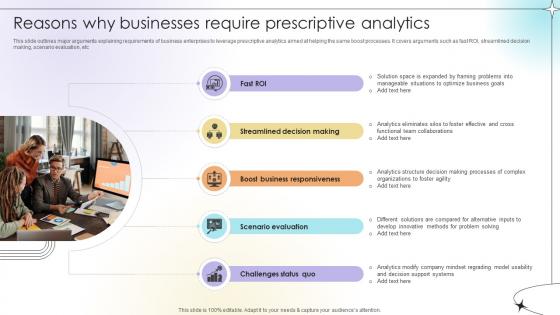
Reasons Why Businesses Require Prescriptive Analytics Data Analytics SS V
This slide outlines major arguments explaining requirements of business enterprises to leverage prescriptive analytics aimed at helping the same boost processes. It covers arguments such as fast ROI, streamlined decision making, scenario evaluation, etc.Here you can discover an assortment of the finest PowerPoint and Google Slides templates. With these templates, you can create presentations for a variety of purposes while simultaneously providing your audience with an eye-catching visual experience. Download Reasons Why Businesses Require Prescriptive Analytics Data Analytics SS V to deliver an impeccable presentation. These templates will make your job of preparing presentations much quicker, yet still, maintain a high level of quality. Slidegeeks has experienced researchers who prepare these templates and write high-quality content for you. Later on, you can personalize the content by editing the Reasons Why Businesses Require Prescriptive Analytics Data Analytics SS V. This slide outlines major arguments explaining requirements of business enterprises to leverage prescriptive analytics aimed at helping the same boost processes. It covers arguments such as fast ROI, streamlined decision making, scenario evaluation, etc.
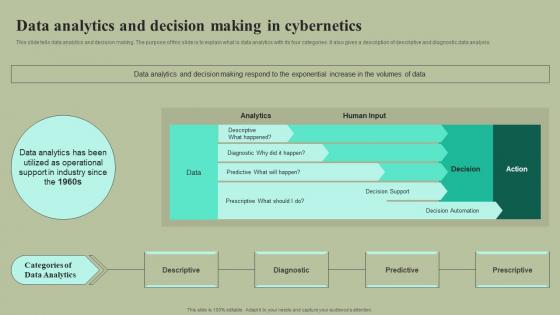
Data Analytics And Decision Making In Cybernetics Cybernetic Integration Inspiration Pdf
This slide tells data analytics and decision making. The purpose of this slide is to explain what is data analytics with its four categories. It also gives a description of descriptive and diagnostic data analysis. Here you can discover an assortment of the finest PowerPoint and Google Slides templates. With these templates, you can create presentations for a variety of purposes while simultaneously providing your audience with an eye-catching visual experience. Download Data Analytics And Decision Making In Cybernetics Cybernetic Integration Inspiration Pdf to deliver an impeccable presentation. These templates will make your job of preparing presentations much quicker, yet still, maintain a high level of quality. Slidegeeks has experienced researchers who prepare these templates and write high-quality content for you. Later on, you can personalize the content by editing the Data Analytics And Decision Making In Cybernetics Cybernetic Integration Inspiration Pdf This slide tells data analytics and decision making. The purpose of this slide is to explain what is data analytics with its four categories. It also gives a description of descriptive and diagnostic data analysis.
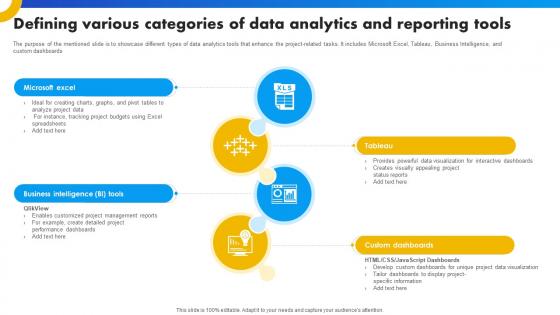
Defining Various Categories Of Data Analytics And Reporting Tools Strategies For Success In Digital
The purpose of the mentioned slide is to showcase different types of data analytics tools that enhance the project-related tasks. It includes Microsoft Excel, Tableau, Business Intelligence, and custom dashboards. Slidegeeks is here to make your presentations a breeze with Defining Various Categories Of Data Analytics And Reporting Tools Strategies For Success In Digital With our easy-to-use and customizable templates, you can focus on delivering your ideas rather than worrying about formatting. With a variety of designs to choose from, you are sure to find one that suits your needs. And with animations and unique photos, illustrations, and fonts, you can make your presentation pop. So whether you are giving a sales pitch or presenting to the board, make sure to check out Slidegeeks first The purpose of the mentioned slide is to showcase different types of data analytics tools that enhance the project-related tasks. It includes Microsoft Excel, Tableau, Business Intelligence, and custom dashboards.
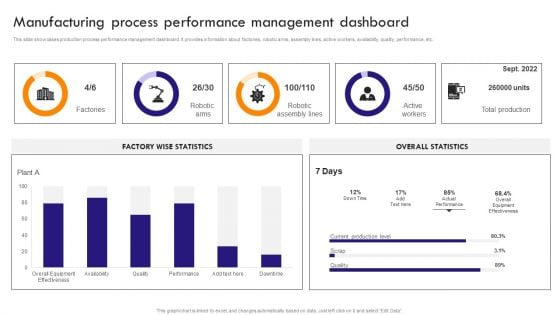
Implementing Robotic Process Manufacturing Process Performance Management Sample PDF
This slide showcases production process performance management dashboard. It provides information about factories, robotic arms, assembly lines, active workers, availability, quality, performance, etc. The Implementing Robotic Process Manufacturing Process Performance Management Sample PDF is a compilation of the most recent design trends as a series of slides. It is suitable for any subject or industry presentation, containing attractive visuals and photo spots for businesses to clearly express their messages. This template contains a variety of slides for the user to input data, such as structures to contrast two elements, bullet points, and slides for written information. Slidegeeks is prepared to create an impression.
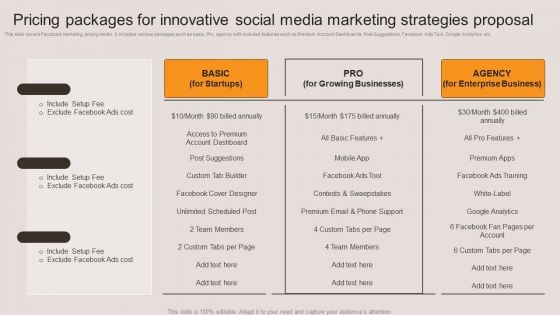
Pricing Packages For Innovative Social Media Marketing Strategies Proposal Designs PDF
This slide covers Facebook marketing pricing model. It includes various packages such as basic, Pro, agency with included features such as Premium Account Dashboards, Post Suggestions, Facebook Ads Tool, Google Analytics, etc. Power up your presentations with our Pricing Packages For Innovative Social Media Marketing Strategies Proposal Designs PDF single-slide PPT template. Our visually-stunning template will help you deliver your message with confidence. With easy-to-use editing options and fully customizable features, you can create polished and captivating presentations in no time. Say goodbye to boring slides and hello to impactful presentations with our top-quality template. Download now and get ready to wow your audience. singles
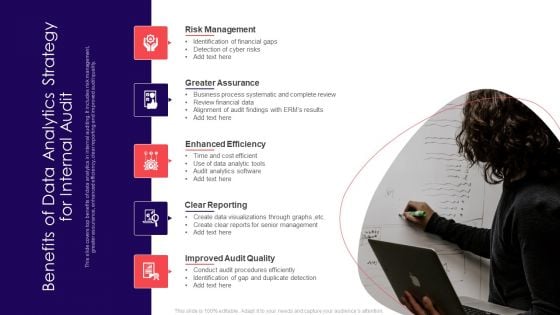
Benefits Of Data Analytics Strategy For Internal Audit Introduction PDF
This slide covers top benefits of data analytics in internal auditing. It includes risk management, greater assurance, enhanced efficiency, clear reporting and improved audit quality. Presenting Benefits Of Data Analytics Strategy For Internal Audit Introduction PDF to dispense important information. This template comprises five stages. It also presents valuable insights into the topics including Enhanced Efficiency, Risk Management, Greater Assurance. This is a completely customizable PowerPoint theme that can be put to use immediately. So, download it and address the topic impactfully.

Global Data Security Industry Report Geographical Analysis For Cybersecurity Industry IR SS V
The slide highlights the geographical summary of current state of cybersecurity industry. The purpose of the slide is to provide insights on cybersecurity landscape, trends, development at regional levels. It helps stakeholders in understanding the market dynamics, regulatory environments and potential growth opportunities. If your project calls for a presentation, then Slidegeeks is your go-to partner because we have professionally designed, easy-to-edit templates that are perfect for any presentation. After downloading, you can easily edit Global Data Security Industry Report Geographical Analysis For Cybersecurity Industry IR SS V and make the changes accordingly. You can rearrange slides or fill them with different images. Check out all the handy templates The slide highlights the geographical summary of current state of cybersecurity industry. The purpose of the slide is to provide insights on cybersecurity landscape, trends, development at regional levels. It helps stakeholders in understanding the market dynamics, regulatory environments and potential growth opportunities.

Global Data Security Industry Report Pestle Analysis Of Global Cybersecurity Industry IR SS V
The slide depicts PESTLE analysis which companies can use to evaluate the external factors that impact the industrys growth and profitability. It enables companies to make informed decisions and strategic planning in a dynamic business environment. Key components include political, legal, economic, social, technological and environmental aspects. This Global Data Security Industry Report Pestle Analysis Of Global Cybersecurity Industry IR SS V is perfect for any presentation, be it in front of clients or colleagues. It is a versatile and stylish solution for organizing your meetings. The Global Data Security Industry Report Pestle Analysis Of Global Cybersecurity Industry IR SS V features a modern design for your presentation meetings. The adjustable and customizable slides provide unlimited possibilities for acing up your presentation. Slidegeeks has done all the homework before launching the product for you. So, do not wait, grab the presentation templates today The slide depicts PESTLE analysis which companies can use to evaluate the external factors that impact the industrys growth and profitability. It enables companies to make informed decisions and strategic planning in a dynamic business environment. Key components include political, legal, economic, social, technological and environmental aspects.
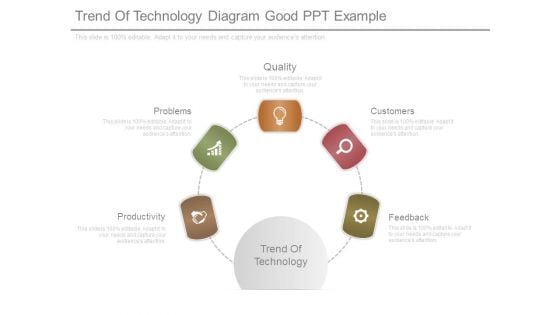
Trend Of Technology Diagram Good Ppt Example
This is a trend of technology diagram good ppt example. This is a five stage process. The stages in this process are productivity, problems, quality, customers, feedback, trend of technology.
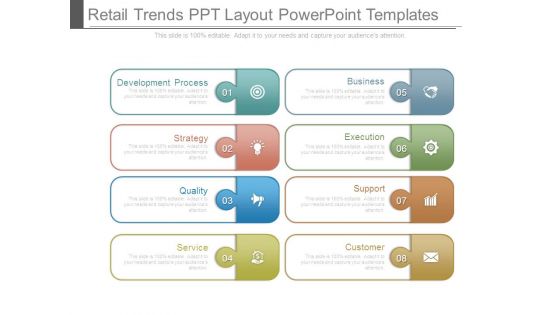
Retail Trends Ppt Layout Powerpoint Templates
This is a retail trends ppt layout powerpoint templates. This is a eight stage process. The stages in this process are development process, strategy, quality, service, business, execution, support, customer.
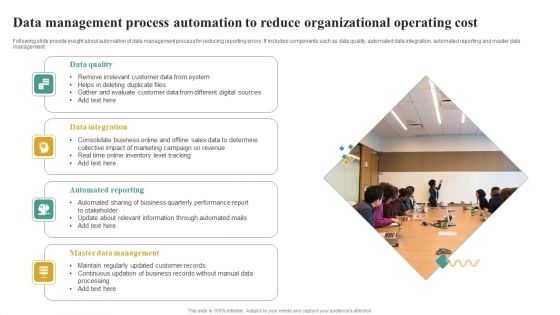
Data Management Process Automation To Reduce Organizational Operating Cost Pictures PDF
Following slide provide insight about automation of data management process for reducing reporting errors. It includes components such as data quality, automated data integration, automated reporting and master data management.Showcasing this set of slides titled Data Management Process Automation To Reduce Organizational Operating Cost Pictures PDF. The topics addressed in these templates are Data Quality, Data Integration, Automated Reporting, Master Data Management. All the content presented in this PPT design is completely editable. Download it and make adjustments in color, background, font etc. as per your unique business setting.
Kpis Deriving Demand Driven Manufacturing Operations Icons PDF
This slide represents the metrics which drive actions for demand driven manufacturing operations. It includes details related to operations, supplier, customer sales and quality. Showcasing this set of slides titled Kpis Deriving Demand Driven Manufacturing Operations Icons PDF. The topics addressed in these templates are Operations, Supplier, Customer Or Sales, Quality. All the content presented in this PPT design is completely editable. Download it and make adjustments in color, background, font etc. as per your unique business setting.
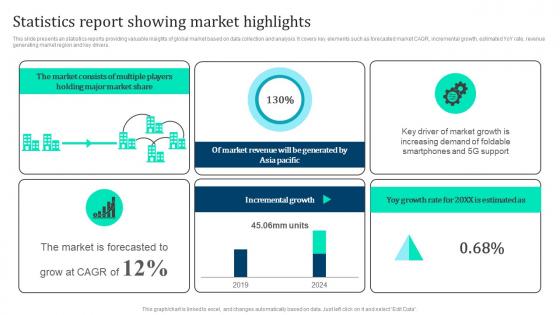
Statistics Report Showing Marketing Intelligence Guide Data Gathering Slides Pdf
This slide presents an statistics reports providing valuable insights of global market based on data collection and analysis. It covers key elements such as forecasted market CAGR, incremental growth, estimated YoY rate, revenue generating market region and key drivers. Get a simple yet stunning designed Statistics Report Showing Marketing Intelligence Guide Data Gathering Slides Pdf. It is the best one to establish the tone in your meetings. It is an excellent way to make your presentations highly effective. So, download this PPT today from Slidegeeks and see the positive impacts. Our easy to edit Statistics Report Showing Marketing Intelligence Guide Data Gathering Slides Pdf can be your go to option for all upcoming conferences and meetings. So, what are you waiting for Grab this template today. This slide presents an statistics reports providing valuable insights of global market based on data collection and analysis. It covers key elements such as forecasted market CAGR, incremental growth, estimated YoY rate, revenue generating market region and key drivers.
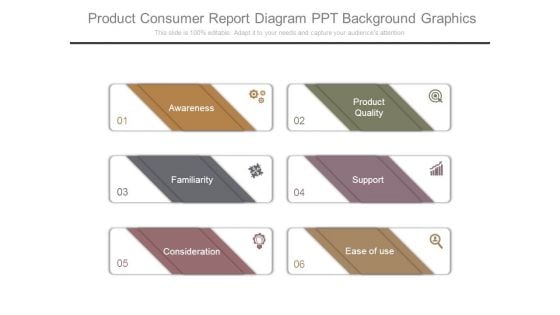
Product Consumer Report Diagram Ppt Background Graphics
This is a product consumer report diagram ppt background graphics. This is a six stage process. The stages in this process are awareness, familiarity, consideration, product quality, support, ease of use.
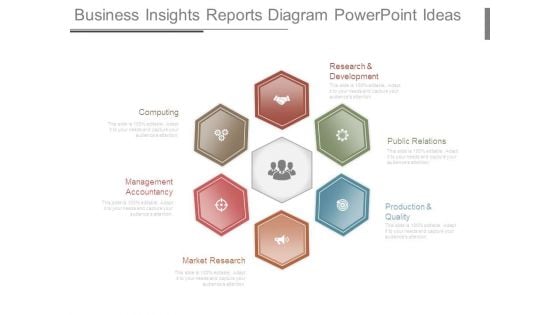
Business Insights Reports Diagram Powerpoint Ideas
This is a business insights reports diagram powerpoint ideas. This is a six stage process. The stages in this process are research and development, public relations, production and quality, market research, management accountancy, computing.
Comparative Analysis Of Traditional And Scrum Kpis Ppt Icon Designs Download PDF
This slide illustrates comparison of traditional and agile scrum measures. It includes parameters like cost, schedule, performance and quality. Showcasing this set of slides titled Comparative Analysis Of Traditional And Scrum Kpis Ppt Icon Designs Download PDF. The topics addressed in these templates are Cost, Performance, Quality. All the content presented in this PPT design is completely editable. Download it and make adjustments in color, background, font etc. as per your unique business setting.
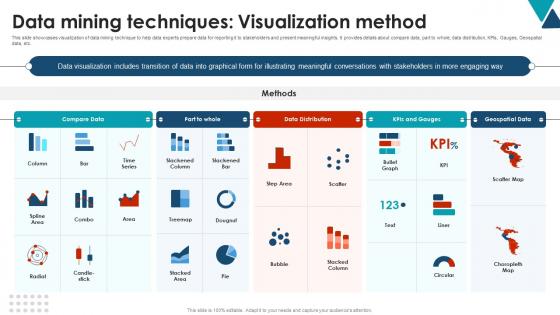
Data Mining Techniques Visualization Method Using Data Mining Tools To Optimize Processes AI SS V
This slide showcases visualization of data mining technique to help data experts prepare data for reporting it to stakeholders and present meaningful insights. It provides details about compare data, part to whole, data distribution, KPIs, Gauges, Geospatial data, etc. Here you can discover an assortment of the finest PowerPoint and Google Slides templates. With these templates, you can create presentations for a variety of purposes while simultaneously providing your audience with an eye-catching visual experience. Download Data Mining Techniques Visualization Method Using Data Mining Tools To Optimize Processes AI SS V to deliver an impeccable presentation. These templates will make your job of preparing presentations much quicker, yet still, maintain a high level of quality. Slidegeeks has experienced researchers who prepare these templates and write high-quality content for you. Later on, you can personalize the content by editing the Data Mining Techniques Visualization Method Using Data Mining Tools To Optimize Processes AI SS V. This slide showcases visualization of data mining technique to help data experts prepare data for reporting it to stakeholders and present meaningful insights. It provides details about compare data, part to whole, data distribution, KPIs, Gauges, Geospatial data, etc.
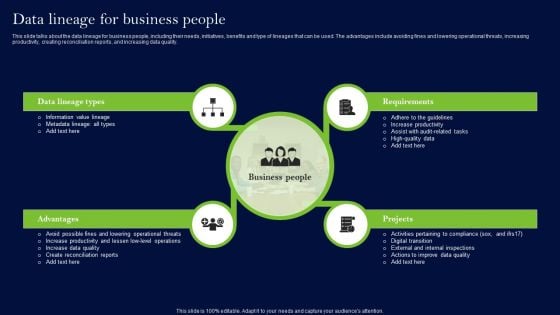
Data Lineage Methods Data Lineage For Business People Designs PDF
This slide talks about the data lineage for business people, including their needs, initiatives, benefits and type of lineages that can be used. The advantages include avoiding fines and lowering operational threats, increasing productivity, creating reconciliation reports, and increasing data quality. Find a pre-designed and impeccable Data Lineage Methods Data Lineage For Business People Designs PDF. The templates can ace your presentation without additional effort. You can download these easy-to-edit presentation templates to make your presentation stand out from others. So, what are you waiting for Download the template from Slidegeeks today and give a unique touch to your presentation.
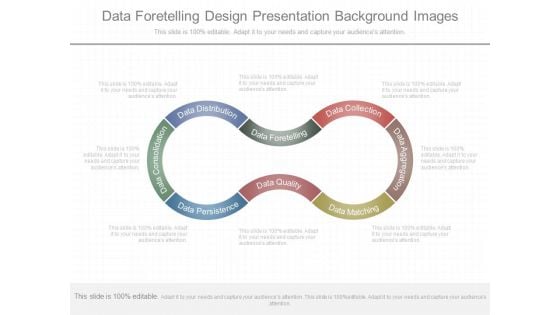
Data Foretelling Design Presentation Background Images
This is a data foretelling design presentation background images. This is a eight stage process. The stages in this process are data consolidation, data persistence, data quality, data matching, data aggregation, data collection, data foretelling, data distribution.


 Continue with Email

 Home
Home


