Quality Dashboard
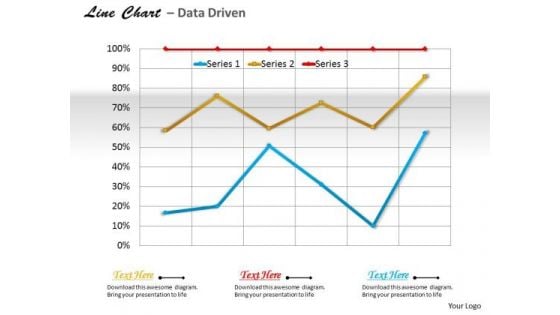
Data Analysis Template Driven Line Chart For Business Trends PowerPoint Slides Templates
Use Our data analysis template driven line chart for business trends powerpoint slides Templates As The Bit. Drill Your Thoughts Into Their Minds.
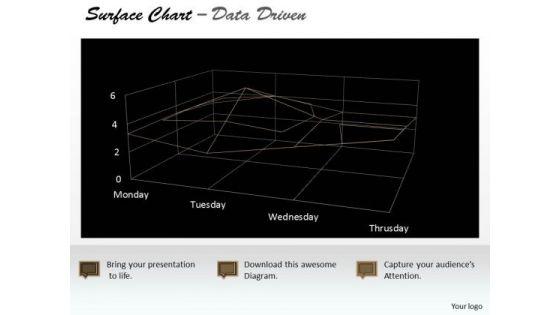
Data Analysis Template Driven Surface Chart Indicating Areas PowerPoint Slides Templates
Highlight Your Drive With Our data analysis template driven surface chart indicating areas powerpoint slides Templates . Prove The Fact That You Have Control.
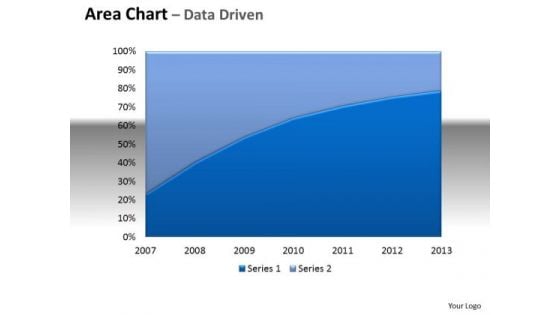
Financial Data Analysis Area Chart With Plotted Line Center PowerPoint Templates
Be The Doer With Our financial data analysis area chart with plotted line center Powerpoint Templates . Put Your Thoughts Into Practice.
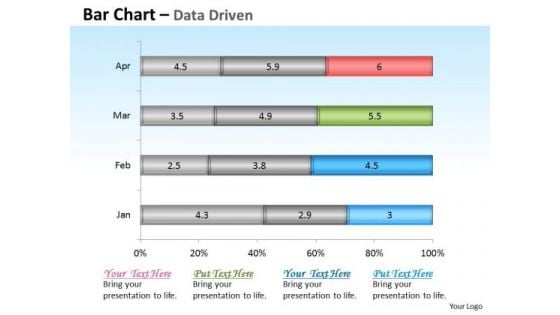
Financial Data Analysis Driven Base Bar Chart Design PowerPoint Slides Templates
Get The Domestics Right With Our financial data analysis driven base bar chart design powerpoint slides Templates . Create The Base For Thoughts To Grow.
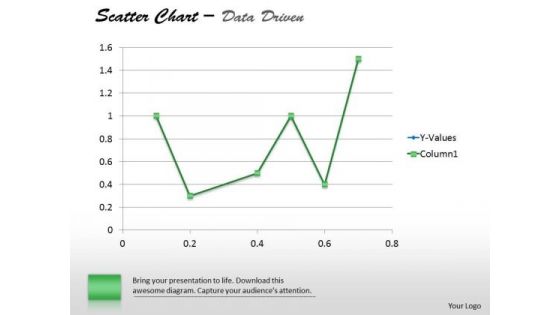
Financial Data Analysis Driven Demonstrate Statistics With Scatter Chart PowerPoint Slides Templates
Establish The Dominance Of Your Ideas. Our financial data analysis driven demonstrate statistics with scatter chart powerpoint slides Templates Will Put Them On Top.
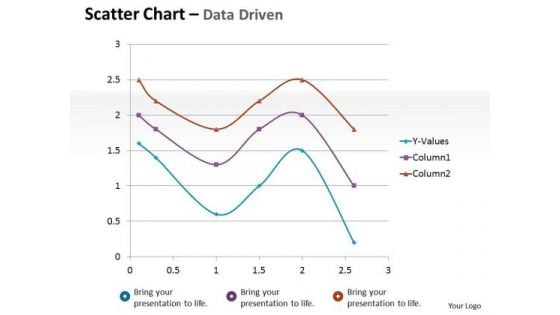
Financial Data Analysis Driven Scatter Chart Mathematical Diagram PowerPoint Slides Templates
Dominate Proceedings With Your Ideas. Our financial data analysis driven scatter chart mathematical diagram powerpoint slides Templates Will Empower Your Thoughts.
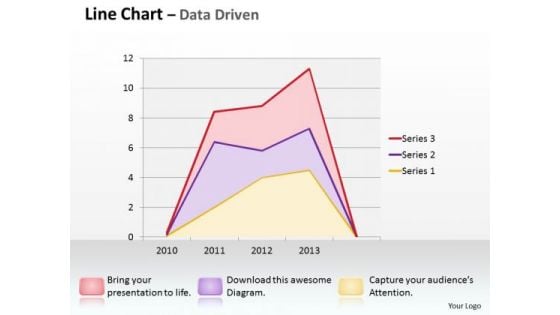
Multivariate Data Analysis Driven Line Chart Shows Revenue Trends PowerPoint Slides Templates
Good Camaraderie Is A Key To Teamwork. Our multivariate data analysis driven line chart shows revenue trends powerpoint slides Templates Can Be A Cementing Force.
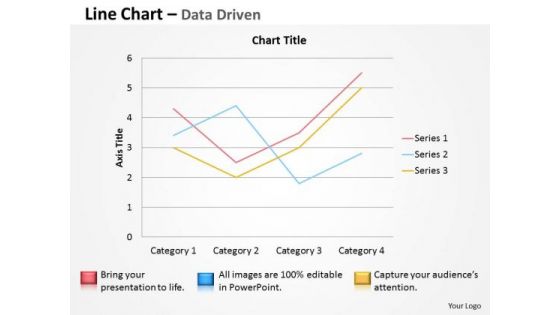
Multivariate Data Analysis Driven Line Chart To Demonstrate PowerPoint Slides Templates
Brace Yourself, Arm Your Thoughts. Prepare For The Hustle With Our multivariate data analysis driven line chart to demonstrate powerpoint slides Templates .
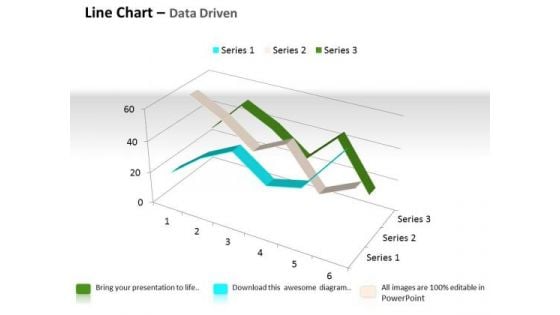
Quantitative Data Analysis 3d Line Chart For Comparison Of PowerPoint Templates
Touch Base With Our quantitative data analysis 3d line chart for comparison of Powerpoint Templates . Review Your Growth With Your Audience.

Quantitative Data Analysis 3d Pie Chart For Business Process PowerPoint Templates
Put Them On The Same Page With Our quantitative data analysis 3d pie chart for business process Powerpoint Templates . Your Team Will Sing From The Same Sheet.
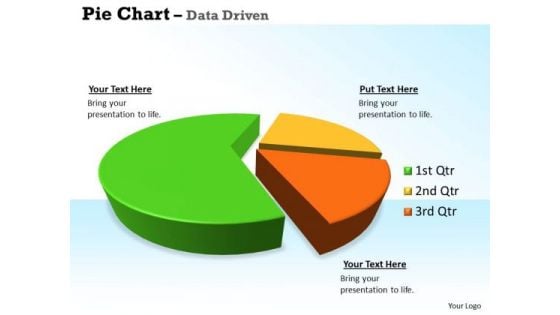
Quantitative Data Analysis 3d Pie Chart For Business Statistics PowerPoint Templates
Our quantitative data analysis 3d pie chart for business statistics Powerpoint Templates Allow You To Do It With Ease. Just Like Picking The Low Hanging Fruit.
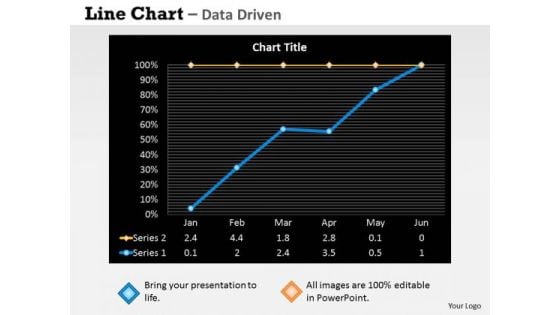
Quantitative Data Analysis Driven Economic Status Line Chart PowerPoint Slides Templates
Be The Dramatist With Our quantitative data analysis driven economic status line chart powerpoint slides Templates . Script Out The Play Of Words.
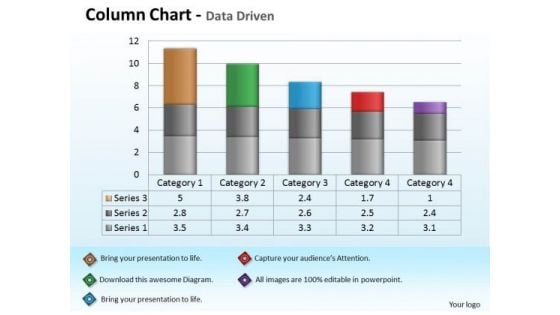
Quantitative Data Analysis Driven Economic With Column Chart PowerPoint Slides Templates
Add Some Dramatization To Your Thoughts. Our quantitative data analysis driven economic with column chart powerpoint slides Templates Make Useful Props.
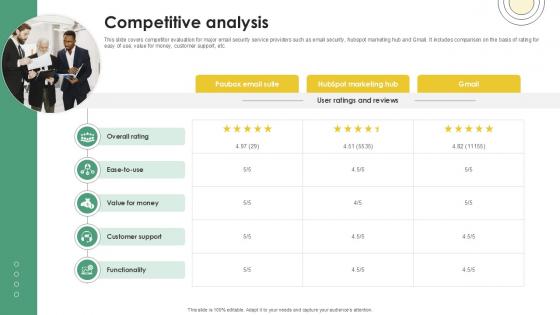
Competitive Analysis Email And Data Protection Platform Capital Funding Pitch Deck PPT Example
This slide covers competitor evaluation for major email security service providers such as email security, hubspot marketing hub and Gmail. It includes comparison on the basis of rating for easy of use, value for money, customer support, etc. Do you have to make sure that everyone on your team knows about any specific topic I yes, then you should give Competitive Analysis Email And Data Protection Platform Capital Funding Pitch Deck PPT Example a try. Our experts have put a lot of knowledge and effort into creating this impeccable Competitive Analysis Email And Data Protection Platform Capital Funding Pitch Deck PPT Example. You can use this template for your upcoming presentations, as the slides are perfect to represent even the tiniest detail. You can download these templates from the Slidegeeks website and these are easy to edit. So grab these today This slide covers competitor evaluation for major email security service providers such as email security, hubspot marketing hub and Gmail. It includes comparison on the basis of rating for easy of use, value for money, customer support, etc.
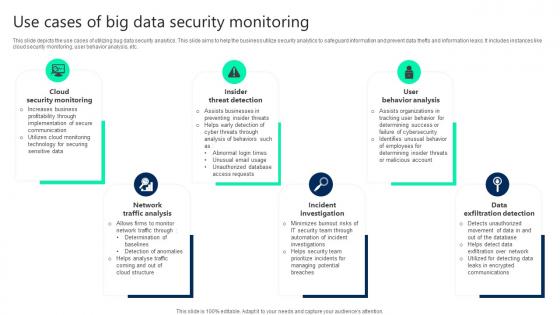
Use Cases Of Big Data Security Monitoring Clipart pdf
This slide depicts the use cases of utilizing bug data security analytics. This slide aims to help the business utilize security analytics to safeguard information and prevent data thefts and information leaks. It includes instances like cloud security monitoring, user behavior analysis, etc. Pitch your topic with ease and precision using this Use Cases Of Big Data Security Monitoring Clipart pdf. This layout presents information on Cloud Security Monitoring, Insider Threat Detection, User Behavior Analysis. It is also available for immediate download and adjustment. So, changes can be made in the color, design, graphics or any other component to create a unique layout. This slide depicts the use cases of utilizing bug data security analytics. This slide aims to help the business utilize security analytics to safeguard information and prevent data thefts and information leaks. It includes instances like cloud security monitoring, user behavior analysis, etc.
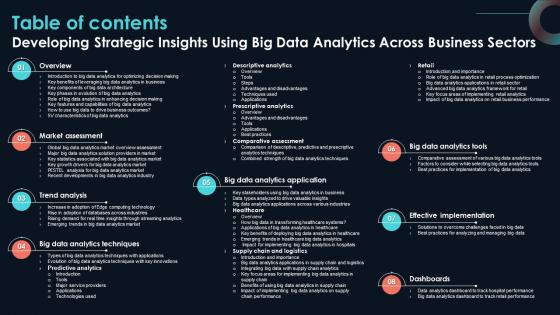
Table Of Contents Developing Strategic Insights Using Big Data Analytics Across Business Sectors
Retrieve professionally designed Table Of Contents Developing Strategic Insights Using Big Data Analytics Across Business Sectors to effectively convey your message and captivate your listeners. Save time by selecting pre-made slideshows that are appropriate for various topics, from business to educational purposes. These themes come in many different styles, from creative to corporate, and all of them are easily adjustable and can be edited quickly. Access them as PowerPoint templates or as Google Slides themes. You do not have to go on a hunt for the perfect presentation because Slidegeeks got you covered from everywhere. Our Table Of Contents Developing Strategic Insights Using Big Data Analytics Across Business Sectors are topically designed to provide an attractive backdrop to any subject. Use them to look like a presentation pro.
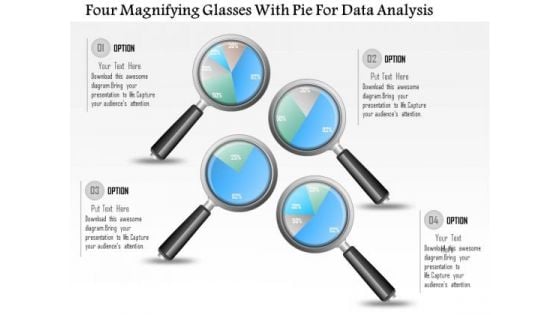
Business Diagram Four Magnifying Glasses With Pie For Data Analysis PowerPoint Slide
This business diagram displays graphic of pie charts in shape of magnifying glasses This business slide is suitable to present and compare business data. Use this diagram to build professional presentations for your viewers.

Business Diagram Four Pie Chart For Data Driven Result Analysis Of Business PowerPoint Slide
This business diagram displays graphic of pie charts in shape of flasks. This business slide is suitable to present and compare business data. Use this diagram to build professional presentations for your viewers.
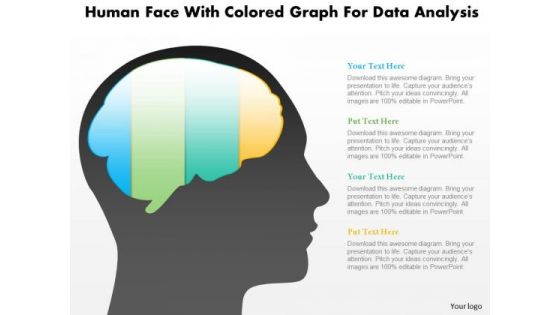
Business Diagram Human Face With Colored Graph For Data Analysis PowerPoint Slide
This diagram displays human face graphic with colored graph. This diagram can be used to represent strategy, planning, thinking of business plan. Display business options in your presentations by using this creative diagram.

Data Stewardship In Business Processes Risks Process Oriented Data Stewardship Introduction Pdf
This slide talks about the risks associated with the process oriented data stewardship model, including the complexity of data ownership assignment, and company constituents can get confused due to so many definitions for exact information and getting feedback from a single end user. Are you in need of a template that can accommodate all of your creative concepts This one is crafted professionally and can be altered to fit any style. Use it with Google Slides or PowerPoint. Include striking photographs, symbols, depictions, and other visuals. Fill, move around, or remove text boxes as desired. Test out color palettes and font mixtures. Edit and save your work, or work with colleagues. Download Data Stewardship In Business Processes Risks Process Oriented Data Stewardship Introduction Pdf and observe how to make your presentation outstanding. Give an impeccable presentation to your group and make your presentation unforgettable. This slide talks about the risks associated with the process oriented data stewardship model, including the complexity of data ownership assignment, and company constituents can get confused due to so many definitions for exact information and getting feedback from a single end user.
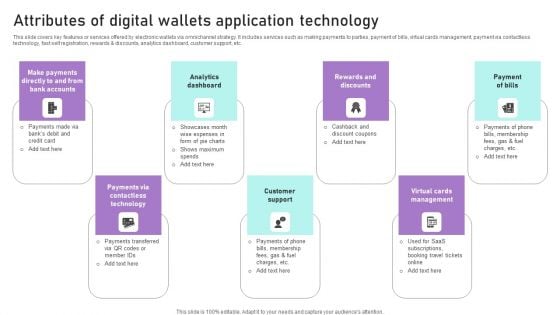
Attributes Of Digital Wallets Application Technology Ppt Ideas Layout Ideas PDF
This slide covers key features or services offered by electronic wallets via omnichannel strategy. It includes services such as making payments to parties, payment of bills, virtual cards management, payment via contactless technology, fast self registration, rewards and discounts, analytics dashboard, customer support, etc. Are you in need of a template that can accommodate all of your creative concepts This one is crafted professionally and can be altered to fit any style. Use it with Google Slides or PowerPoint. Include striking photographs, symbols, depictions, and other visuals. Fill, move around, or remove text boxes as desired. Test out color palettes and font mixtures. Edit and save your work, or work with colleagues. Download Attributes Of Digital Wallets Application Technology Ppt Ideas Layout Ideas PDF and observe how to make your presentation outstanding. Give an impeccable presentation to your group and make your presentation unforgettable.
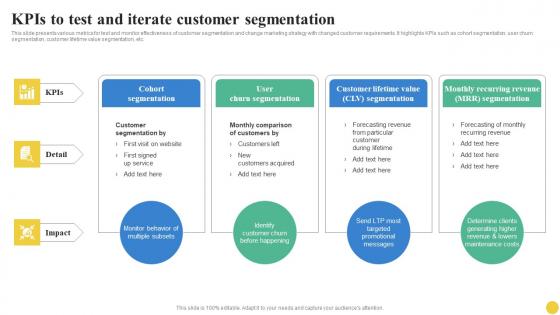
Kpis To Test And Iterate Customer Segmentation User Segmentation Pictures Pdf
This slide presents various metrics for test and monitor effectiveness of customer segmentation and change marketing strategy with changed customer requirements. It highlights KPIs such as cohort segmentation, user churn segmentation, customer lifetime value segmentation, etc. Find a pre-designed and impeccable Kpis To Test And Iterate Customer Segmentation User Segmentation Pictures Pdf. The templates can ace your presentation without additional effort. You can download these easy-to-edit presentation templates to make your presentation stand out from others. So, what are you waiting for Download the template from Slidegeeks today and give a unique touch to your presentation. This slide presents various metrics for test and monitor effectiveness of customer segmentation and change marketing strategy with changed customer requirements. It highlights KPIs such as cohort segmentation, user churn segmentation, customer lifetime value segmentation, etc.
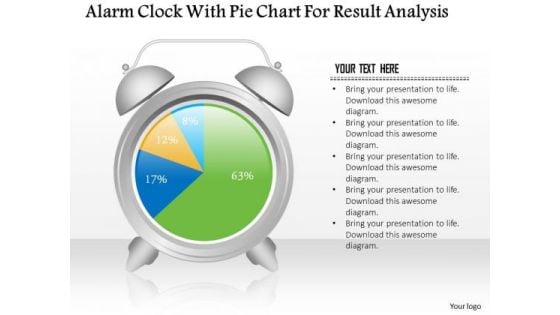
Business Diagram Alarm Clock With Pie Chart For Result Analysis PowerPoint Slide
This business slide displays alarm clock with pie chart. This diagram is a data visualization tool that gives you a simple way to present statistical information. This slide helps your audience examine and interpret the data you present.
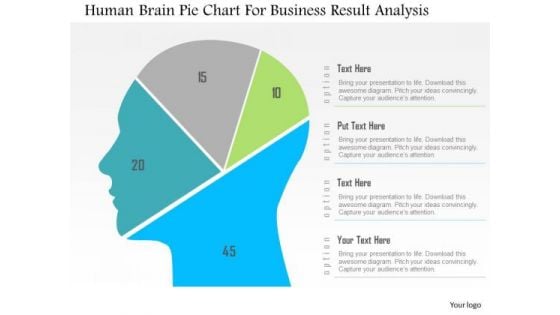
Business Diagram Human Brain Pie Chart For Business Result Analysis PowerPoint Slide
This diagram displays human face graphic divided into sections. This section can be used for data display. Use this diagram to build professional presentations for your viewers.

Kpis To Evaluate Performance Of Commercial Banks Complete Guide On Managing Banking Fin SS V
This slide shows information regarding various key performance indicators or metrics which can be used to measure or analyse the performance of commercial banks. It includes ROA, ROE, NIM, NPL, etc. Take your projects to the next level with our ultimate collection of Kpis To Evaluate Performance Of Commercial Banks Complete Guide On Managing Banking Fin SS V. Slidegeeks has designed a range of layouts that are perfect for representing task or activity duration, keeping track of all your deadlines at a glance. Tailor these designs to your exact needs and give them a truly corporate look with your own brand colors they will make your projects stand out from the rest This slide shows information regarding various key performance indicators or metrics which can be used to measure or analyse the performance of commercial banks. It includes ROA, ROE, NIM, NPL, etc.
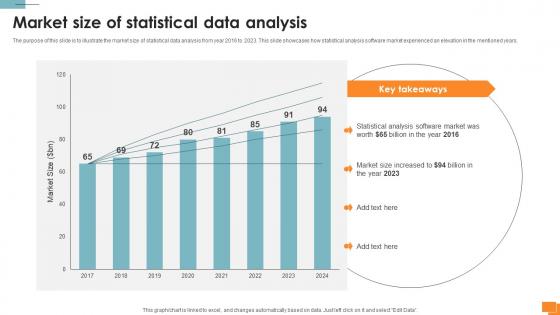
Statistical Tools For Evidence Market Size Of Statistical Data Analysis
The purpose of this slide is to illustrate the market size of statistical data analysis from year 2016 to 2023. This slide showcases how statistical analysis software market experienced an elevation in the mentioned years. Retrieve professionally designed Statistical Tools For Evidence Market Size Of Statistical Data Analysis to effectively convey your message and captivate your listeners. Save time by selecting pre-made slideshows that are appropriate for various topics, from business to educational purposes. These themes come in many different styles, from creative to corporate, and all of them are easily adjustable and can be edited quickly. Access them as PowerPoint templates or as Google Slides themes. You do not have to go on a hunt for the perfect presentation because Slidegeeks got you covered from everywhere. The purpose of this slide is to illustrate the market size of statistical data analysis from year 2016 to 2023. This slide showcases how statistical analysis software market experienced an elevation in the mentioned years.
Predictive Analytics In The Age Of Big Data Predictive Analytics Model Performance Tracking Introduction PDF
This slide represents the predictive analytics model performance tracking dashboard, and it covers the details of total visitors, total buyers, total products added to the cart, filters by date and category, visitors to clients conversion rate, and so on. Slidegeeks has constructed Predictive Analytics In The Age Of Big Data Predictive Analytics Model Performance Tracking Introduction PDF after conducting extensive research and examination. These presentation templates are constantly being generated and modified based on user preferences and critiques from editors. Here, you will find the most attractive templates for a range of purposes while taking into account ratings and remarks from users regarding the content. This is an excellent jumping off point to explore our content and will give new users an insight into our top notch PowerPoint Templates.
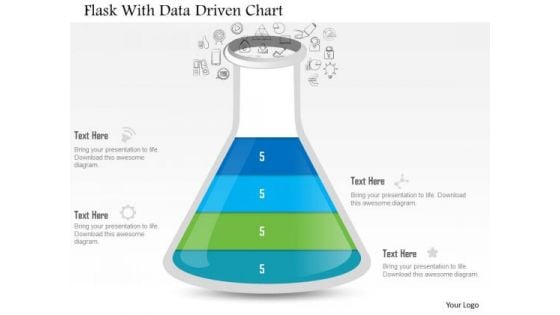
Business Diagram Flask With Data Driven Chart PowerPoint Slide
This data driven diagram has been designed with flask graphics. Download this diagram to give your presentations more effective look. It helps in clearly conveying your message to clients and audience.
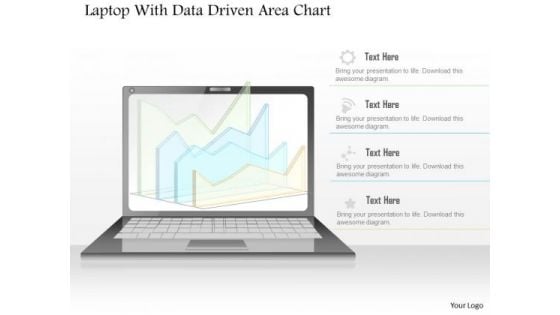
Business Diagram Laptop With Data Driven Area Chart PowerPoint Slide
This diagram has been designed with laptop and data driven area chart. Download this diagram to give your presentations more effective look. It helps in clearly conveying your message to clients and audience.
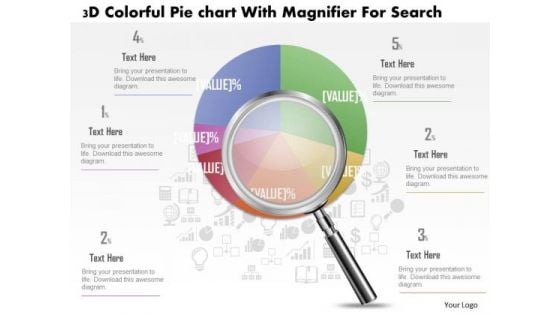
Business Diagram 3d Colorful Pie Graph With Magnifier Data Search PowerPoint Slide
This business slide displays 3d colorful pie graph with magnifier. This diagram is a data visualization tool that gives you a simple way to present statistical information. This slide helps your audience examine and interpret the data you present.

Business Diagram Data Driven Pie Chart Inside The Magnifier PowerPoint Slide
This business slide displays 3d colorful pie graph with magnifier. This diagram is a data visualization tool that gives you a simple way to present statistical information. This slide helps your audience examine and interpret the data you present.
Business Diagram 3d Capsule With Multiple Icons For Business Data Flow PowerPoint Slide
This diagram has been designed with 3d graphic of capsule with multiple icons. This data driven PowerPoint slide can be used to give your presentations more effective look. It helps in clearly conveying your message to clients and audience.
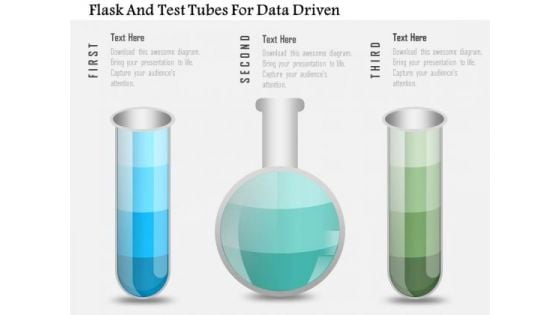
Business Diagram Flask And Test Tubes For Data Driven PowerPoint Slide
This data driven diagram has been designed with flask and test tubes. Download this diagram to give your presentations more effective look. It helps in clearly conveying your message to clients and audience.

Business Diagram Three Heads With Pie For Data Driven Technology PowerPoint Slide
This business diagram displays three human faces with pie charts. This Power Point template has been designed to compare and present business data. You may use this diagram to impart professional appearance to your presentations.
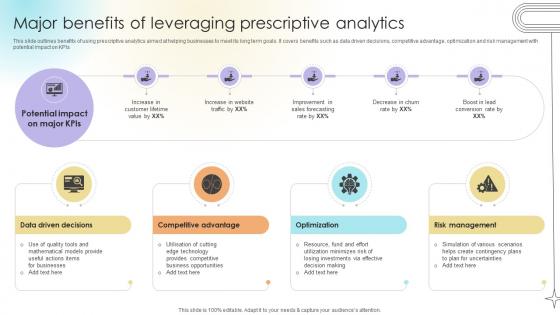
Major Benefits Of Leveraging Prescriptive Analytics Data Analytics SS V
This slide outlines benefits of using prescriptive analytics aimed at helping businesses to meet its long term goals. It covers benefits such as data driven decisions, competitive advantage, optimization and risk management with potential impact on KPIs.Are you in need of a template that can accommodate all of your creative concepts This one is crafted professionally and can be altered to fit any style. Use it with Google Slides or PowerPoint. Include striking photographs, symbols, depictions, and other visuals. Fill, move around, or remove text boxes as desired. Test out color palettes and font mixtures. Edit and save your work, or work with colleagues. Download Major Benefits Of Leveraging Prescriptive Analytics Data Analytics SS V and observe how to make your presentation outstanding. Give an impeccable presentation to your group and make your presentation unforgettable. This slide outlines benefits of using prescriptive analytics aimed at helping businesses to meet its long term goals. It covers benefits such as data driven decisions, competitive advantage, optimization and risk management with potential impact on KPIs.
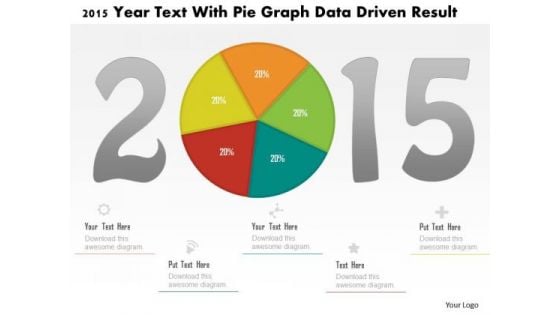
Business Diagram 2015 Year Text With Pie Graph Data Driven Result PowerPoint Slide
This business diagram displays 2015 year numbers with pie chart. This diagram is suitable to display business strategy for year 2015. Download this professional slide to present information in an attractive manner
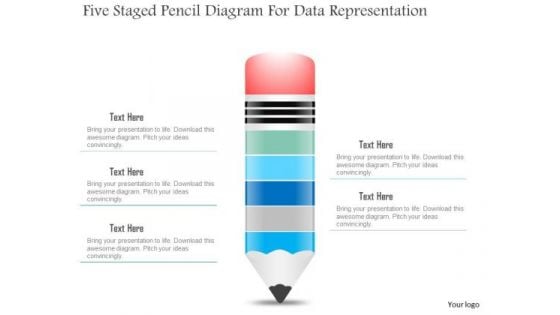
Business Diagram Five Staged Pencil Diagram For Data Representation PowerPoint Slide
This business slide displays five staged pencil diagram. It contains pencil graphic divided into five parts. This diagram slide depicts processes, stages, steps, points, options and education information display. Use this diagram, in your presentations to express your views innovatively.
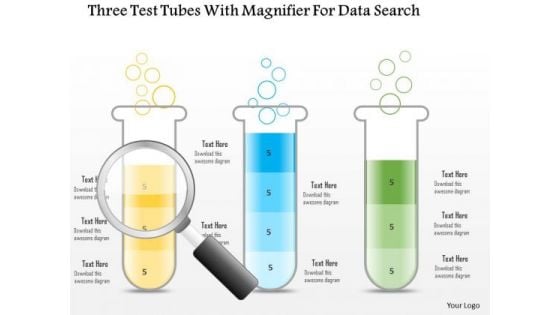
Business Diagram Three Test Tubes With Magnifier For Data Search PowerPoint Slide
This business diagram displays three test tubes with magnifying glass. This diagram is suitable to depict flow of business activities or steps. Download this professional slide to present information in an attractive manner.
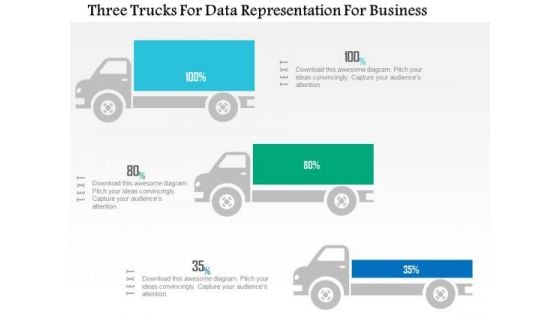
Business Diagram Three Trucks For Data Representation For Business PowerPoint Slide
This business diagram displays three trucks graphic. This diagram contains trucks for percentage value growth. Use this diagram to display business growth over a period of time.

Business Diagram Extract Transform Load Etl Business Intelligence Bug Data Analysis Pipeline Ppt Sli
This PowerPoint template has been designed with graphic of server. This diagram depicts the concept of ETL business intelligence with extract transform load. This slide also helps to display the data analysis pipeline.
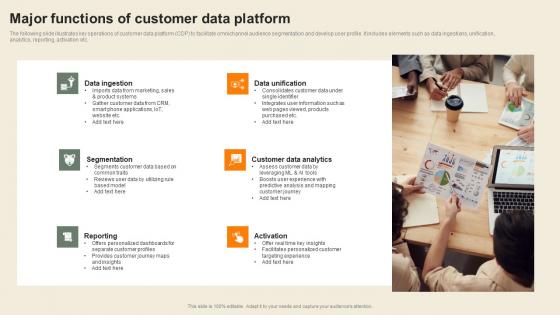
Major Functions Of Customer Data Platform Usability Of CDP Software Tool Mockup Pdf
The following slide illustrates key operations of customer data platform CDP to facilitate omnichannel audience segmentation and develop user profile. It includes elements such as data ingestions, unification, analytics, reporting, activation etc. Retrieve professionally designed Major Functions Of Customer Data Platform Usability Of CDP Software Tool Mockup Pdf to effectively convey your message and captivate your listeners. Save time by selecting pre-made slideshows that are appropriate for various topics, from business to educational purposes. These themes come in many different styles, from creative to corporate, and all of them are easily adjustable and can be edited quickly. Access them as PowerPoint templates or as Google Slides themes. You do not have to go on a hunt for the perfect presentation because Slidegeeks got you covered from everywhere. The following slide illustrates key operations of customer data platform CDP to facilitate omnichannel audience segmentation and develop user profile. It includes elements such as data ingestions, unification, analytics, reporting, activation etc.
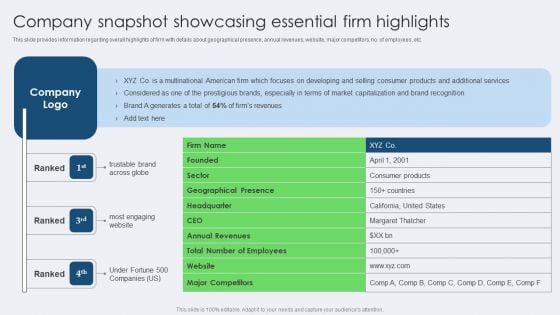
Company Snapshot Showcasing Essential Firm Highlights Infographics PDF
This slide provides information regarding overall highlights of firm with details about geographical presence, annual revenues, website, major competitors, no. of employees, etc. From laying roadmaps to briefing everything in detail, our templates are perfect for you. You can set the stage with your presentation slides. All you have to do is download these easy to edit and customizable templates. Company Snapshot Showcasing Essential Firm Highlights Infographics PDF will help you deliver an outstanding performance that everyone would remember and praise you for. Do download this presentation today.
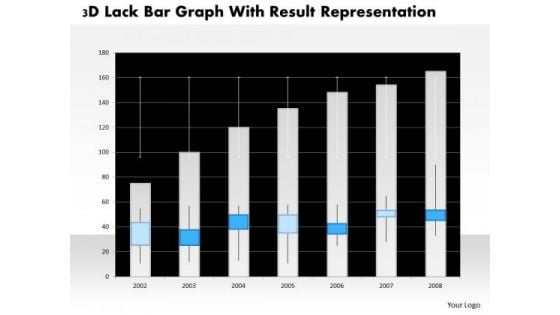
Business Diagram 3d Lack Bar Graph With Result Representation PowerPoint Slide
This business diagram has graphic of 3d lack bar graph. This diagram is a data visualization tool that gives you a simple way to present statistical information. This slide helps your audience examine and interpret the data you present.
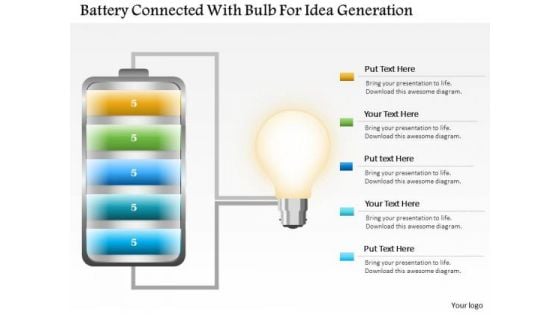
Business Diagram Battery Connected With Bulb For Idea Generation PowerPoint Slide
This business slide displays battery icon connected with bulb. This diagram is a data visualization tool that gives you a simple way to present statistical information. This slide helps your audience examine and interpret the data you present.
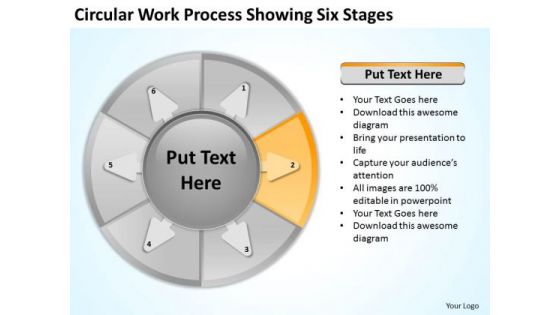
Circular Work Process Showing Six Stages Marketing Plan For Small Business PowerPoint Slides
We present our circular work process showing six stages marketing plan for small business PowerPoint Slides.Download our Marketing PowerPoint Templates because It will Raise the bar of your Thoughts. They are programmed to take you to the next level. Download our Computer PowerPoint Templates because Our PowerPoint Templates and Slides has conjured up a web of all you need with the help of our great team. Use them to string together your glistening ideas. Present our Arrows PowerPoint Templates because Our PowerPoint Templates and Slides will let your team Walk through your plans. See their energy levels rise as you show them the way. Download our Circle Charts PowerPoint Templates because Our PowerPoint Templates and Slides will provide weight to your words. They will bring out the depth of your thought process. Download and present our Business PowerPoint Templates because Timeline crunches are a fact of life. Meet all deadlines using our PowerPoint Templates and Slides.Use these PowerPoint slides for presentations relating to Process, integration, testing, strategic, model, business, implementation, flow, business, plan, engineering, arrow, rotation, recycling, infrastructure, recycle, data, schedule, analysis, rotate, marketing, development, gear, team, management, computing, strategy, project, iterative, assurance, maturity, design, maintenance, quality, control, improvement, database, software, analise. The prominent colors used in the PowerPoint template are Yellow, Gray, White. Cross continents with our Circular Work Process Showing Six Stages Marketing Plan For Small Business PowerPoint Slides. Your thoughts will cover the earth.
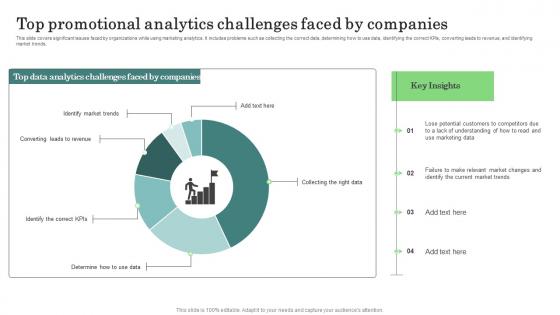
Major Promotional Analytics Future Trends Top Promotional Analytics Ideas Pdf
This slide covers significant issues faced by organizations while using marketing analytics. It includes problems such as collecting the correct data, determining how to use data, identifying the correct KPIs, converting leads to revenue, and identifying market trends. qSlidegeeks has constructed Major Promotional Analytics Future Trends Top Promotional Analytics Ideas Pdf after conducting extensive research and examination. These presentation templates are constantly being generated and modified based on user preferences and critiques from editors. Here, you will find the most attractive templates for a range of purposes while taking into account ratings and remarks from users regarding the content. This is an excellent jumping off point to explore our content and will give new users an insight into our top notch PowerPoint Templates. This slide covers significant issues faced by organizations while using marketing analytics. It includes problems such as collecting the correct data, determining how to use data, identifying the correct KPIs, converting leads to revenue, and identifying market trends.
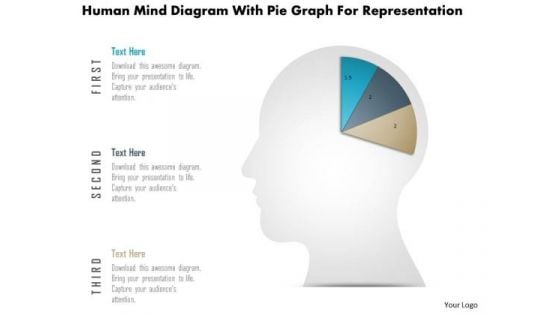
Business Diagram Human Mind Diagram With Pie Graph For Representation PowerPoint Slide
This diagram displays human face graphic divided into sections. This section can be used for data display. Use this diagram to build professional presentations for your viewers.

Business Diagram Six Staged Pie Charts For Text Representation PowerPoint Slide
This slide displays graphic six staged pie charts. Download this diagram to present and compare business data. Use this diagram to display business process workflows in any presentation.
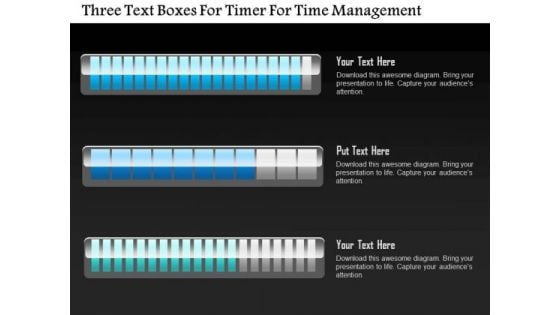
Business Diagram Three Text Boxes For Timer For Time Management PowerPoint Slide
This business diagram displays three text boxes. This diagram contains text boxes for data representation. Use this diagram to display business process workflows in any presentations.
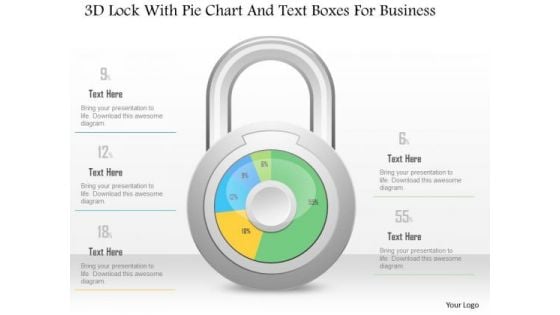
Business Diagram 3d Lock With Pie Chart And Text Boxes For Business PowerPoint Slide
This Power Point diagram has been crafted with pie chart in shape of lock. It contains diagram of lock pie chart to compare and present data in an effective manner. Use this diagram to build professional presentations for your viewers.
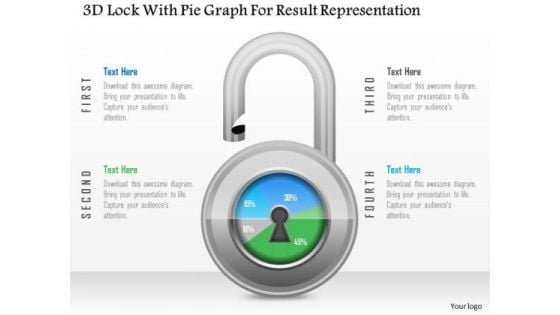
Business Diagram 3d Lock With Pie Graph For Result Representation PowerPoint Slide
This Power Point diagram has been crafted with pie chart in shape of lock. It contains diagram of lock pie chart to compare and present data in an effective manner. Use this diagram to build professional presentations for your viewers.
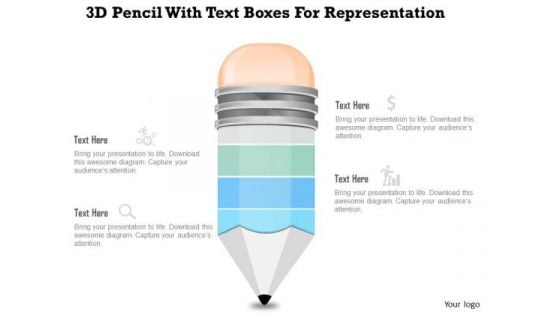
Business Diagram 3d Pencil With Text Boxes For Representation PowerPoint Slide
This Power Point diagram displays graphic of pencil with icons and text spaces. It contains diagram of colorful pencil for data display. Use this diagram to build professional presentations for your viewers.
Business Diagram Human Icons With Bubbles And Different Icons Inside PowerPoint Slide
This diagram displays graph with percentage value growth. This business slide is suitable to present and compare business data. Use this diagram to build professional presentations for your viewers.

Business Diagram Three Staged Pencil Diagram For Graph Formation PowerPoint Slide
This business diagram displays set of pencils. This Power Point template has been designed to compare and present business data. Download this diagram to represent stages of business growth.
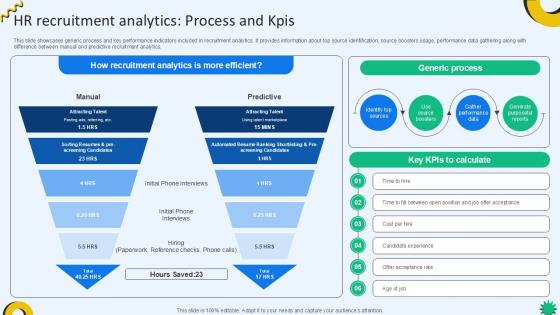
HR Recruitment Analytics Process And KPIs Cloud Recruiting Technologies PPT Sample
This slide showcases generic process and key performance indicators included in recruitment analytics. It provides information about top source identification, source boosters usage, performance data gathering along with difference between manual and predictive recruitment analytics. If you are looking for a format to display your unique thoughts, then the professionally designed HR Recruitment Analytics Process And KPIs Cloud Recruiting Technologies PPT Sample is the one for you. You can use it as a Google Slides template or a PowerPoint template. Incorporate impressive visuals, symbols, images, and other charts. Modify or reorganize the text boxes as you desire. Experiment with shade schemes and font pairings. Alter, share or cooperate with other people on your work. Download HR Recruitment Analytics Process And KPIs Cloud Recruiting Technologies PPT Sample and find out how to give a successful presentation. Present a perfect display to your team and make your presentation unforgettable. This slide showcases generic process and key performance indicators included in recruitment analytics. It provides information about top source identification, source boosters usage, performance data gathering along with difference between manual and predictive recruitment analytics.

HR Recruitment Analytics Process And KPIs Enhancing Recruitment Process PPT PowerPoint
This slide showcases generic process and key performance indicators included in recruitment analytics. It provides information about top source identification, source boosters usage, performance data gathering along with difference between manual and predictive recruitment analytics. If you are looking for a format to display your unique thoughts, then the professionally designed HR Recruitment Analytics Process And KPIs Enhancing Recruitment Process PPT PowerPoint is the one for you. You can use it as a Google Slides template or a PowerPoint template. Incorporate impressive visuals, symbols, images, and other charts. Modify or reorganize the text boxes as you desire. Experiment with shade schemes and font pairings. Alter, share or cooperate with other people on your work. Download HR Recruitment Analytics Process And KPIs Enhancing Recruitment Process PPT PowerPoint and find out how to give a successful presentation. Present a perfect display to your team and make your presentation unforgettable. This slide showcases generic process and key performance indicators included in recruitment analytics. It provides information about top source identification, source boosters usage, performance data gathering along with difference between manual and predictive recruitment analytics.

Customer 360 Overview Training Required For Marketing Strategies Ppt Pictures Background Images PDF
Presenting this set of slides with name customer 360 overview training required for marketing strategies ppt pictures background images pdf. This is a six stage process. The stages in this process are product knowledge, ms excel training, reporting format, xyz software usage. This is a completely editable PowerPoint presentation and is available for immediate download. Download now and impress your audience.
Business Diagram Battery Icon With Power Icons Energy Technology PowerPoint Slide
This business diagram displays battery icon with power charging. Use this diagram, in your presentations to display energy saving, battery and technology. Create professional presentations using this diagram slide.
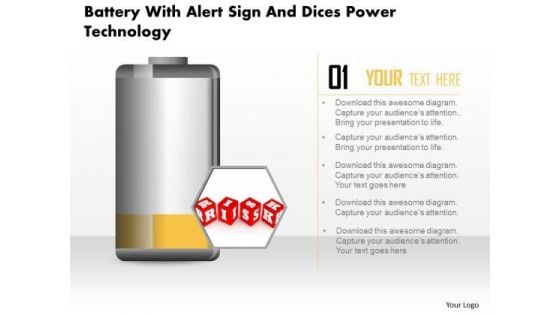
Business Diagram Battery With Alert Sign And Dices Power Technology PowerPoint Slide
This business diagram displays risk alert on battery icon. Use this diagram, in your presentations to display energy saving, battery and technology. Create professional presentations using this diagram slide.


 Continue with Email

 Home
Home


