Quality Icon

Crystal Clear Internet Technology PowerPoint Themes And PowerPoint Slides 0611
Microsoft PowerPoint Theme and Slide with internet and e-commerce Slide Expose your audience to high quality. Our Crystal Clear Internet Technology PowerPoint Themes And PowerPoint Slides 0611 are a befitting example.
Happy Worker Under Construction PowerPoint Themes And PowerPoint Slides 0511
Microsoft PowerPoint Slide and Theme with a construction concept and presentation Achieve high-quality presentations with our Happy Worker Under Construction PowerPoint Themes And PowerPoint Slides 0511. They will make you look good.

Peoples In Labyrinth Metaphor PowerPoint Themes And PowerPoint Slides 0811
Microsoft PowerPoint Theme and slide with silhouettes of people in the maze Your slides will be unsurpassed in quality. Create them with our Peoples In Labyrinth Metaphor PowerPoint Themes And PowerPoint Slides 0811. You'll always stay ahead of the game.

Jump Vacation PowerPoint Themes And PowerPoint Slides 0811
Microsoft PowerPoint Theme and Slide with a man jumping a top a mountain Expose your audience to high quality. Our Jump Vacation PowerPoint Themes And PowerPoint Slides 0811 are a befitting example.
Drunk Buzzed Business PowerPoint Themes And PowerPoint Slides 0811
Microsoft PowerPoint Theme and Slide with a speedometer measuring how drunk the driver is Achieve high-quality presentations with our Drunk Buzzed Business PowerPoint Themes And PowerPoint Slides 0811. They will make you look good.

Happy Children PowerPoint Themes And PowerPoint Slides 0711
Microsoft PowerPoint Theme and Slide with two boys silhouetted against the sky Our Happy Children PowerPoint Themes And PowerPoint Slides 0711 have a high degree of quality. Every element gets close attention.

Jesus Cross Christian PowerPoint Templates And PowerPoint Themes 0712
Jesus Cross Christian PowerPoint Templates And PowerPoint Themes 0712-Microsoft Powerpoint Templates and Background with jesus cross Expose your audience to high quality. Our Jesus Cross Christian PowerPoint Templates And PowerPoint Themes 0712 are a befitting example.

Knowledge Blocks Future PowerPoint Templates And PowerPoint Themes 0912
Knowledge Blocks Future PowerPoint Templates And PowerPoint Themes 0912-Microsoft Powerpoint Templates and Background with knowledge blocks Expose your audience to high quality. Our Knowledge Blocks Future PowerPoint Templates And PowerPoint Themes 0912 are a befitting example.
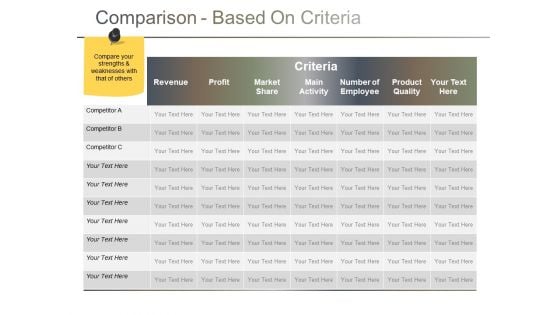
Comparison Based On Criteria Ppt PowerPoint Presentation Gallery Themes
This is a comparison based on criteria ppt powerpoint presentation gallery themes. This is a seven stage process. The stages in this process are revenue, profit, market share, main activity, product quality.
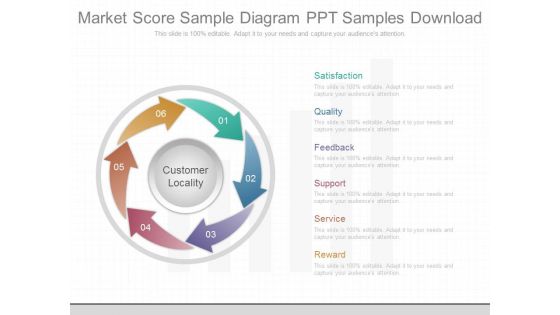
Market Score Sample Diagram Ppt Samples Download
This is a market score sample diagram ppt samples download. This is a six stage process. The stages in this process are customer locality, satisfaction, quality, feedback, support, service, reward.
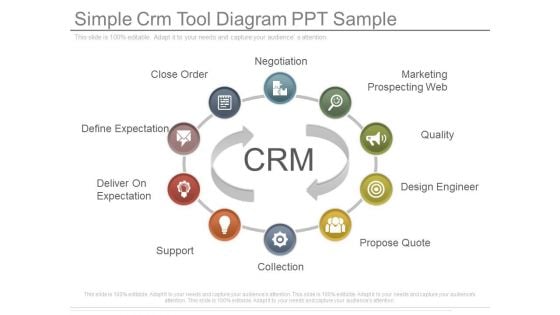
Simple Crm Tool Diagram Ppt Sample
This is a simple crm tool diagram ppt sample. This is a ten stage process. The stages in this process are close order, define expectation, deliver on expectation, support, collection, propose quote, design engineer, quality, marketing prospecting web, negotiation.
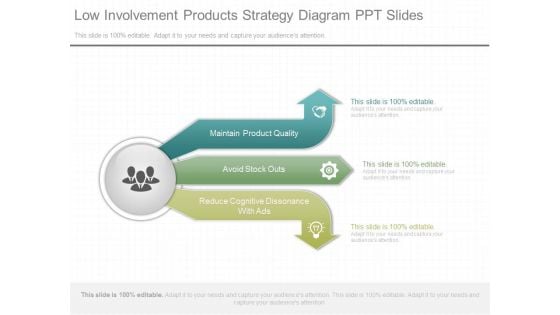
Low Involvement Products Strategy Diagram Ppt Slides
This is a low involvement products strategy diagram ppt slides. This is a three stage process. The stages in this process are maintain product quality, avoid stock outs, reduce cognitive dissonance with ads.
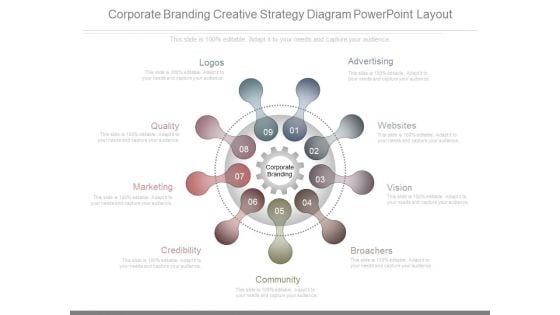
Corporate Branding Creative Strategy Diagram Powerpoint Layout
This is a corporate branding creative strategy diagram powerpoint layout. This is a nine stage process. The stages in this process are advertising, websites, vision, broachers, community, credibility, marketing, quality, logos.
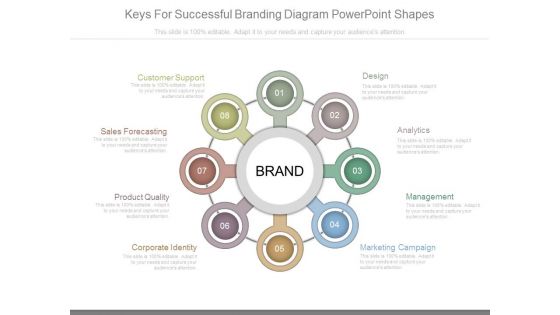
Keys For Successful Branding Diagram Powerpoint Shapes
This is a keys for successful branding diagram powerpoint shapes. This is a eight stage process. The stages in this process are customer support, sales forecasting, product quality, corporate identity, marketing campaign, management, analytics, design, brand.
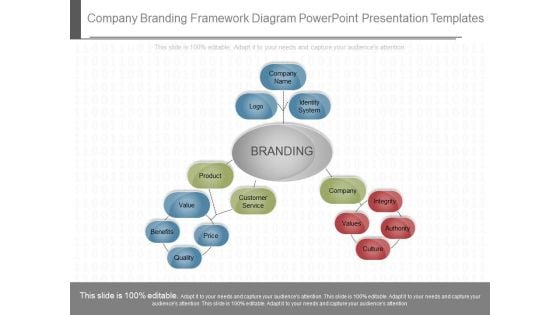
Company Branding Framework Diagram Powerpoint Presentation Templates
This is a company branding framework diagram powerpoint presentation templates. This is a one stage process. The stages in this process are company name, logo, identity system, branding, product, customer service, value, price, benefits, quality, company, integrity, authority, culture.
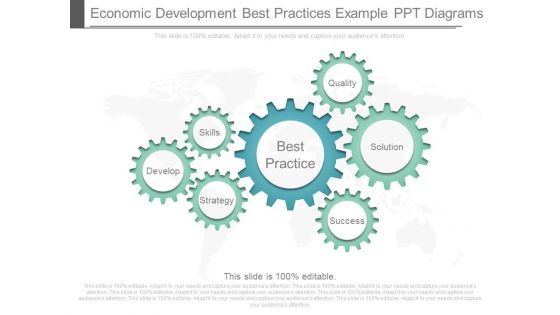
Economic Development Best Practices Example Ppt Diagrams
This is a economic development best practices example ppt diagrams. This is a seven stage process. The stages in this process are develop, skills, strategy, best practice, quality, solution, success.
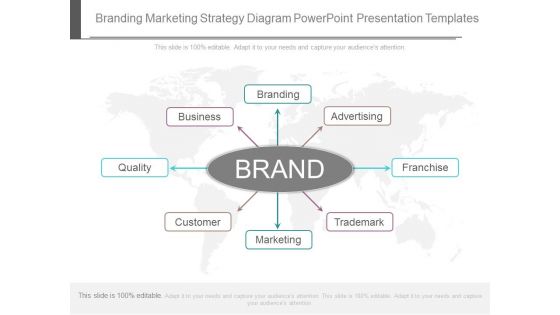
Branding Marketing Strategy Diagram Powerpoint Presentation Templates
This is a branding marketing strategy diagram powerpoint presentation templates. This is a eight stage process. The stages in this process are branding, advertising, franchise, trademark, marketing, customer, quality, business.
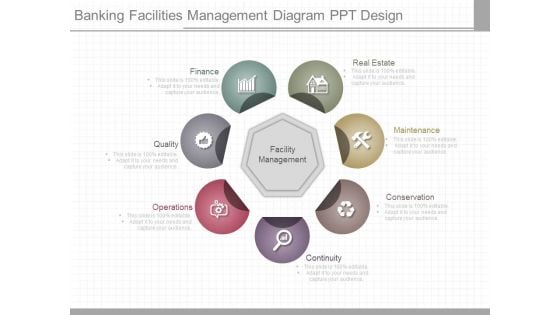
Banking Facilities Management Diagram Ppt Design
This is a banking facilities management diagram ppt design. This is a seven stage process. The stages in this process are real estate, maintenance, conservation, continuity, operations, quality, finance.
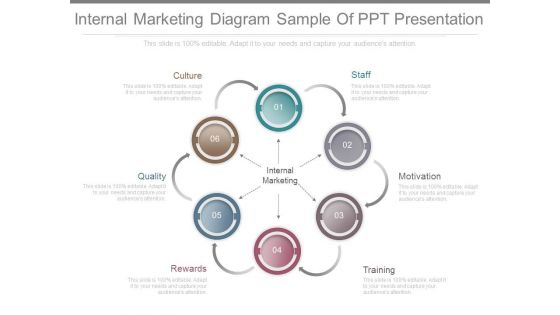
Internal Marketing Diagram Sample Of Ppt Presentation
This is a internal marketing diagram sample of ppt presentation. This is a six stage process. The stages in this process are internal marketing, culture, quality, rewards, training, motivation, staff.
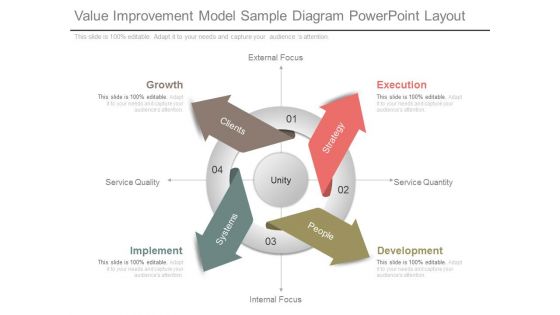
Value Improvement Model Sample Diagram Powerpoint Layout
This is a value improvement model sample diagram powerpoint layout. This is a four stage process. The stages in this process are unity, external focus, service quantity, internal focus, service quality, execution, development, implement, growth, strategy, people, systems, clients.
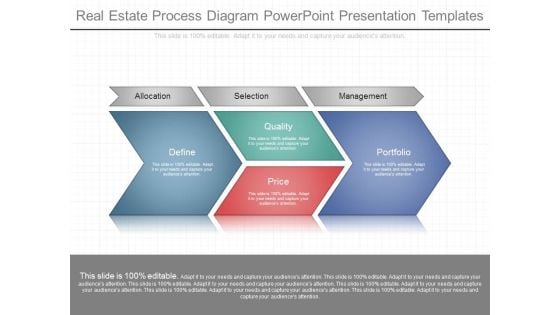
Real Estate Process Diagram Powerpoint Presentation Templates
This is a real estate process diagram powerpoint presentation templates. This is a three stage process. The stages in this process are allocation, selection, management, define, quality, price, portfolio.
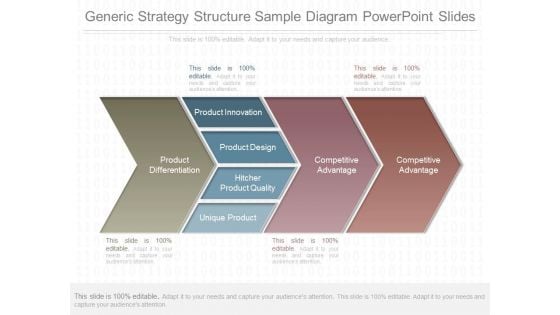
Generic Strategy Structure Sample Diagram Powerpoint Slides
This is a generic strategy structure sample diagram powerpoint slides. This is a four stage process. The stages in this process are product differentiation, product innovation, product design, hitcher product quality, unique product, competitive advantage.

Factors Impacting Job Satisfaction Diagram Powerpoint Guide
This is a factors impacting job satisfaction diagram powerpoint guide. This is a five stage process. The stages in this process are workplace support, earnings and benefits, job demands, individual virility, job quality.
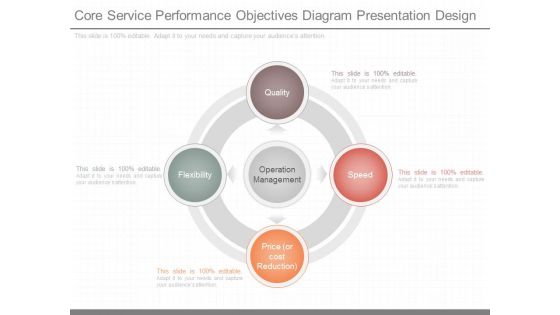
Core Service Performance Objectives Diagram Presentation Design
This is a core service performance objectives diagram presentation design. This is a four stage process. The stages in this process are operation management, quality, flexibility, price or cost reduction, speed.
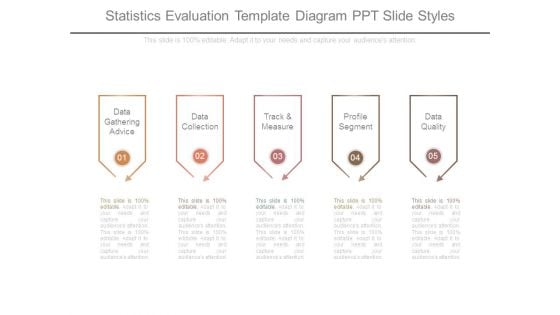
Statistics Evaluation Template Diagram Ppt Slide Styles
This is a statistics evaluation template diagram ppt slide styles. This is a five stage process. The stages in this process are data gathering advice, data collection, track and measure, profile segment, data quality.
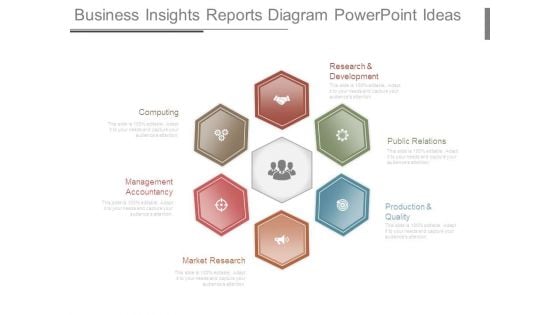
Business Insights Reports Diagram Powerpoint Ideas
This is a business insights reports diagram powerpoint ideas. This is a six stage process. The stages in this process are research and development, public relations, production and quality, market research, management accountancy, computing.
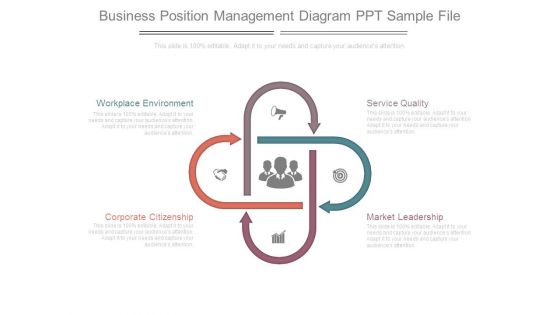
Business Position Management Diagram Ppt Sample File
This is a business position management diagram ppt sample file. This is a four stage process. The stages in this process are service quality, market leadership, corporate citizenship, workplace environment.
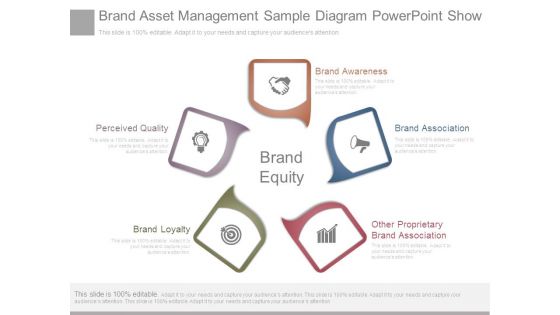
Brand Asset Management Sample Diagram Powerpoint Show
This is a brand asset management sample diagram powerpoint show. This is a five stage process. The stages in this process are brand awareness, brand association, other proprietary brand association, brand loyalty, perceived quality, brand equity.
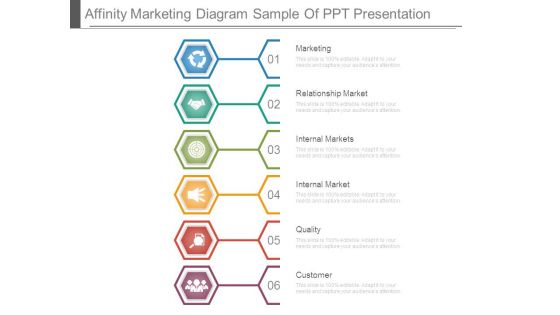
Affinity Marketing Diagram Sample Of Ppt Presentation
This is a affinity marketing diagram sample of ppt presentation. This is a six stage process. The stages in this process are marketing, relationship market, internal markets, quality, customer.
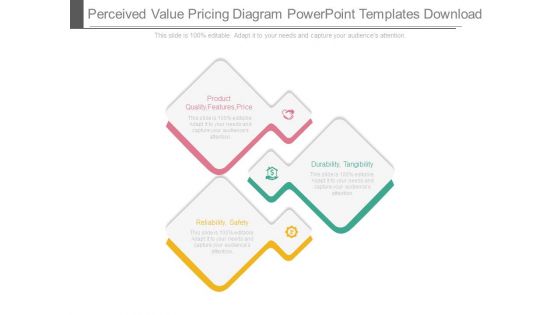
Perceived Value Pricing Diagram Powerpoint Templates Download
This is a perceived value pricing diagram powerpoint templates download. This is a three stage process. The stages in this process are product quality, features, price, reliability, safety, durability, tangibility.
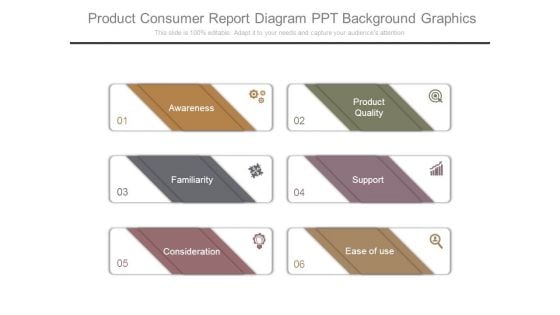
Product Consumer Report Diagram Ppt Background Graphics
This is a product consumer report diagram ppt background graphics. This is a six stage process. The stages in this process are awareness, familiarity, consideration, product quality, support, ease of use.
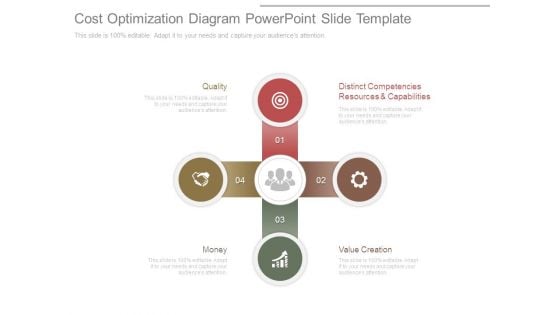
Cost Optimization Diagram Powerpoint Slide Template
This is a cost optimization diagram powerpoint slide template. This is a four stage process. The stages in this process are distinct competencies resources and capabilities, value creation, money, quality.
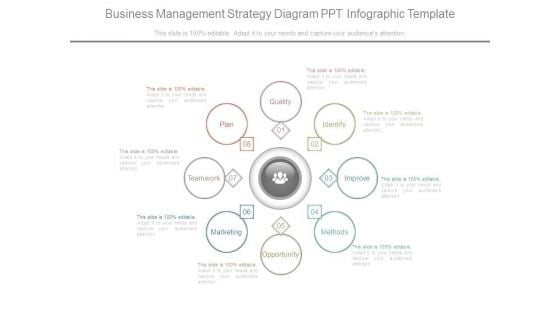
Business Management Strategy Diagram Ppt Infographic Template
This is a business management strategy diagram ppt infographic template. This is a eight stage process. The stages in this process are quality, identify, improve, methods, opportunity, marketing, teamwork, plan.
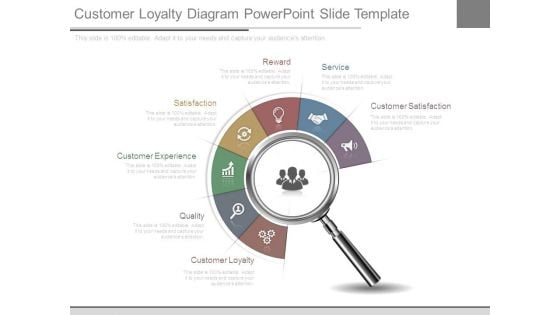
Customer Loyalty Diagram Powerpoint Slide Template
This is a customer loyalty diagram powerpoint slide template. This is a seven stage process. The stages in this process are customer loyalty, quality, customer experience, satisfaction, reward, service, customer satisfaction.
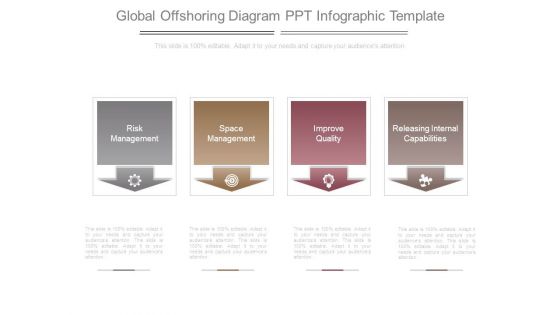
Global Offshoring Diagram Ppt Infographic Template
This is a global offshoring diagram ppt infographic template. This is a four stage process. The stages in this process are risk management, space management, improve quality, releasing internal capabilities.
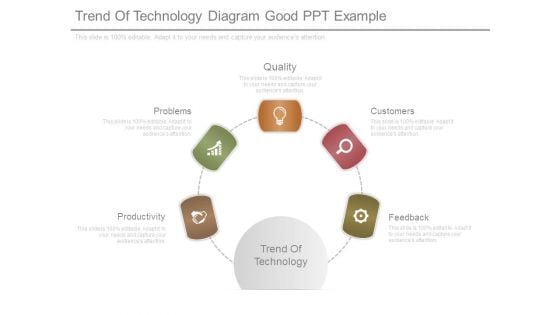
Trend Of Technology Diagram Good Ppt Example
This is a trend of technology diagram good ppt example. This is a five stage process. The stages in this process are productivity, problems, quality, customers, feedback, trend of technology.
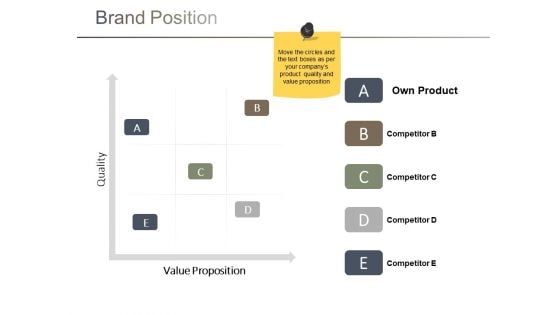
Brand Position Ppt PowerPoint Presentation Diagram Ppt
This is a brand position ppt powerpoint presentation diagram ppt. This is a five stage process. The stages in this process are quality, value proposition, own product, business, marketing.
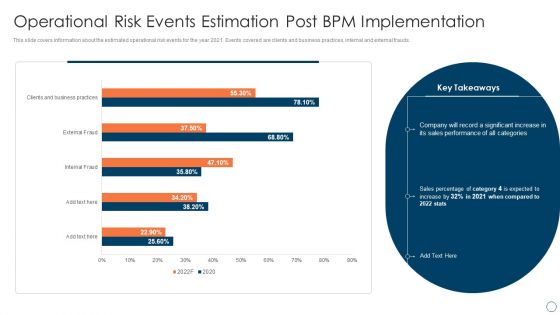
BPM Tools Application To Increase Operational Risk Events Estimation Post Bpm Implementation Infographics PDF
BPM Tools Application To Increase Selecting The Suitable Bpm Technology For Business Icons PDF Do you have to make sure that everyone on your team knows about any specific topic I yes, then you should give BPM Tools Application To Increase Operational Risk Events Estimation Post Bpm Implementation Infographics PDF a try. Our experts have put a lot of knowledge and effort into creating this impeccable BPM Tools Application To Increase Operational Risk Events Estimation Post Bpm Implementation Infographics PDF. You can use this template for your upcoming presentations, as the slides are perfect to represent even the tiniest detail. You can download these templates from the Slidegeeks website and these are easy to edit. So grab these today.
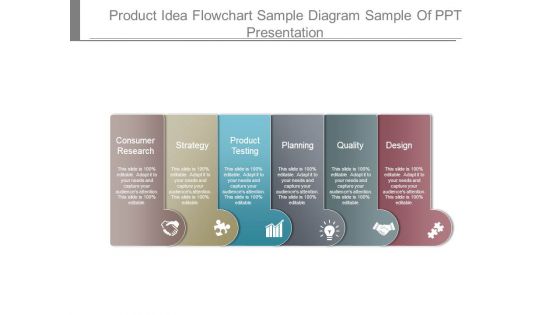
Product Idea Flowchart Sample Diagram Sample Of Ppt Presentation
This is a product idea flowchart sample diagram sample of ppt presentation. This is a six stage process. The stages in this process are consumer research, strategy, product testing, planning, quality, design.
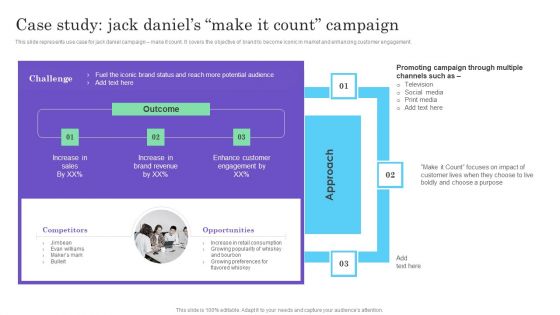
Cultural Branding Marketing Strategy To Increase Lead Generation Case Study Jack Daniels Make It Count Campaign Professional PDF
This slide represents use case for jack daniel campaign make it count. It covers the objective of brand to become iconic in market and enhancing customer engagement. If you are looking for a format to display your unique thoughts, then the professionally designed Cultural Branding Marketing Strategy To Increase Lead Generation Case Study Jack Daniels Make It Count Campaign Professional PDF is the one for you. You can use it as a Google Slides template or a PowerPoint template. Incorporate impressive visuals, symbols, images, and other charts. Modify or reorganize the text boxes as you desire. Experiment with shade schemes and font pairings. Alter, share or cooperate with other people on your work. Download Cultural Branding Marketing Strategy To Increase Lead Generation Case Study Jack Daniels Make It Count Campaign Professional PDF and find out how to give a successful presentation. Present a perfect display to your team and make your presentation unforgettable.
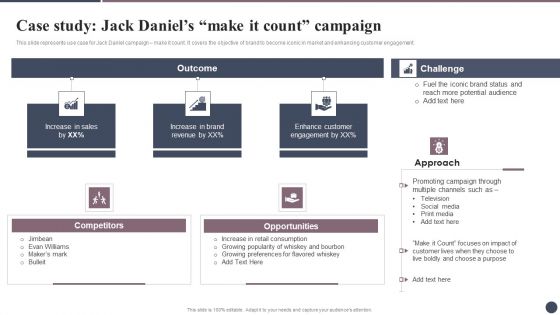
Expanding Target Audience With Cultural Branding Case Study Jack Daniels Make IT Slides PDF
This slide represents use case for Jack Daniel campaign make it count. It covers the objective of brand to become iconic in market and enhancing customer engagement. Retrieve professionally designed Expanding Target Audience With Cultural Branding Case Study Jack Daniels Make IT Slides PDF to effectively convey your message and captivate your listeners. Save time by selecting pre-made slideshows that are appropriate for various topics, from business to educational purposes. These themes come in many different styles, from creative to corporate, and all of them are easily adjustable and can be edited quickly. Access them as PowerPoint templates or as Google Slides themes. You dont have to go on a hunt for the perfect presentation because Slidegeeks got you covered from everywhere.
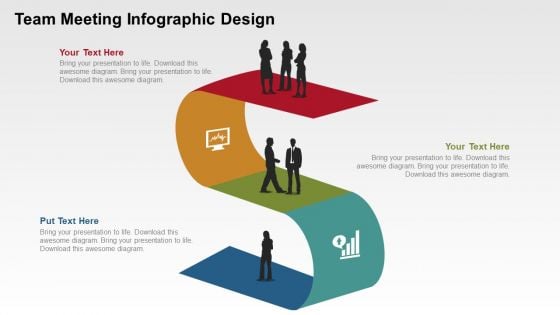
Team Meeting Infographic Design PowerPoint Templates
This template can be best used to describe different levels in an organization. It could be perfect solution if you are looking for a slide to depict the existing hierarchy or flow of communication in a company. This S shaped PowerPoint template is good enough to encourage your colleagues, teammates to reach their goals. This slide can represent stairs and what steps have to be taken to reach the top or achieve the targets. This diagram also displays how you can plan or discuss things with others during your journey. And slowly steadily you are there at the top. You can easily modify it per your needs and convenience. The human icons are editable. Use this background to make your point easy to understand.
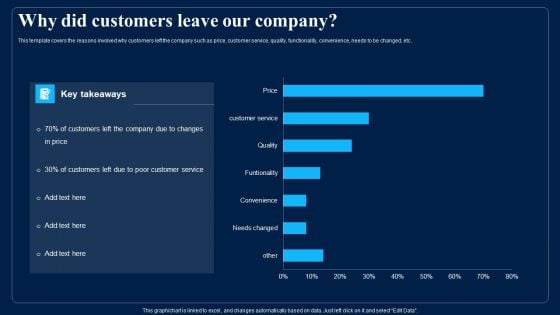
Identifying Optimum Pricing Methods For Business Why Did Customers Leave Our Company Diagrams PDF
This template covers the reasons involved why customers left the company such as price, customer service, quality, functionality, convenience, needs to be changed, etc. Deliver and pitch your topic in the best possible manner with this Identifying Optimum Pricing Methods For Business Why Did Customers Leave Our Company Diagrams PDF. Use them to share invaluable insights on Quality, Customer Service, Price and impress your audience. This template can be altered and modified as per your expectations. So, grab it now.
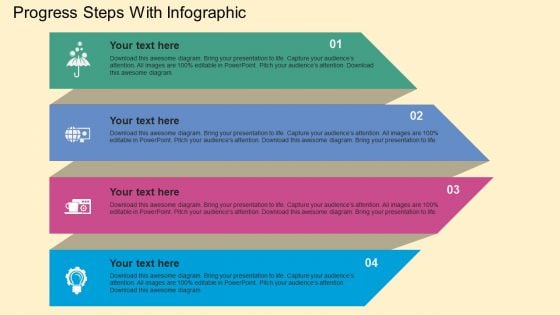
Progress Steps With Infographic Powerpoint Templates
This colorful PowerPoint template can be used for various purposes irrespective of whether it?s a professional or casual presentation. The slide has a very modern and attractive design. The 4 shapes can be used for index and numbering purposes. Because of their nature of size, they can hold good amount of text within them. The slide can be used for denoting various steps of a process. They can also be used to describe a ?moving forward? strategy of a business or an organization. With the perfect placement of icons next to the text, this slide can surely be understood without any assistance of any kind. This slide has been created keeping professional colors and designs in mind but they are 100% customizable and can be modified as per needs and requirements.
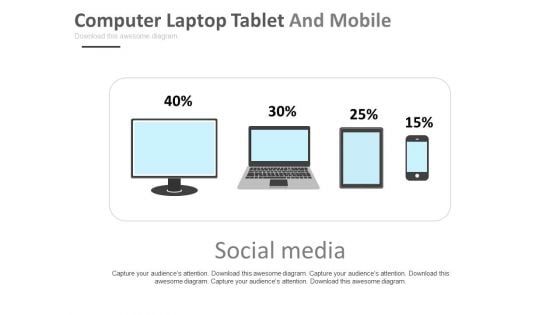
Computer Laptop Tablet And Mobile With Percentage Values Powerpoint Slides
This slide which shows a mobile, a tablet and a laptop / TV screen can be perfectly used to demonstrate compatibility of an application or a website on different kind of devices, operating systems and screen sizes. This slide can be used by business and organizations dealing with technology in any manner. The slide can be used to demonstrate the usage experience on different screen sizes. It can be used to demonstrate the number of users of a website or an app or a particular platform. It can also easily depict the ratio of users on the based on their usage patterns and preferences of devise. This can be an effective way to compare one gadget with another. The slide is customizable and can be used with different icons and colors as per the convenience and needs of the user.
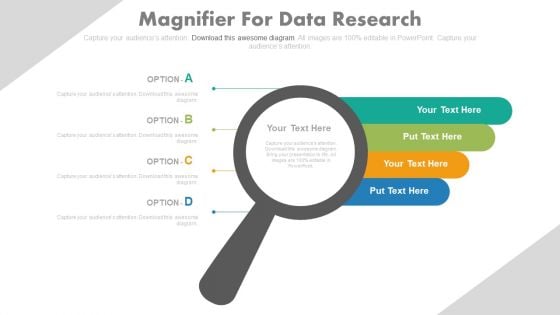
Magnifier With Four Options Tags Powerpoint Slides
The Magnifying glass used in this PowerPoint template can be used for various purposes. This slide can be the perfect answer to business or organizations dealing with investigation or rendering their services as a private detective or other investigation services. The slide can be effectively used to send across a message about verification or double checking of any kind of information. It can be used to imply in depth analysis of a report or minute details about meetings. The colorful tags can further be used to present the results or comparisons between available options or variants of products or services. The slide is customizable and icons and colors can be changed as per needs and convenience.
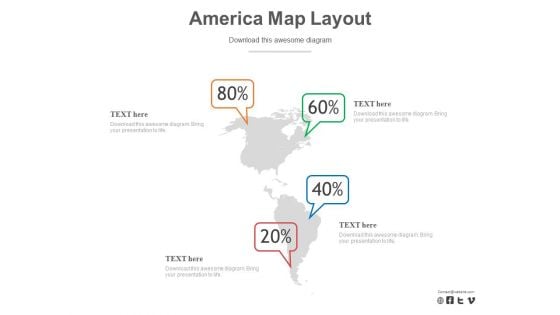
Map Of America With Percentage Data PowerPoint Slides
Nothing can explain locations better than a map itself. Then why not use it to make your PowerPoint presentation more visual, interesting and the one which leaves a good impression. If you have business around North and South America or your company or organization has clients or industries located in these 2 continents, then we have the perfect slide for you. You can effectively use this slide to show the distribution of clients or any other factor in percentage basis. The creatively designed map can also be used to show a comparison of your user?s location. This can also be an ideal slide to explain the travel and tourism trend prevailing in the continents. This slide is customizable and the icons can be placed anywhere on the map as per the need of the presentation.
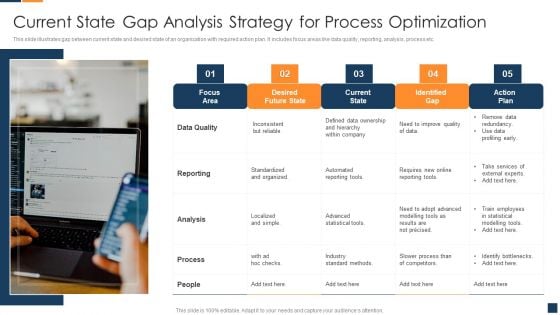
Current State Gap Analysis Strategy For Process Optimization Diagrams PDF
This slide illustrates gap between current state and desired state of an organization with required action plan. It includes focus areas like data quality, reporting, analysis, process etc. Presenting Current State Gap Analysis Strategy For Process Optimization Diagrams PDF to dispense important information. This template comprises five stages. It also presents valuable insights into the topics including Data Quality, Reporting, Analysis. This is a completely customizable PowerPoint theme that can be put to use immediately. So, download it and address the topic impactfully.
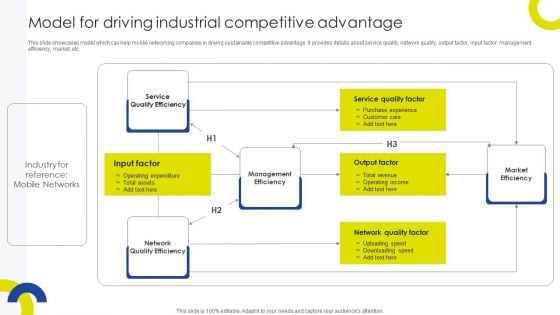
Sustainable Initiatives For Competitive Model For Driving Industrial Competitive Themes PDF
This slide showcases model which can help mobile networking companies in driving sustainable competitive advantage. It provides details about service quality, network quality, output factor, input factor, management efficiency, market, etc. There are so many reasons you need a Sustainable Initiatives For Competitive Model For Driving Industrial Competitive Themes PDF. The first reason is you cant spend time making everything from scratch, Thus, Slidegeeks has made presentation templates for you too. You can easily download these templates from our website easily.
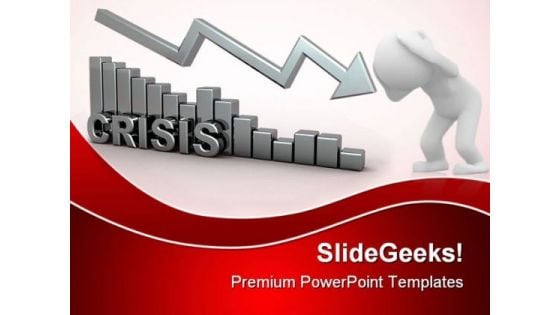
Diagram Crisis Business PowerPoint Templates And PowerPoint Backgrounds 0411
Microsoft PowerPoint Template and Background with diagram crisis word Expose your audience to high quality. Our Diagram Crisis Business PowerPoint Templates And PowerPoint Backgrounds 0411 are a befitting example.
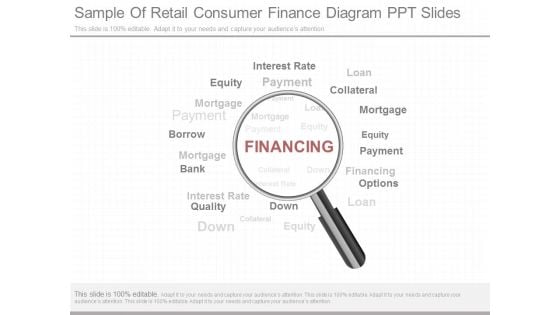
Sample Of Retail Consumer Finance Diagram Ppt Slides
This is a sample of retail consumer finance diagram ppt slides. This is a one stage process. The stages in this process are payment, options, down, quality, bank, borrow, equity.
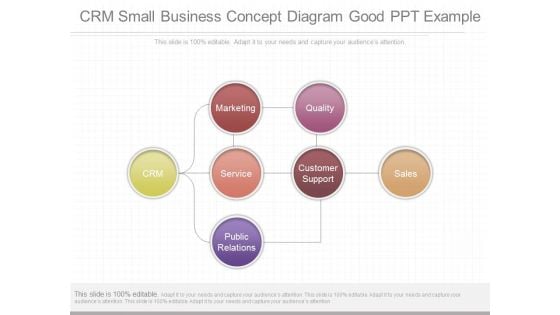
Crm Small Business Concept Diagram Good Ppt Example
This is a crm small business concept diagram good ppt example. This is a seven stage process. The stages in this process are crm, marketing, quality, service, customer support, public relations, sales.
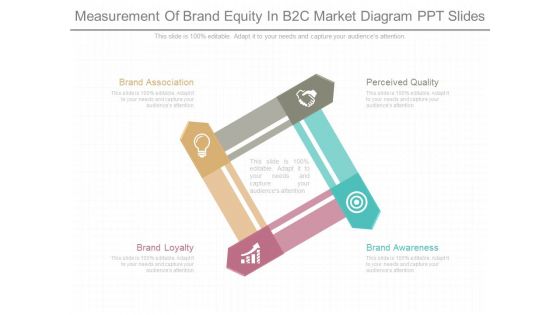
Measurement Of Brand Equity In B2c Market Diagram Ppt Slides
This is a measurement of brand equity in b2c market diagram ppt slides. This is a four stage process. The stages in this process are brand association, brand loyalty, brand awareness, perceived quality.
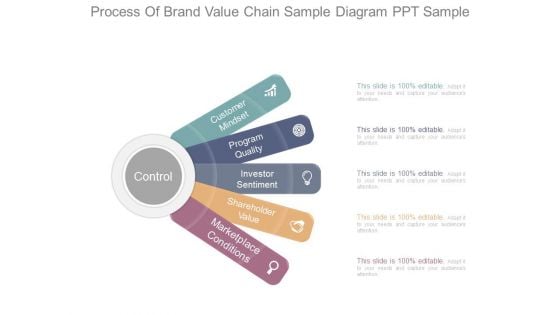
Process Of Brand Value Chain Sample Diagram Ppt Sample
This is a process of brand value chain sample diagram ppt sample. This is a five stage process. The stages in this process are marketplace conditions, shareholder value, investor sentiment, program quality, customer mindset, control.
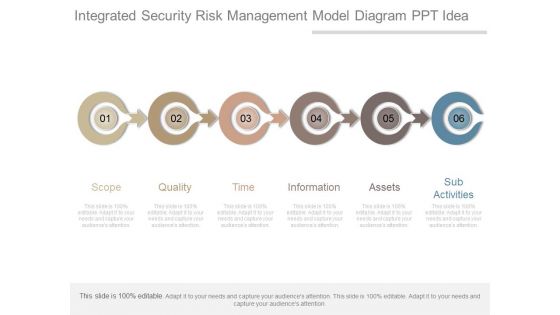
Integrated Security Risk Management Model Diagram Ppt Idea
This is a integrated security risk management model diagram ppt idea. This is a six stage process. The stages in this process are scope, quality, time, information, assets, sub activities.
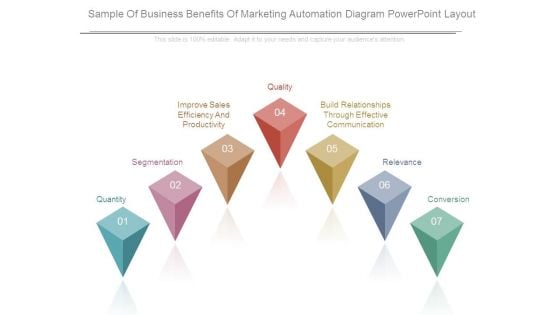
Sample Of Business Benefits Of Marketing Automation Diagram Powerpoint Layout
This is a sample of business benefits of marketing automation diagram powerpoint layout. This is a seven stage process. The stages in this process are quantity, segmentation, improve sales efficiency and productivity, build relationships through effective communication, quality, relevance, conversion.
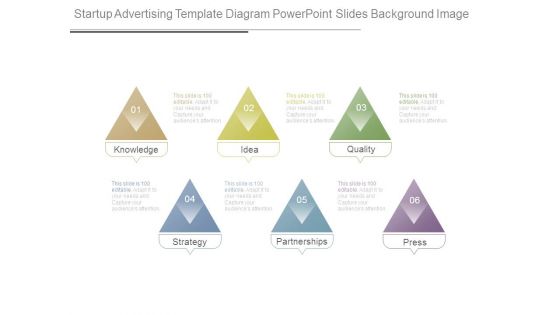
Startup Advertising Template Diagram Powerpoint Slides Background Image
This is a startup advertising template diagram powerpoint slides background image. This is a six stage process. The stages in this process are knowledge, idea, quality, strategy, partnerships, press.
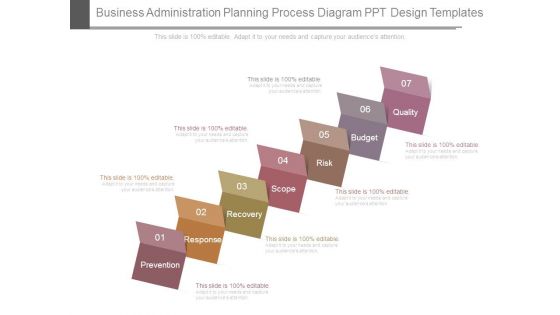
Business Administration Planning Process Diagram Ppt Design Templates
This is a business administration planning process diagram ppt design templates. This is a seven stage process. The stages in this process are prevention, response, recovery, scope, risk, budget, quality.
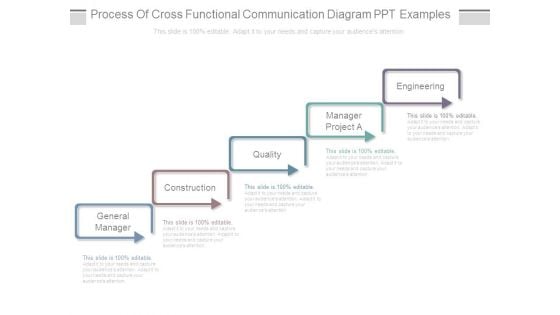
Process Of Cross Functional Communication Diagram Ppt Examples
This is a process of cross functional communication diagram ppt examples. This is a five stage process. The stages in this process are general manager, construction, quality, manager project a, engineering.
Digital Brand Tracking Ppt Diagram Powerpoint Slide Presentation Tips
This is a digital brand tracking ppt diagram powerpoint slide presentation tips. This is a eight stage process. The stages in this process are content, brand identify, mobile, perceived quality, brand loyalty, social, brand awareness, web.

 Home
Home