Quality Inspection
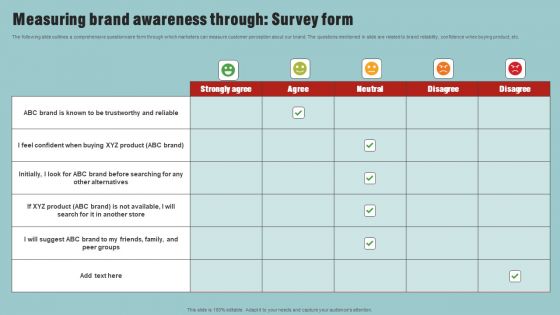
Market Analysis Overview And Different Categories Measuring Brand Awareness Through Survey Form Inspiration PDF
The following slide outlines a comprehensive questionnaire form through which marketers can measure customer perception about our brand. The questions mentioned in slide are related to brand reliability, confidence when buying product, etc. Do you know about Slidesgeeks Market Analysis Overview And Different Categories Measuring Brand Awareness Through Survey Form Inspiration PDF. These are perfect for delivering any kind od presentation. Using it, create PowerPoint presentations that communicate your ideas and engage audiences. Save time and effort by using our pre designed presentation templates that are perfect for a wide range of topic. Our vast selection of designs covers a range of styles, from creative to business, and are all highly customizable and easy to edit. Download as a PowerPoint template or use them as Google Slides themes.
Blood Sample Checking During Medical Testing Ppt PowerPoint Presentation Icon Infographics PDF
Presenting blood sample checking during medical testing ppt powerpoint presentation icon infographics pdf to dispense important information. This template comprises three stages. It also presents valuable insights into the topics including blood sample checking during medical testing. This is a completely customizable PowerPoint theme that can be put to use immediately. So, download it and address the topic impactfully.
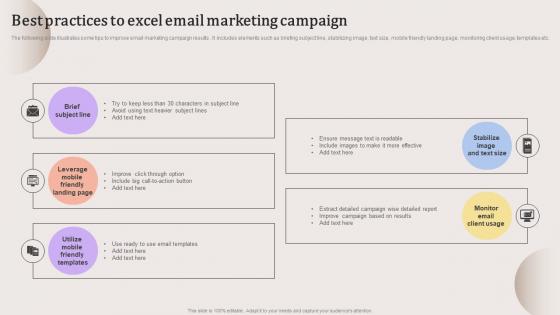
Best Practices To Excel Email Marketing Evaluating Strengths And Weaknesses Template Pdf
The following slide illustrates some tips to improve email marketing campaign results . It includes elements such as briefing subject line, stabilizing image, text size, mobile friendly landing page, monitoring client usage, templates etc.Retrieve professionally designed Best Practices To Excel Email Marketing Evaluating Strengths And Weaknesses Template Pdf to effectively convey your message and captivate your listeners. Save time by selecting pre-made slideshows that are appropriate for various topics, from business to educational purposes. These themes come in many different styles, from creative to corporate, and all of them are easily adjustable and can be edited quickly. Access them as PowerPoint templates or as Google Slides themes. You do not have to go on a hunt for the perfect presentation because Slidegeeks got you covered from everywhere. The following slide illustrates some tips to improve email marketing campaign results . It includes elements such as briefing subject line, stabilizing image, text size, mobile friendly landing page, monitoring client usage, templates etc.
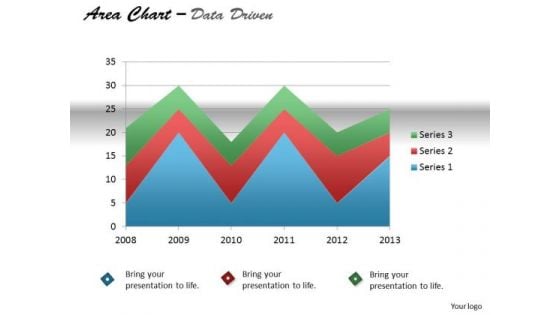
Quantitative Data Analysis Driven Display Series With Area Chart PowerPoint Slides Templates
Our quantitative data analysis driven display series with area chart powerpoint slides Templates Enjoy Drama. They Provide Entertaining Backdrops.
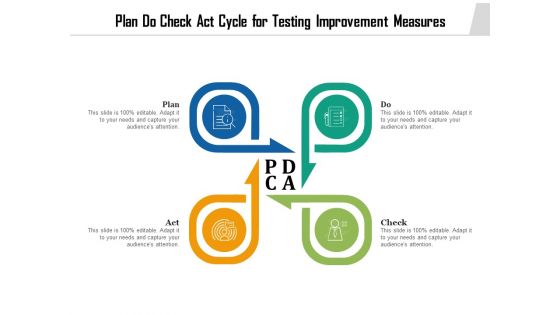
Plan Do Check Act Cycle For Testing Improvement Measures Ppt PowerPoint Presentation Topics PDF
Persuade your audience using this plan do check act cycle for testing improvement measures ppt powerpoint presentation topics pdf. This PPT design covers four stages, thus making it a great tool to use. It also caters to a variety of topics including plan do check act cycle for testing improvement measures. Download this PPT design now to present a convincing pitch that not only emphasizes the topic but also showcases your presentation skills.
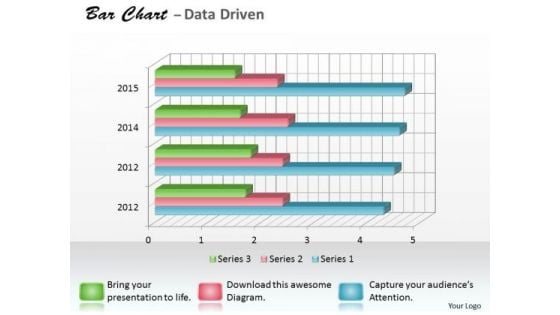
Data Analysis Programs 3d Bar Chart For Research In Statistics PowerPoint Templates
Draw It Out On Our data analysis programs 3d bar chart for research in statistics Powerpoint Templates . Provide Inspiration To Your Colleagues.
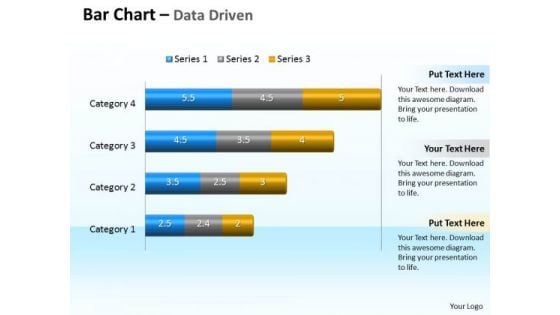
Data Analysis Programs 3d Bar Chart To Compare Categories PowerPoint Templates
Discover Decisive Moments With Our data analysis programs 3d bar chart to compare categories Powerpoint Templates . They Help Make That Crucial Difference.
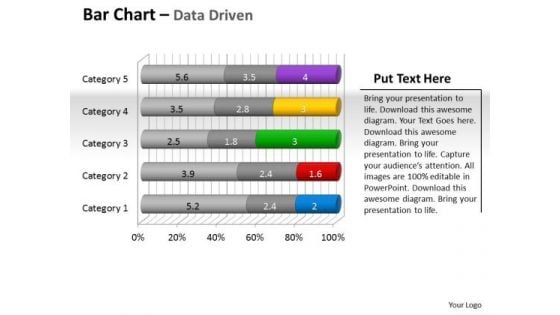
Data Analysis Programs 3d Bar Chart To Put Information PowerPoint Templates
Draw Up Your Agenda On Our data analysis programs 3d bar chart to put information Powerpoint Templates . Coax Your Audience Into Acceptance.
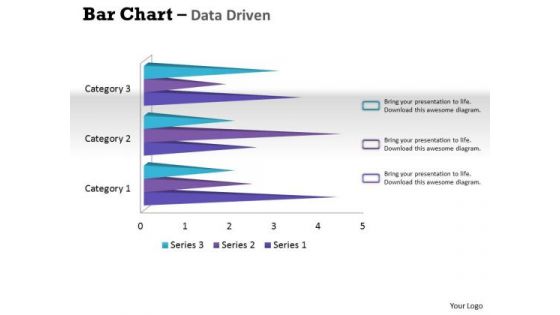
Data Analysis Techniques 3d Bar Chart For Financial Solutions PowerPoint Templates
Make Your Dreams A Reality With Our data analysis techniques 3d bar chart for financial solutions Powerpoint Templates . Your Ideas Will Begin To Take Shape.

Data Analysis Template Driven Express Business Facts Pie Chart PowerPoint Slides Templates
Display Your Drive On Our data analysis template driven express business facts pie chart powerpoint slides Templates . Invigorate The Audience With Your Fervor.
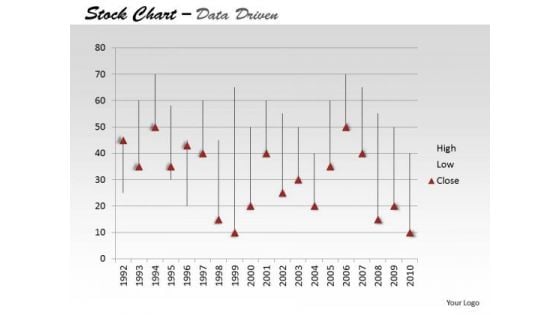
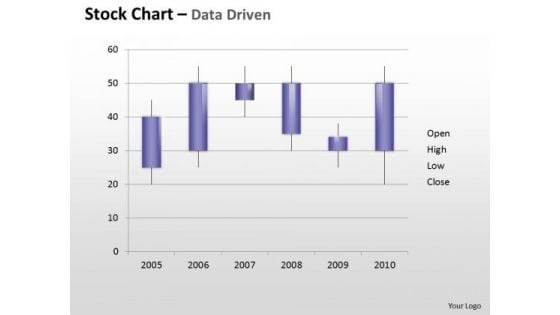
Data Analysis Template Driven Ineract With Stock Chart PowerPoint Slides Templates
Drive Your Passion With Our data analysis template driven ineract with stock chart powerpoint slides Templates . Steer Yourself To Achieve Your Aims.
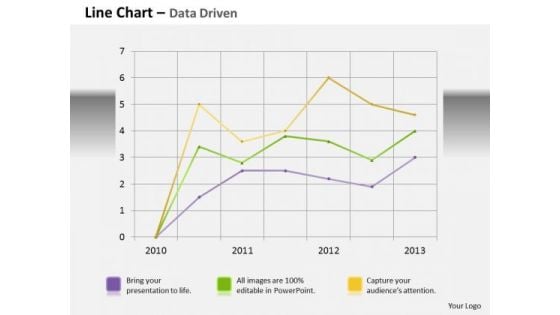
Data Analysis Template Driven Line Chart Business Graph PowerPoint Slides Templates
Bottle Your Thoughts In Our data analysis template driven line chart business graph powerpoint slides Templates . Pass It Around For Your Audience To Sip.
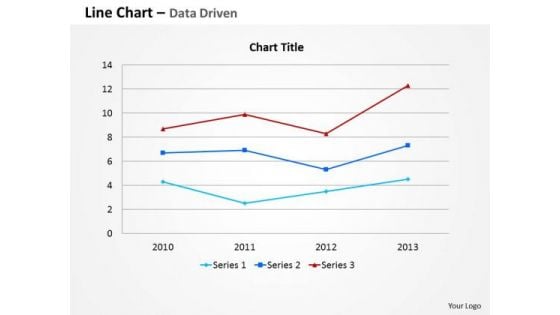
Data Analysis Template Driven Line Chart For Business Information PowerPoint Slides Templates
Your Thoughts Are Dripping With Wisdom. Lace It With Our data analysis template driven line chart for business information powerpoint slides Templates .
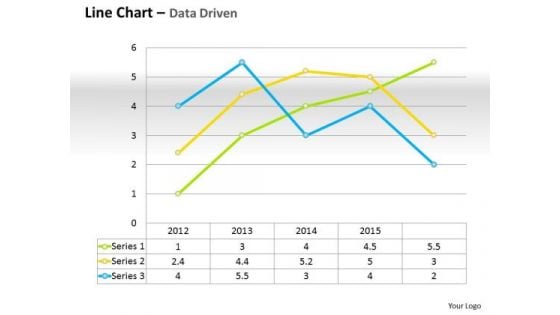
Data Analysis Template Driven Line Chart For Business Performance PowerPoint Slides Templates
Do Not Allow Things To Drift. Ring In Changes With Our data analysis template driven line chart for business performance powerpoint slides Templates .
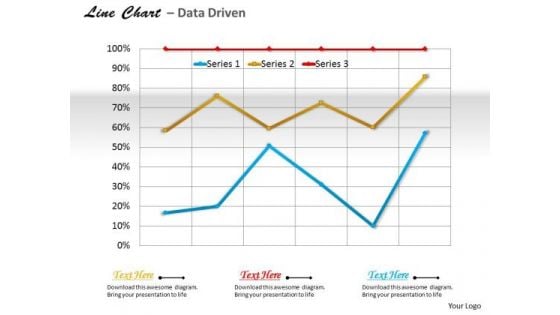
Data Analysis Template Driven Line Chart For Business Trends PowerPoint Slides Templates
Use Our data analysis template driven line chart for business trends powerpoint slides Templates As The Bit. Drill Your Thoughts Into Their Minds.
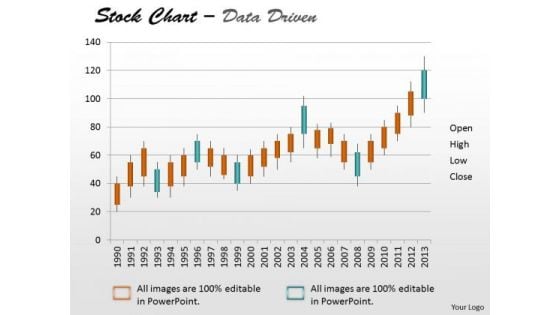
Data Analysis Template Driven Stock Chart For Market Trends PowerPoint Slides Templates
Drive Your Team Along The Road To Success. Take The Wheel With Our data analysis template driven stock chart for market trends powerpoint slides Templates .
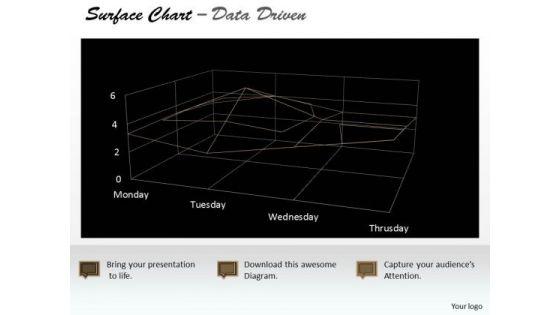
Data Analysis Template Driven Surface Chart Indicating Areas PowerPoint Slides Templates
Highlight Your Drive With Our data analysis template driven surface chart indicating areas powerpoint slides Templates . Prove The Fact That You Have Control.
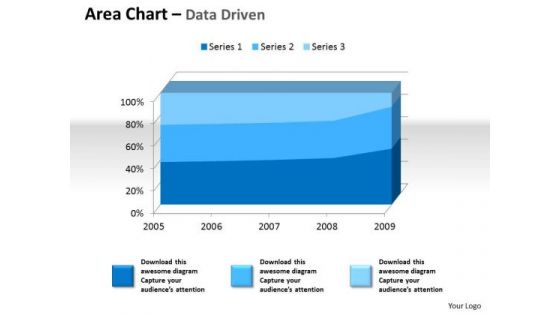
Examples Of Data Analysis Market 3d Area Chart For Quantiative PowerPoint Templates
Drum It Up With Our examples of data analysis market 3d area chart for quantiative Powerpoint Templates . Your Thoughts Will Raise The Tempo.
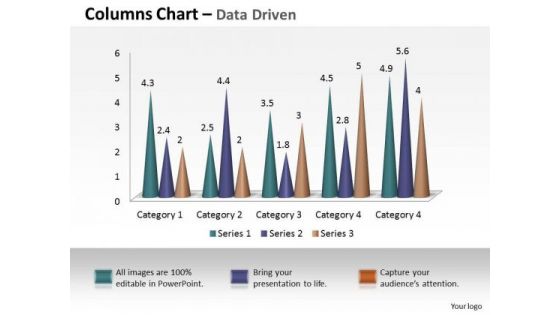
Examples Of Data Analysis Market 3d Business Intelligence And PowerPoint Templates
Our examples of data analysis market 3d business intelligence and Powerpoint Templates Are Dual Purpose. They Help Instruct And Inform At The Same Time.
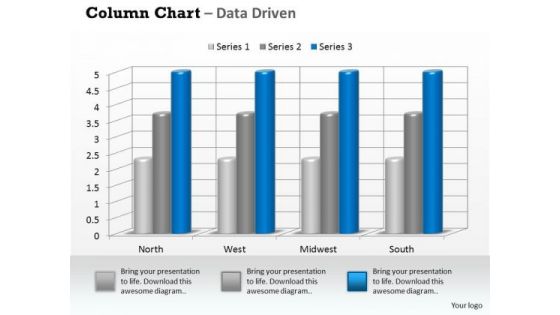
Examples Of Data Analysis Market 3d Business On Regular Intervals PowerPoint Templates
Drum It Out Loud And Clear On Our examples of data analysis market 3d business on regular intervals Powerpoint Templates . Your Words Will Ring In Their Ears.
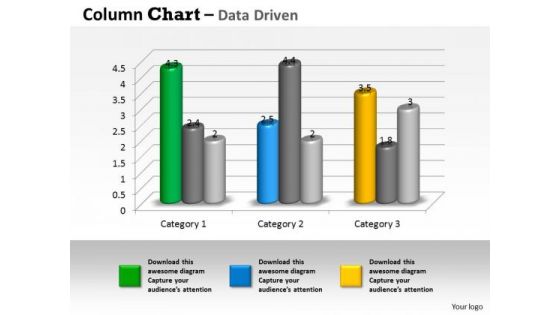
Examples Of Data Analysis Market 3d Business Trend Series Chart PowerPoint Templates
Duct It Through With Our examples of data analysis market 3d business trend series chart Powerpoint Templates . Your Ideas Will Reach Into Their Minds Intact.
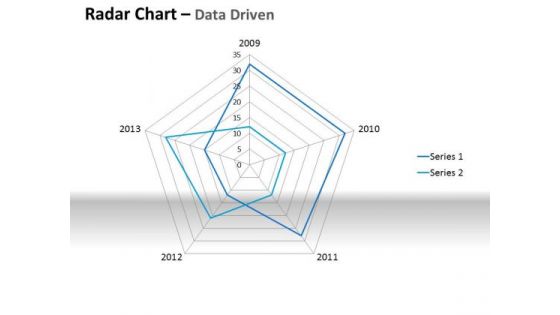
Examples Of Data Analysis Market Driven Plotting The Business Values PowerPoint Slides Templates
Ring The Duck With Our examples of data analysis market driven plotting the business values powerpoint slides Templates . Acquire The Points With Your Ideas.
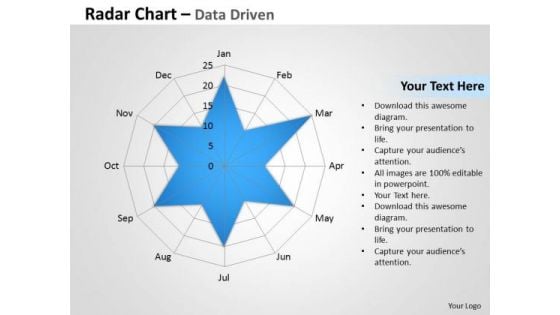
Examples Of Data Analysis Market Driven Radar Chart To Compare PowerPoint Slides Templates
Rely On Our examples of data analysis market driven radar chart to compare powerpoint slides Templates In Any Duel. They Will Drive Home Your Point.
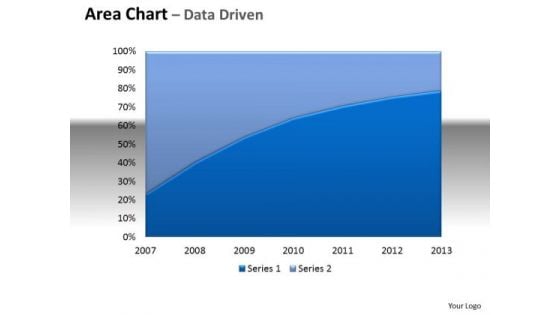
Financial Data Analysis Area Chart With Plotted Line Center PowerPoint Templates
Be The Doer With Our financial data analysis area chart with plotted line center Powerpoint Templates . Put Your Thoughts Into Practice.
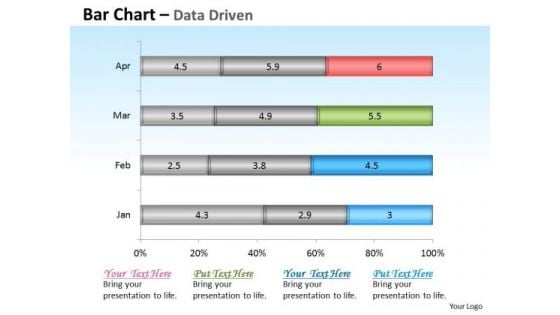
Financial Data Analysis Driven Base Bar Chart Design PowerPoint Slides Templates
Get The Domestics Right With Our financial data analysis driven base bar chart design powerpoint slides Templates . Create The Base For Thoughts To Grow.
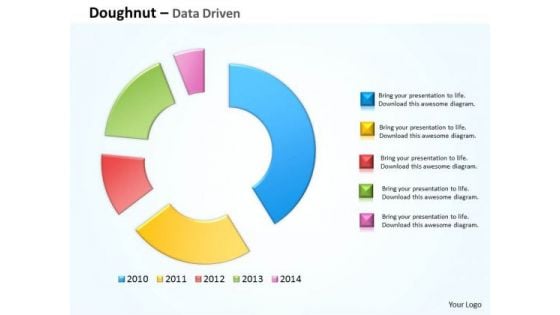
Financial Data Analysis Driven Compare Market Share Of Brand PowerPoint Templates
Doll Up Your Thoughts With Our financial data analysis driven compare market share of brand Powerpoint Templates . They Will Make A Pretty Picture.
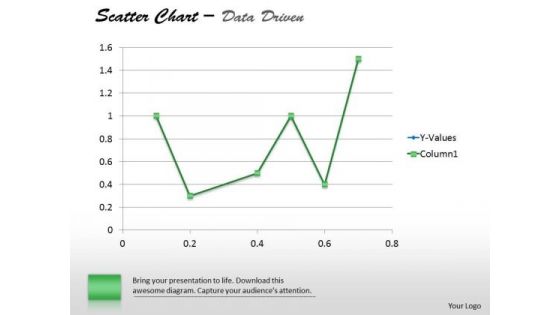
Financial Data Analysis Driven Demonstrate Statistics With Scatter Chart PowerPoint Slides Templates
Establish The Dominance Of Your Ideas. Our financial data analysis driven demonstrate statistics with scatter chart powerpoint slides Templates Will Put Them On Top.
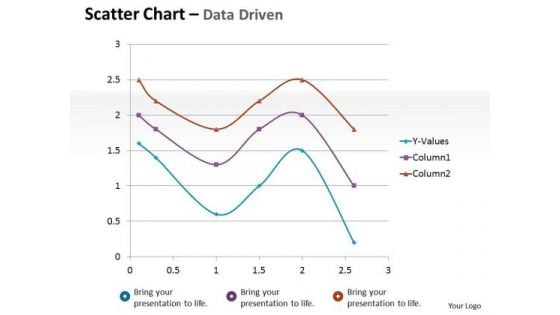
Financial Data Analysis Driven Scatter Chart Mathematical Diagram PowerPoint Slides Templates
Dominate Proceedings With Your Ideas. Our financial data analysis driven scatter chart mathematical diagram powerpoint slides Templates Will Empower Your Thoughts.
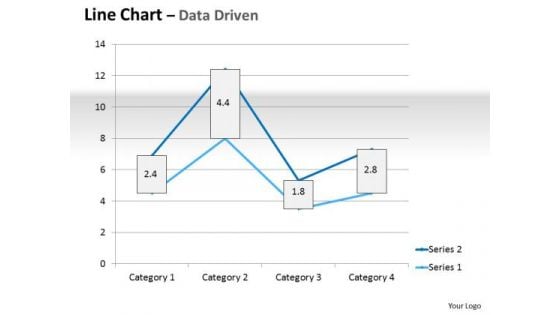
Multivariate Data Analysis Driven Line Chart Market Graph PowerPoint Slides Templates
Plan For All Contingencies With Our multivariate data analysis driven line chart market graph powerpoint slides Templates . Douse The Fire Before It Catches.
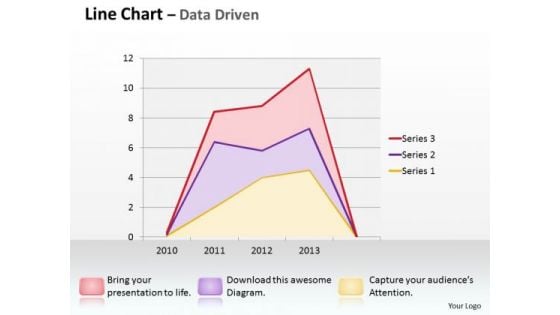
Multivariate Data Analysis Driven Line Chart Shows Revenue Trends PowerPoint Slides Templates
Good Camaraderie Is A Key To Teamwork. Our multivariate data analysis driven line chart shows revenue trends powerpoint slides Templates Can Be A Cementing Force.
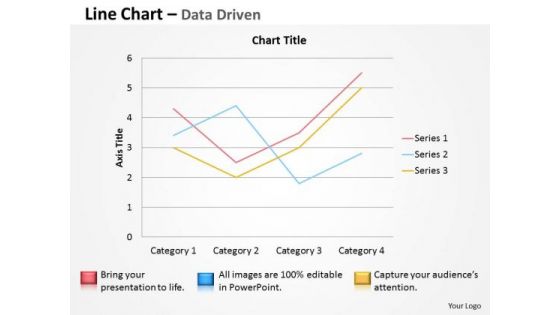
Multivariate Data Analysis Driven Line Chart To Demonstrate PowerPoint Slides Templates
Brace Yourself, Arm Your Thoughts. Prepare For The Hustle With Our multivariate data analysis driven line chart to demonstrate powerpoint slides Templates .
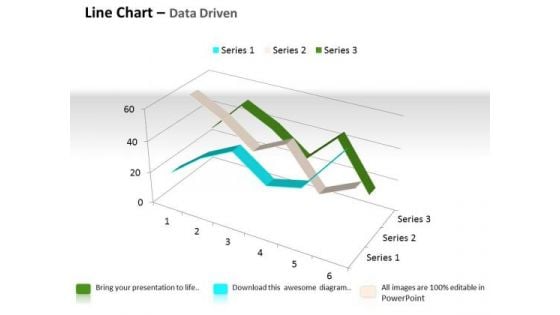
Quantitative Data Analysis 3d Line Chart For Comparison Of PowerPoint Templates
Touch Base With Our quantitative data analysis 3d line chart for comparison of Powerpoint Templates . Review Your Growth With Your Audience.

Quantitative Data Analysis 3d Pie Chart For Business Process PowerPoint Templates
Put Them On The Same Page With Our quantitative data analysis 3d pie chart for business process Powerpoint Templates . Your Team Will Sing From The Same Sheet.
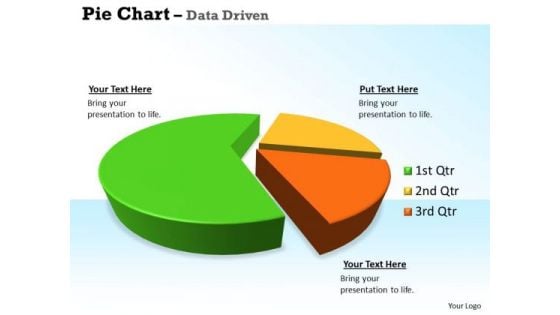
Quantitative Data Analysis 3d Pie Chart For Business Statistics PowerPoint Templates
Our quantitative data analysis 3d pie chart for business statistics Powerpoint Templates Allow You To Do It With Ease. Just Like Picking The Low Hanging Fruit.
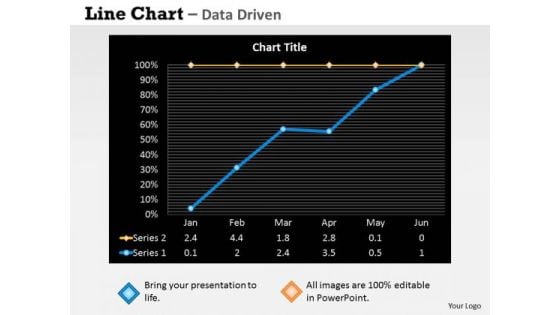
Quantitative Data Analysis Driven Economic Status Line Chart PowerPoint Slides Templates
Be The Dramatist With Our quantitative data analysis driven economic status line chart powerpoint slides Templates . Script Out The Play Of Words.
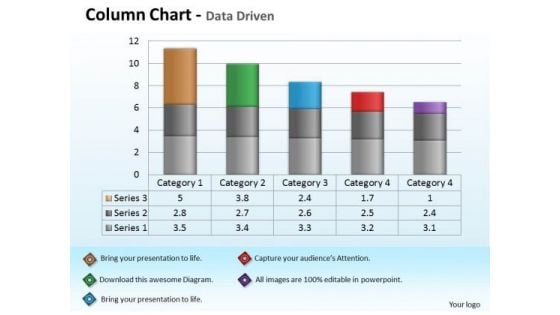
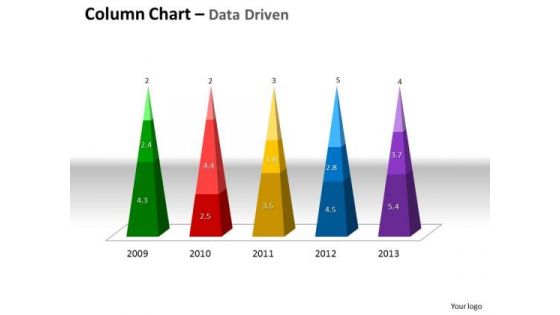
Quantitative Data Analysis Driven Economic With Column Chart PowerPoint Slides Templates
Add Some Dramatization To Your Thoughts. Our quantitative data analysis driven economic with column chart powerpoint slides Templates Make Useful Props.
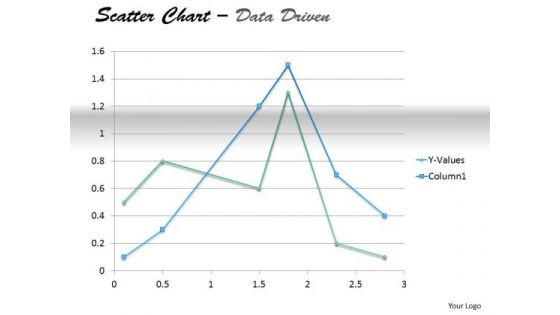
Examples Of Data Analysis Market Driven Present In Scatter Chart PowerPoint Slides Templates
Your Thoughts Will Take To Our examples of data analysis market driven present in scatter chart powerpoint slides Templates Like A Duck To Water. They Develop A Binding Affinity.

Business Diagram Data Driven Bar Graph And Pie Chart For Analysis PowerPoint Slide
This PowerPoint template displays technology gadgets with various business charts. Use this diagram slide, in your presentations to make business reports for statistical analysis. You may use this diagram to impart professional appearance to your presentations.
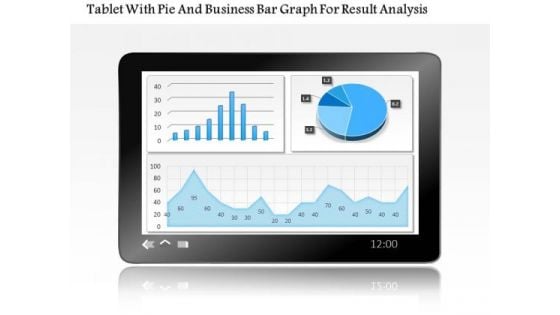
Business Diagram Tablet With Pie And Business Bar Graph For Result Analysis PowerPoint Slide
This PowerPoint template displays technology gadgets with various business charts. Use this diagram slide, in your presentations to make business reports for statistical analysis. You may use this diagram to impart professional appearance to your presentations.
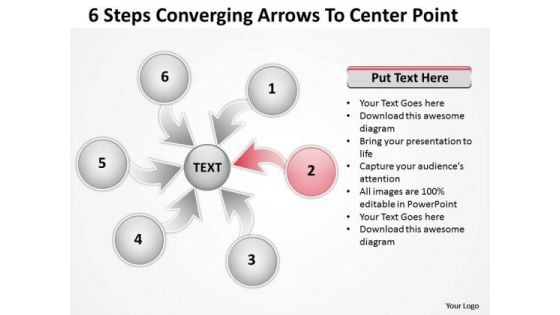
6 Steps Converging Arrows To Center Point Cycle Diagram PowerPoint Templates
We present our 6 steps converging arrows to center point Cycle Diagram PowerPoint templates.Use our Leadership PowerPoint Templates because this outlines the path you have in mind in order to boost sales and stay ahead of the competition enhancing your corporate reputation as you go along the road to success. Download our Business PowerPoint Templates because Building castles in the sand is a danger and you are aware of. You have taken the precaution of building strong fundamentals. Download our Spheres PowerPoint Templates because you can gain the success to desired levels in one go. Present our Process and Flows PowerPoint Templates because it helps to inject your values into your group and see them bond to achieve success. Present our Arrows PowerPoint Templates because you have an idea of which you are sure.Use these PowerPoint slides for presentations relating to Arrow, Blue, Business, Chart, Check, Circle, Concept, Control, Cycle, Design, Development, Diagram, Do, Engineering, Evaluate, Flow, Flowchart, Graphic, Idea, Iterative, Lifecycle, Management, Marble, Method, Model, Process, Quality, Red, Research, Schema, Software, Spiral, Step, Strategy, Success, System. The prominent colors used in the PowerPoint template are White, Pink, Gray. The feedback we get is that our 6 steps converging arrows to center point Cycle Diagram PowerPoint templates are Perfect. People tell us our Control PowerPoint templates and PPT Slides help you meet deadlines which are an element of today's workplace. Just browse and pick the slides that appeal to your intuitive senses. Presenters tell us our 6 steps converging arrows to center point Cycle Diagram PowerPoint templates are Graceful. Use our Chart PowerPoint templates and PPT Slides are the best it can get when it comes to presenting. Use our 6 steps converging arrows to center point Cycle Diagram PowerPoint templates are the best it can get when it comes to presenting. Use our Chart PowerPoint templates and PPT Slides are Bright. Figure on our 6 Steps Converging Arrows To Center Point Cycle Diagram PowerPoint Templates for their expertise. They will prove their fibre again and again.
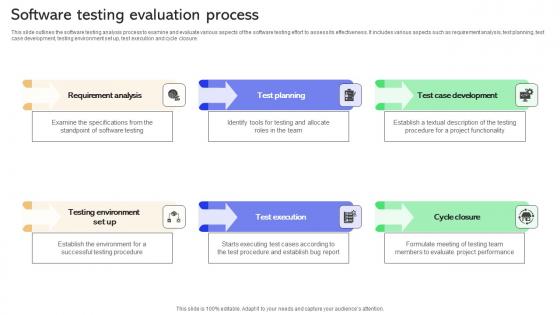
Software Testing Evaluation Process Ppt Portfolio Format Ideas Pdf
This slide outlines the software testing analysis process to examine and evaluate various aspects of the software testing effort to assess its effectiveness. It includes various aspects such as requirement analysis, test planning, test case development, testing environment set up, test execution and cycle closure. Showcasing this set of slides titled Software Testing Evaluation Process Ppt Portfolio Format Ideas Pdf. The topics addressed in these templates are Requirement Analysis, Test Planning, Test Case Development. All the content presented in this PPT design is completely editable. Download it and make adjustments in color, background, font etc. as per your unique business setting. This slide outlines the software testing analysis process to examine and evaluate various aspects of the software testing effort to assess its effectiveness. It includes various aspects such as requirement analysis,test planning,test case development,testing environment set up,test execution and cycle closure.
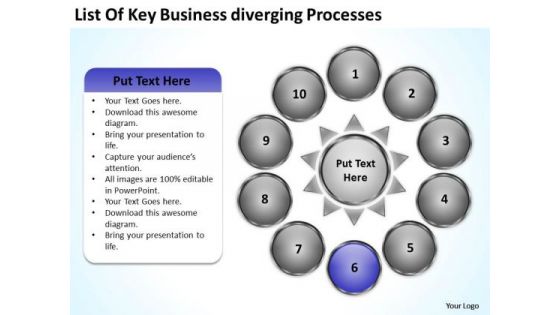
PowerPoint Templates Download Diverging Processes Chart Circular Flow Diagram
We present our powerpoint templates download diverging processes chart Circular Flow Diagram.Use our Success PowerPoint Templates because iT outlines the entire thought process for the benefit of others. Tell it to the world with your characteristic aplomb. Download and present our Arrows PowerPoint Templates because Our PowerPoint Templates and Slides has conjured up a web of all you need with the help of our great team. Use them to string together your glistening ideas. Download and present our Flow charts PowerPoint Templates because you have built your business strategy brick by brick. Download and present our Signs PowerPoint Templates because you understand the illness and its causes. Download and present our Process and Flows PowerPoint Templates because you have imbibed from this fountain of ideas and developed some worthwhile views.Use these PowerPoint slides for presentations relating to Chart, check,circle, concept, control, cycle, design,development, diagram, do, engineering,evaluate, flow, flow,chart, flowchart,graphic, green, idea, infographic,iterative, life, lifecycle, lifecycle,management, method, model, pdca,plan, plan,dcheckact, process, quality,red, research, schema, software, spiral,step, strategy, success, white, work . The prominent colors used in the PowerPoint template are Blue, Black, Gray. People tell us our powerpoint templates download diverging processes chart Circular Flow Diagram are Classic. Customers tell us our circle PowerPoint templates and PPT Slides will generate and maintain the level of interest you desire. They will create the impression you want to imprint on your audience. Professionals tell us our powerpoint templates download diverging processes chart Circular Flow Diagram are Youthful. Presenters tell us our concept PowerPoint templates and PPT Slides are specially created by a professional team with vast experience. They diligently strive to come up with the right vehicle for your brilliant Ideas. Use our powerpoint templates download diverging processes chart Circular Flow Diagram are Ritzy. Presenters tell us our control PowerPoint templates and PPT Slides are specially created by a professional team with vast experience. They diligently strive to come up with the right vehicle for your brilliant Ideas. They say appropriate facial expressions aid communication. Our PowerPoint Templates Download Diverging Processes Chart Circular Flow Diagram can be effective too.
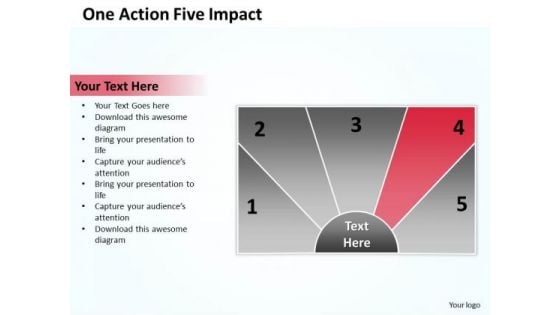
Business Process Workflow Diagram One Action Five Impact PowerPoint Slides
We present our business process workflow diagram one action five impact PowerPoint Slides.Use our Advertising PowerPoint Templates because Our PowerPoint Templates and Slides are aesthetically designed to attract attention. We gaurantee that they will grab all the eyeballs you need. Download our Business PowerPoint Templates because Our PowerPoint Templates and Slides will provide you the cutting edge. Slice through the doubts in the minds of your listeners. Download and present our Shapes PowerPoint Templates because Our PowerPoint Templates and Slides help you pinpoint your timelines. Highlight the reasons for your deadlines with their use. Use our Process and Flows PowerPoint Templates because you can Break through with our PowerPoint Templates and Slides. Bring down the mental barriers of your audience. Use our Metaphors-Visual Concepts PowerPoint Templates because You can Inspire your team with our PowerPoint Templates and Slides. Let the force of your ideas flow into their minds.Use these PowerPoint slides for presentations relating to Act, arrow, business, chart, check, circle, circular, cycle, deming, development, diagram, do, engineering, flow, flow-chart, flowchart, graphic, infographic, iterative, life, life-cycle, lifecycle, management, model, pdca, pdsa, plan, process, quality, red, software, step, strategy, work, work-flow, workflow\n. The prominent colors used in the PowerPoint template are Red, Black, Gray. The feedback we get is that our business process workflow diagram one action five impact PowerPoint Slides will make the presenter successul in his career/life. The feedback we get is that our circular PowerPoint templates and PPT Slides are topically designed to provide an attractive backdrop to any subject. Professionals tell us our business process workflow diagram one action five impact PowerPoint Slides are aesthetically designed to attract attention. We guarantee that they will grab all the eyeballs you need. Professionals tell us our cycle PowerPoint templates and PPT Slides will make the presenter look like a pro even if they are not computer savvy. Presenters tell us our business process workflow diagram one action five impact PowerPoint Slides will generate and maintain the level of interest you desire. They will create the impression you want to imprint on your audience. You can be sure our circle PowerPoint templates and PPT Slides are effectively colour coded to prioritise your plans They automatically highlight the sequence of events you desire. Make use of the facilities our Business Process Workflow Diagram One Action Five Impact PowerPoint Slides offer. You will be delighted with the choices available.
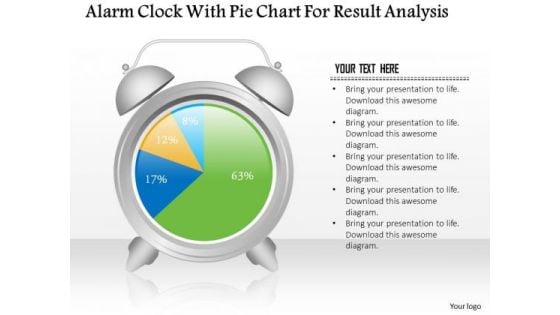
Business Diagram Alarm Clock With Pie Chart For Result Analysis PowerPoint Slide
This business slide displays alarm clock with pie chart. This diagram is a data visualization tool that gives you a simple way to present statistical information. This slide helps your audience examine and interpret the data you present.
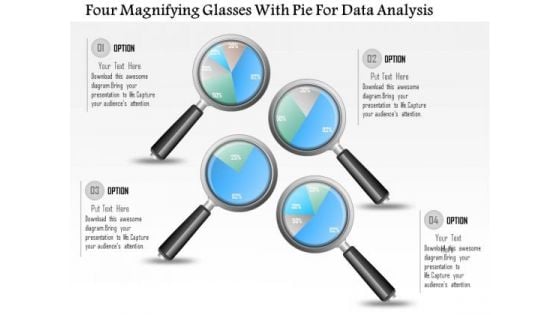
Business Diagram Four Magnifying Glasses With Pie For Data Analysis PowerPoint Slide
This business diagram displays graphic of pie charts in shape of magnifying glasses This business slide is suitable to present and compare business data. Use this diagram to build professional presentations for your viewers.

Business Diagram Four Pie Chart For Data Driven Result Analysis Of Business PowerPoint Slide
This business diagram displays graphic of pie charts in shape of flasks. This business slide is suitable to present and compare business data. Use this diagram to build professional presentations for your viewers.
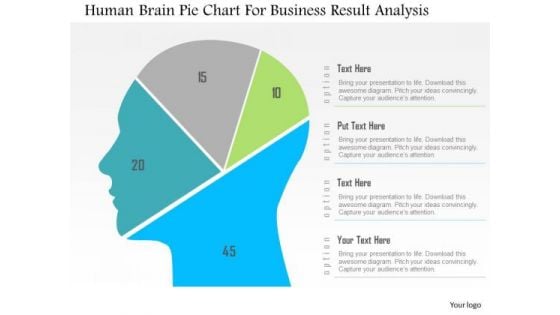
Business Diagram Human Brain Pie Chart For Business Result Analysis PowerPoint Slide
This diagram displays human face graphic divided into sections. This section can be used for data display. Use this diagram to build professional presentations for your viewers.
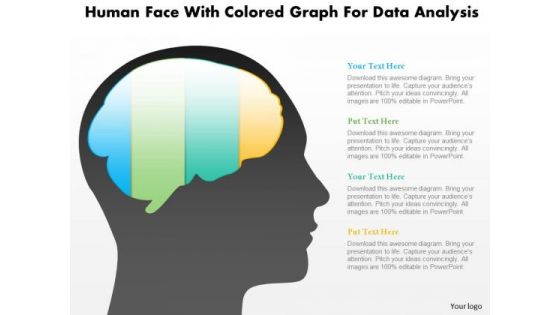
Business Diagram Human Face With Colored Graph For Data Analysis PowerPoint Slide
This diagram displays human face graphic with colored graph. This diagram can be used to represent strategy, planning, thinking of business plan. Display business options in your presentations by using this creative diagram.

Incorporating Real Time Marketing For Improved Consumer A B Test Email Promotional Content Brochure PDF
The following slide illustrates some practices to check email campaign content to generate best results and improve clicks. It includes elements such as testing subject line, reviewing senders name, images, pre-header etc. Create an editable Incorporating Real Time Marketing For Improved Consumer A B Test Email Promotional Content Brochure PDF that communicates your idea and engages your audience. Whether youre presenting a business or an educational presentation, pre designed presentation templates help save time. Incorporating Real Time Marketing For Improved Consumer A B Test Email Promotional Content Brochure PDF is highly customizable and very easy to edit, covering many different styles from creative to business presentations. Slidegeeks has creative team members who have crafted amazing templates. So, go and get them without any delay.
Excellent Certification Using Resort Marketing Plan Icon Ideas Pdf
Showcasing this set of slides titled Excellent Certification Using Resort Marketing Plan Icon Ideas Pdf The topics addressed in these templates are Excellent Certification Using,Resort Marketing Plan Icon All the content presented in this PPT design is completely editable. Download it and make adjustments in color, background, font etc. as per your unique business setting. Our Excellent Certification Using Resort Marketing Plan Icon Ideas Pdf are topically designed to provide an attractive backdrop to any subject. Use them to look like a presentation pro.
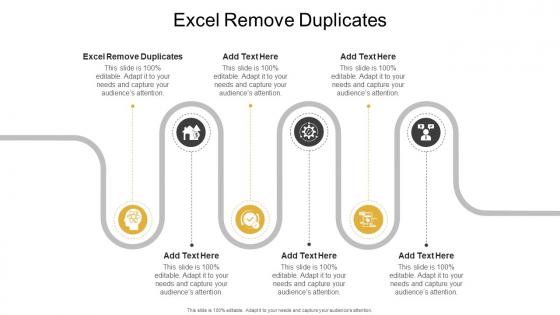
Excel Remove Duplicates In Powerpoint And Google Slides Cpb
Presenting our innovatively-designed set of slides titled Excel Remove Duplicates In Powerpoint And Google Slides Cpb. This completely editable PowerPoint graphic exhibits Excel Remove Duplicates that will help you convey the message impactfully. It can be accessed with Google Slides and is available in both standard screen and widescreen aspect ratios. Apart from this, you can download this well-structured PowerPoint template design in different formats like PDF, JPG, and PNG. So, click the download button now to gain full access to this PPT design. Our Excel Remove Duplicates In Powerpoint And Google Slides Cpb are topically designed to provide an attractive backdrop to any subject. Use them to look like a presentation pro.

Business Diagram Extract Transform Load Etl Business Intelligence Bug Data Analysis Pipeline Ppt Sli
This PowerPoint template has been designed with graphic of server. This diagram depicts the concept of ETL business intelligence with extract transform load. This slide also helps to display the data analysis pipeline.
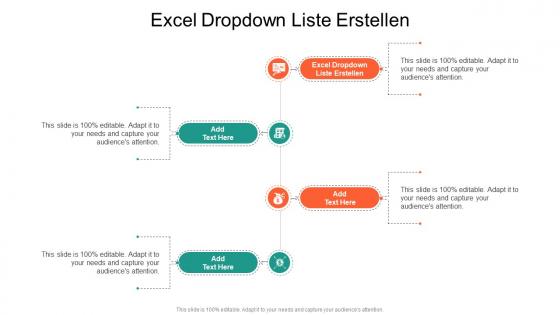
Excel Dropdown Liste Erstellen In Powerpoint And Google Slides Cpb
Presenting our innovatively-designed set of slides titled Excel Dropdown Liste Erstellen In Powerpoint And Google Slides Cpb. This completely editable PowerPoint graphic exhibits Excel Dropdown Liste Erstellen that will help you convey the message impactfully. It can be accessed with Google Slides and is available in both standard screen and widescreen aspect ratios. Apart from this, you can download this well-structured PowerPoint template design in different formats like PDF, JPG, and PNG. So, click the download button now to gain full access to this PPT design. Our Excel Dropdown Liste Erstellen In Powerpoint And Google Slides Cpb are topically designed to provide an attractive backdrop to any subject. Use them to look like a presentation pro.
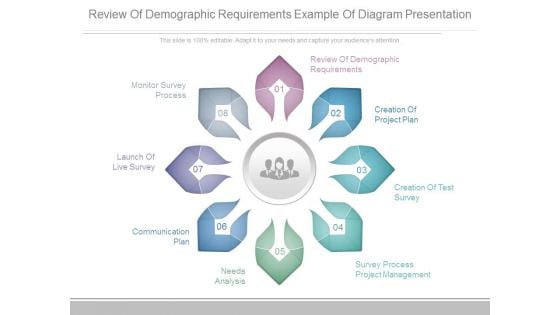
Review Of Demographic Requirements Example Of Diagram Presentation
This is a review of demographic requirements example of diagram presentation. This is a eight stage process. The stages in this process are monitor survey process, review of demographic requirements, creation of project plan, creation of test survey, survey process project management, needs analysis, communication plan.
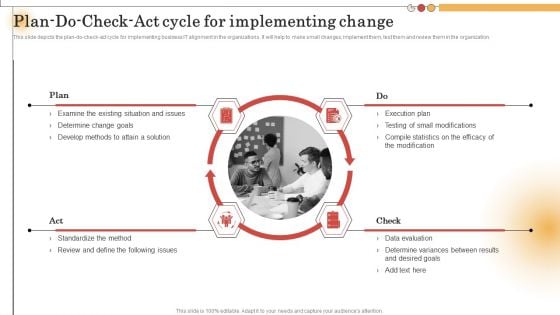
IT Alignment For Strategic Plan Do Check Act Cycle For Implementing Change Pictures PDF
This slide depicts the plan-do-check-act cycle for implementing business IT alignment in the organizations. It will help to make small changes, implement them, test them and review them in the organization. There are so many reasons you need a IT Alignment For Strategic Plan Do Check Act Cycle For Implementing Change Pictures PDF. The first reason is you can not spend time making everything from scratch, Thus, Slidegeeks has made presentation templates for you too. You can easily download these templates from our website easily.
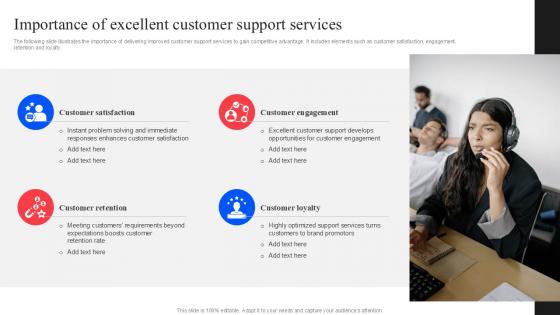
Importance Of Excellent Improving Customer Retention PPT PowerPoint
The following slide illustrates the importance of delivering improved customer support services to gain competitive advantage. It includes elements such as customer satisfaction, engagement, retention and loyalty. Make sure to capture your audiences attention in your business displays with our gratis customizable Importance Of Excellent Improving Customer Retention PPT PowerPoint. These are great for business strategies, office conferences, capital raising or task suggestions. If you desire to acquire more customers for your tech business and ensure they stay satisfied, create your own sales presentation with these plain slides. The following slide illustrates the importance of delivering improved customer support services to gain competitive advantage. It includes elements such as customer satisfaction, engagement, retention and loyalty.

Benefits Of Regression Testing Scaling Up Smoke Testing Ppt Slides
This slide represents the advantages for scaling up of regression testing. The main purpose of this slide is to showcase the benefits such as saving time, avoiding defect bug leakage in later stages, and so on. If your project calls for a presentation, then Slidegeeks is your go-to partner because we have professionally designed, easy-to-edit templates that are perfect for any presentation. After downloading, you can easily edit Benefits Of Regression Testing Scaling Up Smoke Testing Ppt Slides and make the changes accordingly. You can rearrange slides or fill them with different images. Check out all the handy templates This slide represents the advantages for scaling up of regression testing. The main purpose of this slide is to showcase the benefits such as saving time, avoiding defect bug leakage in later stages, and so on.

Steps For Performing Automated Regression Testing Corrective Regression Testing Ppt Powerpoint
This slide highlights the steps for executing automated regression testing. The steps include checking all requirement, testing all the new modules, identifying cases, converting into scripts, and so on. Welcome to our selection of the Steps For Performing Automated Regression Testing Corrective Regression Testing Ppt Powerpoint These are designed to help you showcase your creativity and bring your sphere to life. Planning and Innovation are essential for any business that is just starting out. This collection contains the designs that you need for your everyday presentations. All of our PowerPoints are 100Percent editable, so you can customize them to suit your needs. This multi-purpose template can be used in various situations. Grab these presentation templates today. This slide highlights the steps for executing automated regression testing. The steps include checking all requirement, testing all the new modules, identifying cases, converting into scripts, and so on.


 Continue with Email

 Home
Home


