Quantitative Risk Analysis

Magnifying Glass Testing Ppt PowerPoint Presentation Infographics Layout Ideas
This is a magnifying glass testing ppt powerpoint presentation infographics layout ideas. This is a five stage process. The stages in this process are technology, icons, strategy, analysis, marketing.
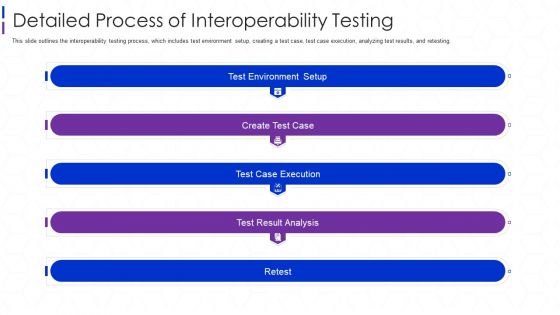
Software Interoperability Examination IT Detailed Process Of Interoperability Testing Infographics PDF
Deliver an awe inspiring pitch with this creative software interoperability examination it detailed process of interoperability testing infographics pdf bundle. Topics like environment, analysis, execution can be discussed with this completely editable template. It is available for immediate download depending on the needs and requirements of the user.
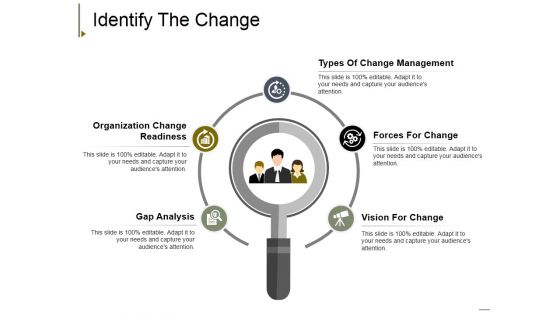
Identify The Change Ppt PowerPoint Presentation Slides Elements
This is a identify the change ppt powerpoint presentation slides elements. This is a five stage process. The stages in this process are types of change management, organization change readiness, gap analysis, forces for change, vision for change.
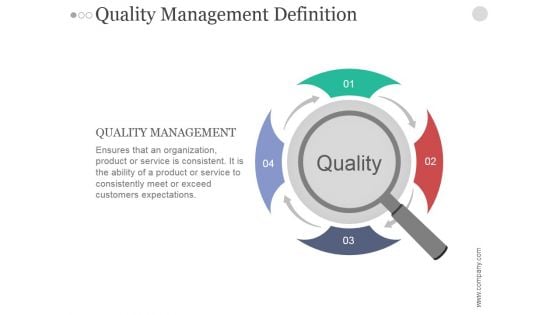
Quality Management Definition Ppt PowerPoint Presentation Designs
This is a quality management definition ppt powerpoint presentation designs. This is a four stage process. The Stages in this process are quality management, process, magnifier, search, analysis, business.
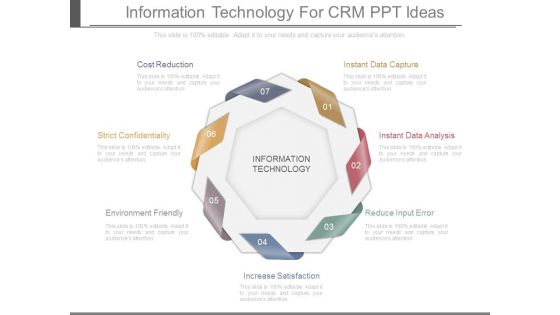
Information Technology For Crm Ppt Ideas
This is a information technology for crm ppt ideas. This is a seven stage process. The stages in this process are cost reduction, strict confidentiality, environment friendly, instant data capture, instant data analysis, reduce input error, increase satisfaction, information technology.
Data Mining Vector Icon Ppt PowerPoint Presentation Images
This is a data mining vector icon ppt powerpoint presentation images. This is a one stage process. The stages in this process are data, analysis, data science, information science.
Data Storage Management Icon Ppt PowerPoint Presentation Ideas Files
This is a data storage management icon ppt powerpoint presentation ideas files. This is a four stage process. The stages in this process are data, analysis, data science, information science.
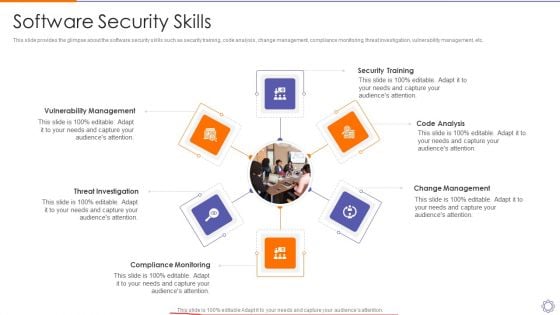
Devops Engineer Capabilities Software Security Skills Ppt Slides Graphics Template PDF
This slide provides the glimpse about the software security skills such as security training, code analysis, change management, compliance monitoring, threat investigation, vulnerability management, etc. This is a devops engineer capabilities software security skills ppt slides graphics template pdf template with various stages. Focus and dispense information on six stages using this creative set, that comes with editable features. It contains large content boxes to add your information on topics like vulnerability management, threat investigation, compliance monitoring, security training, code analysis. You can also showcase facts, figures, and other relevant content using this PPT layout. Grab it now.
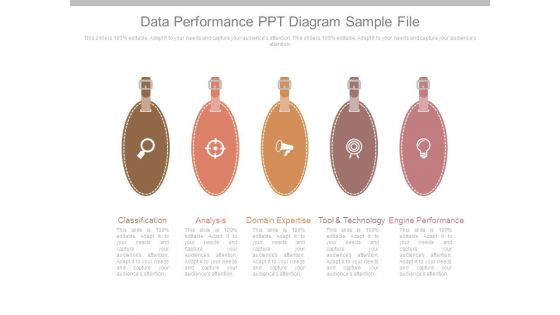
Data Performance Ppt Diagram Sample File
This is a data performance ppt diagram sample file. This is a five stage process. The stages in this process are classification, analysis, domain expertise, tool and technology, engine performance.
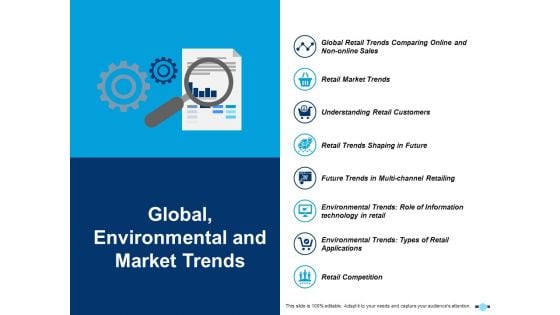
Global Environmental And Market Trends Retail Market Trends Ppt PowerPoint Presentation Styles Information
This is a global environmental and market trends retail market trends ppt powerpoint presentation styles information. This is a eight stage process. The stages in this process are icons, management, strategy, analysis, marketing.
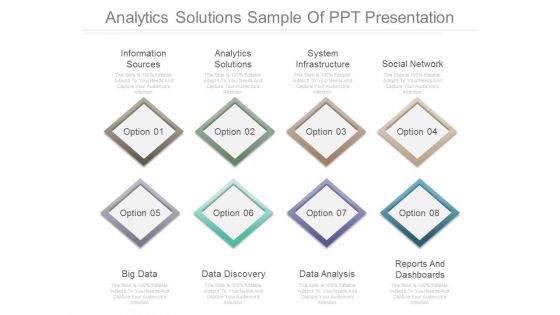
Analytics Solutions Sample Of Ppt Presentation
This is a analytics solutions sample of ppt presentation. This is a eight stage process. The stages in this process are information sources, analytics solutions, system infrastructure, social network, big data, data discovery, data analysis, reports and dashboards.

Accounting And Information Technology Ppt Summary
This is a accounting and information technology ppt summary. This is a ten stage process. The stages in this process are cash receipts, purchases, payroll, documents, taxes, accounting system, business cards, timekeeping, sales analysis, billing, receipts.
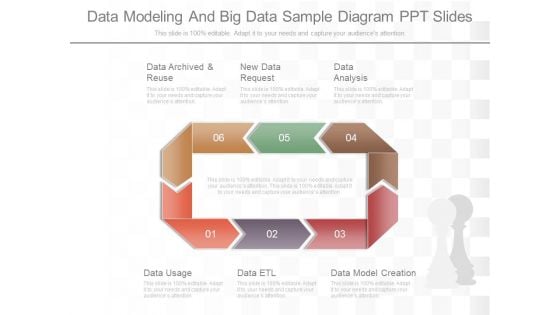
Data Modeling And Big Data Sample Diagram Ppt Slides
This is a data modeling and big data sample diagram ppt slides. This is a six stage process. The stages in this process are data archived and reuse, new data request, data analysis, data usage, data etl, data model creation.
Examining The Industry Environment Of Company Table Of Contents Ppt Infographic Template Icons PDF
Presenting this set of slides with name examining the industry environment of company table of contents ppt infographic template icons pdf. This is a twelve stage process. The stages in this process are mitigation, plan, geographical, analysis, industry. This is a completely editable PowerPoint presentation and is available for immediate download. Download now and impress your audience.
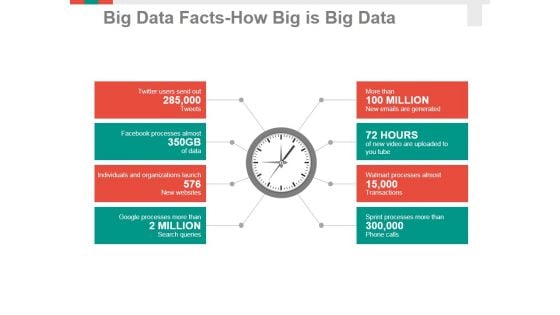
Big Data Facts How Big Is Big Data Ppt PowerPoint Presentation Professional Information
This is a big data facts how big is big data ppt powerpoint presentation professional information. This is a eight stage process. The stages in this process are business, management, strategy, measure, analysis.
Data Algorithm And Storage Management Ppt PowerPoint Presentation Icon Background Images
This is a data algorithm and storage management ppt powerpoint presentation icon background images. This is a four stage process. The stages in this process are data, analysis, data science, information science.
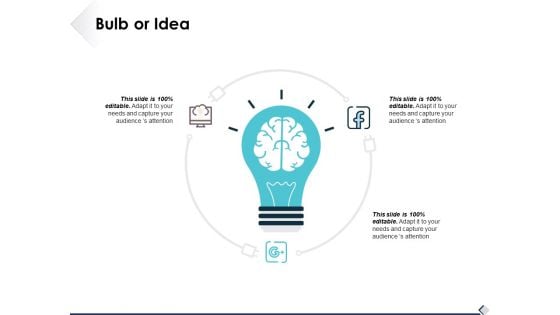
Bulb Or Idea Technology Strategy Ppt PowerPoint Presentation Gallery Deck
This is a bulb or idea technology strategy ppt powerpoint presentation gallery deck. This is a three stage process. The stages in this process are technology, business, management, strategy, analysis.
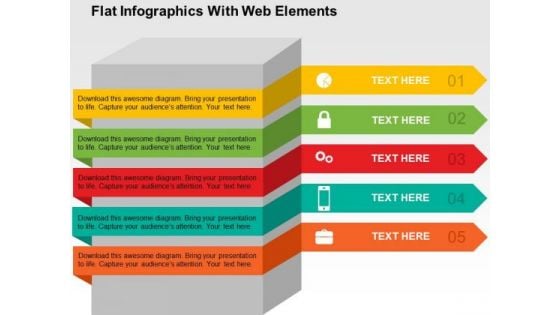
Flat Infographics With Web Elements PowerPoint Templates
Use this diagram of flat Infographics to illustrate business processes. This web elements diagram may also be used to display flow of business steps. This slide is designed to attract the attention of your audience towards business process analysis.
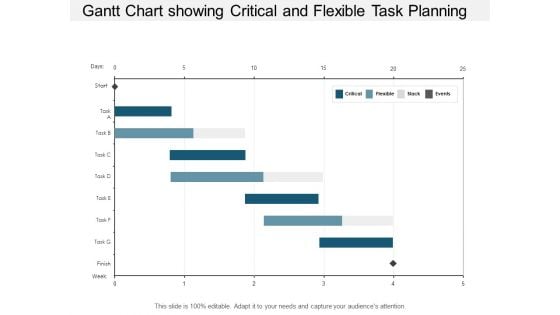
Gantt Chart Showing Critical And Flexible Task Planning Ppt PowerPoint Presentation Model Shapes
This is a gantt chart showing critical and flexible task planning ppt powerpoint presentation model shapes. The topics discussed in this diagram are critical path method, critical path analysis, cpm. This is a completely editable PowerPoint presentation, and is available for immediate download.
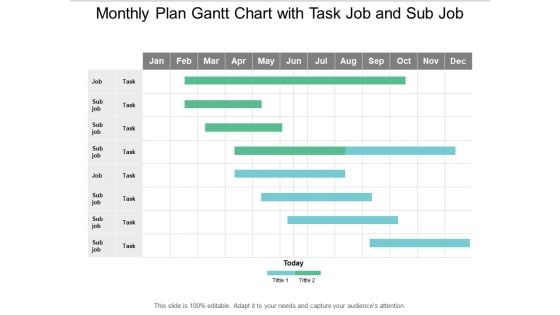
Monthly Plan Gantt Chart With Task Job And Sub Job Ppt PowerPoint Presentation Infographic Template Mockup
This is a monthly plan gantt chart with task job and sub job ppt powerpoint presentation infographic template mockup. The topics discussed in this diagram are critical path method, critical path analysis, cpm. This is a completely editable PowerPoint presentation, and is available for immediate download.
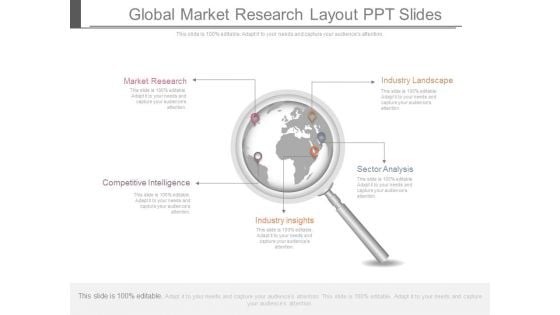
Global Market Research Layout Ppt Slides
This is a global market research layout ppt slides. This is a five stage process. The stages in this process are market research, industry landscape, competitive intelligence, sector analysis, industry insights.
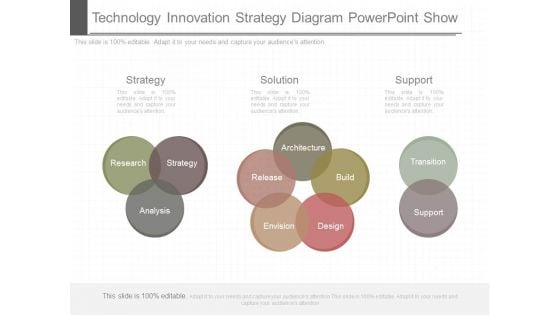
Technology Innovation Strategy Diagram Powerpoint Show
This is a technology innovation strategy diagram powerpoint show. This is a three stage process. The stages in this process are strategy, solution, support, research, strategy, analysis, architecture, release, build, envision, design, transition, support.
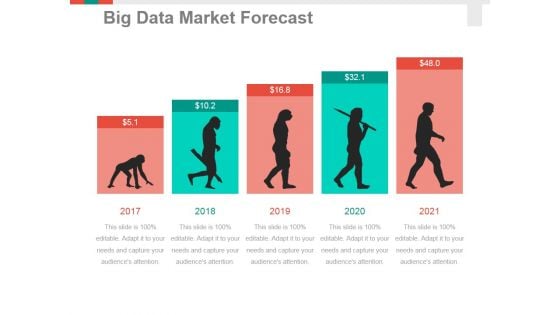
Big Data Market Forecast Ppt PowerPoint Presentation Portfolio Inspiration
This is a big data market forecast ppt powerpoint presentation portfolio inspiration. This is a five stage process. The stages in this process are business, growth, analysis, strategy, success.
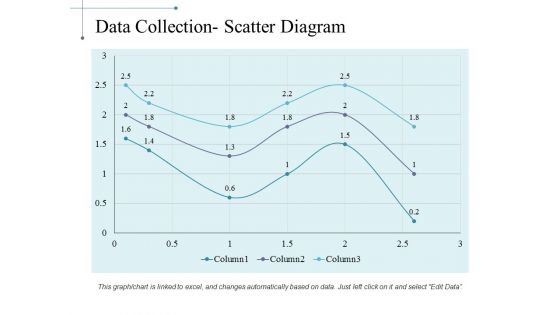
Data Collection Scatter Diagram Ppt PowerPoint Presentation Summary Deck
This is a data collection scatter diagram ppt powerpoint presentation summary deck. This is a three stage process. The stages in this process are business, marketing, strategy, finance, analysis.
Data Collection Histograms Ppt PowerPoint Presentation Icon Slides
This is a data collection histograms ppt powerpoint presentation icon slides. This is a two stage process. The stages in this process are bar chart, finance, marketing, business, analysis.
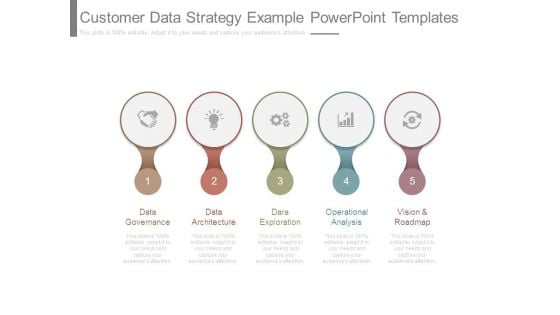
Customer Data Strategy Example Powerpoint Templates
This is a customer data strategy example powerpoint templates. This is a five stage process. The stages in this process are data governance, data architecture, data exploration, operational analysis, vision and roadmap.
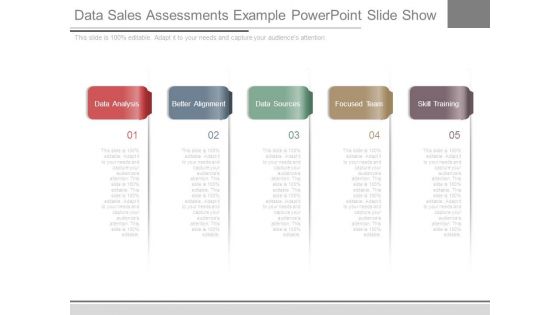
Data Sales Assessments Example Powerpoint Slide Show
This is a data sales assessments example powerpoint slide show. This is a five stage process. The stages in this process are data analysis, better alignment, data sources, focused team, skill training.
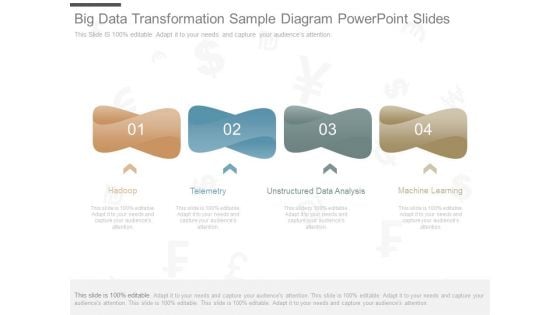
Big Data Transformation Sample Diagram Powerpoint Slides
This is a big data transformation sample diagram powerpoint slides. This is a four stage process. The stages in this process are hadoop, telemetry, unstructured data analysis, machine learning.

Strategic Data Management Template Powerpoint Slide Show
This is a strategic data management template powerpoint slide show. This is a six stage process. The stages in this process are research, analysis, execution and deployment, quality and monitoring, coding, data entry.
Three Staged Square Step Diagram And Icons Powerpoint Template
Graphic square step with icons has been used to design this business diagram. This diagram slide may be used to depict order of business steps. Download this diagram for business research and analysis.
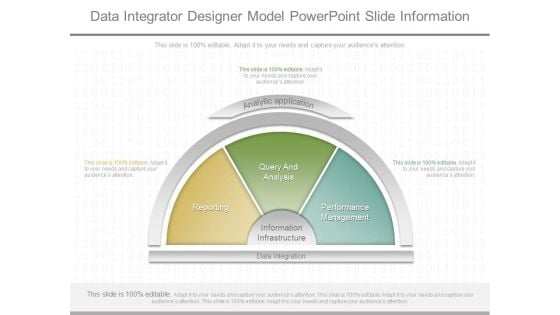
Data Integrator Designer Model Powerpoint Slide Information
This is a data integrator designer model powerpoint slide information. This is a three stage process. The stages in this process are reporting, query and analysis, performance management, analytic application, information infrastructure.
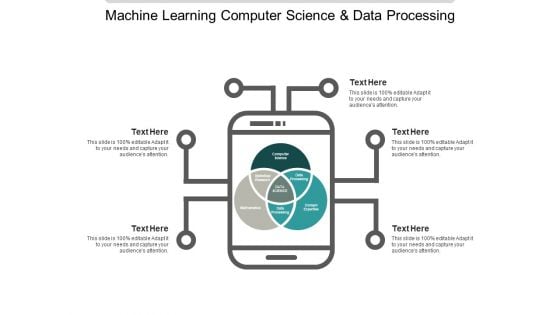
Machine Learning Computer Science And Data Processing Ppt PowerPoint Presentation Show Slideshow
This is a machine learning computer science and data processing ppt powerpoint presentation show slideshow. This is a three stage process. The stages in this process are data, analysis, data science, information science.
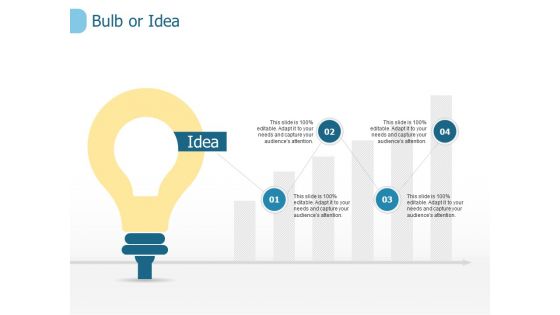
Bulb Or Idea Technology Ppt PowerPoint Presentation Model Elements
This is a bulb or idea technology ppt powerpoint presentation model elements. The topics discussed in this diagram are finance, marketing, analysis, investment, management. This is a completely editable PowerPoint presentation, and is available for immediate download.
Bulb And Idea Icon Technology Ppt PowerPoint Presentation Infographics Background Image
This is a bulb and idea icon technology ppt powerpoint presentation infographics background image. This is a seven stage process. The stages in this process are technology, business, management, strategy, analysis.
Idea Or Blub Technology Marketing Icon Ppt PowerPoint Presentation Icon Guide
This is a idea or blub technology marketing icon ppt powerpoint presentation icon guide. This is a five stage process. The stages in this process are technology, business, management, strategy, analysis.

Customer Feedback Benchmark Data Powerpoint Layout
This is a customer feedback benchmark data powerpoint layout. This is a seven stage process. The stages in this process are customer feedback, benchmark data, competitive analysis, market forces, usage statistics, customer need, current capability.
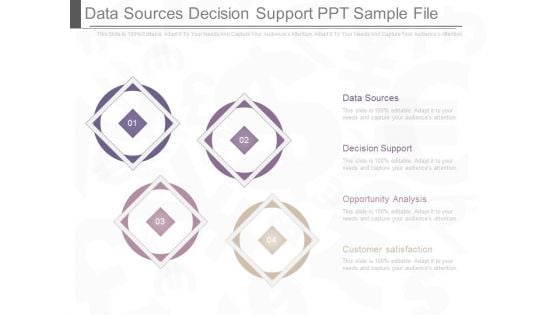
Data Sources Decision Support Ppt Sample File
This is a data sources decision support ppt sample file. This is a four stage process. The stages in this process are data sources, decision support, opportunity analysis, customer satisfaction.
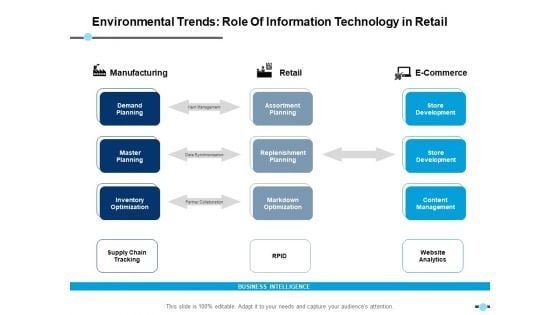
Environmental Trends Role Of Information Technology In Retail Manufacturing Ppt PowerPoint Presentation Example
This is a environmental trends role of information technology in retail manufacturing ppt powerpoint presentation example. This is a three stage process. The stages in this process are business, management, strategy, analysis, marketing.
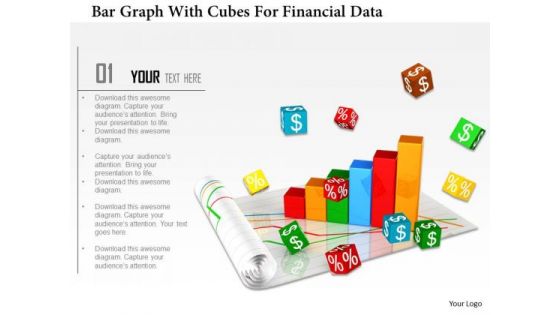
Stock Photo Bar Graph With Cubes For Financial Data PowerPoint Slide
Graphic of bar graph and cubes are used to decorate this image template. This PPT contains the concept of financial data analysis. Use this PPT for finance and business related presentations.
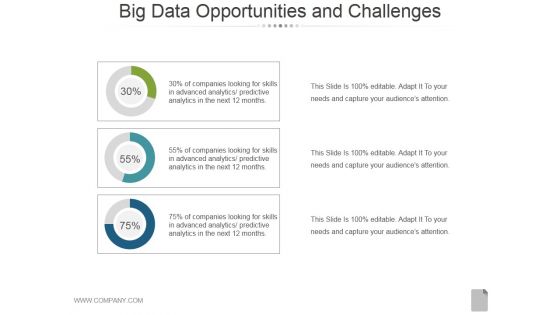
Big Data Opportunities And Challenges Template 2 Ppt PowerPoint Presentation Summary
This is a big data opportunities and challenges template 2 ppt powerpoint presentation summary. This is a three stage process. The stages in this process are business, donut, marketing, finance, strategy, analysis, success.
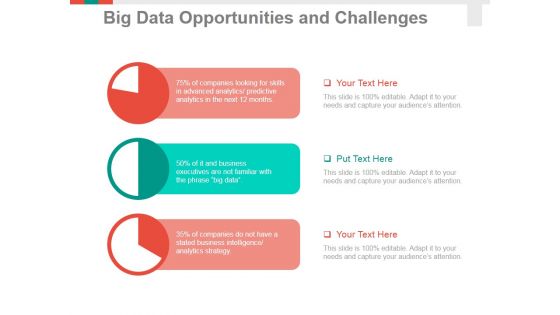
Big Data Opportunities And Challenges Template 1 Ppt PowerPoint Presentation Infographic Template Summary
This is a big data opportunities and challenges template 1 ppt powerpoint presentation infographic template summary. This is a three stage process. The stages in this process are business, pie chart, finance, marketing, analysis, strategy.
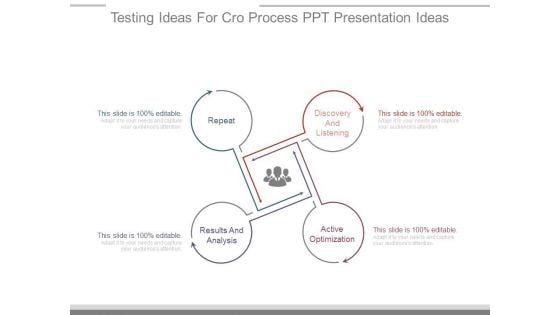
Testing Ideas For Cro Process Ppt Presentation Ideas
This is a testing ideas for cro process ppt presentation ideas. This is a four stage process. The stages in this process are discovery and listening, active optimization, results and analysis, repeat.
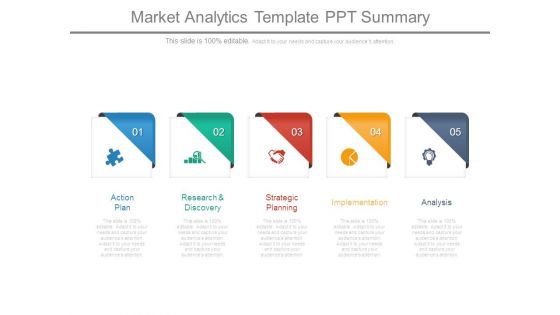
Market Analytics Template Ppt Summary
This is a market analytics template ppt summary. This is a five stage process. The stages in this process are action plan, research and discovery, strategic planning, implementation, analysis.
Data Engineering Vector Icons Ppt PowerPoint Presentation Model Graphic Images
This is a data engineering vector icons ppt powerpoint presentation model graphic images. This is a three stage process. The stages in this process are data, analysis, data science, information science.
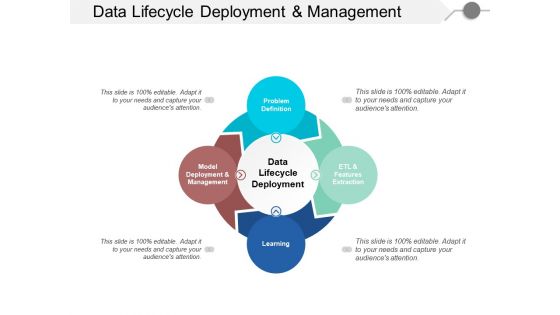
Data Lifecycle Deployment And Management Ppt PowerPoint Presentation File Formats
This is a data lifecycle deployment and management ppt powerpoint presentation file formats. This is a four stage process. The stages in this process are data, analysis, data science, information science.
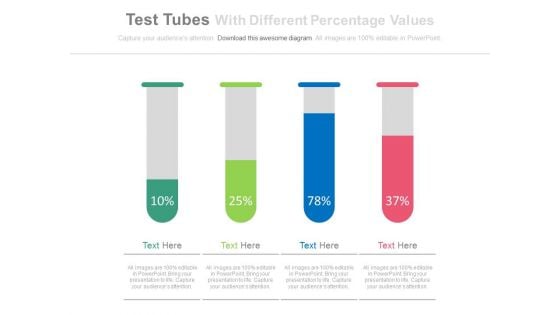
Test Tubes With Percentage Data For Comparison Powerpoint Slides
This PowerPoint template has been designed with test tubes and percentage data. You may download this PPT slide to display data comparison and analysis. Add this slide to your presentation and impress your superiors.
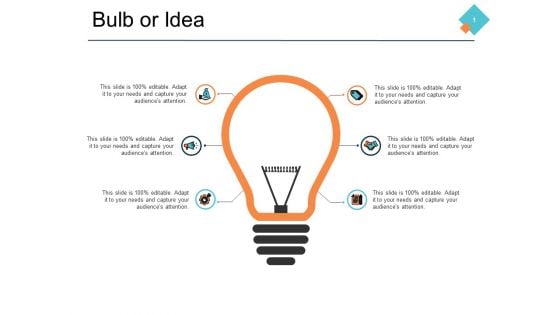
Bulb Or Idea Technology Process Ppt PowerPoint Presentation Portfolio Show
This is a bulb or idea technology process ppt powerpoint presentation portfolio show. This is a six stage process. The stages in this process are technology, management, strategy, analysis, marketing.
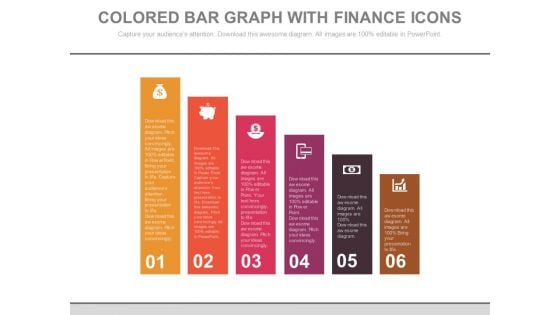
Bar Graph For Marketing Research Data Powerpoint Slides
This PowerPoint template has been designed with diagram of bar graph. This PPT slide can be used to prepare presentations for profit growth report and also for financial data analysis. You can download finance PowerPoint template to prepare awesome presentations.
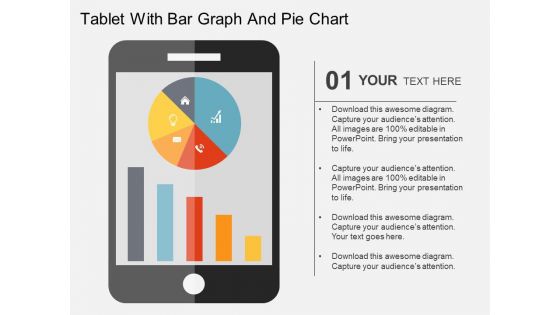
Tablet With Bar Graph And Pie Chart Powerpoint Templates
This business slide has been designed with business graphs on computer tablet. You may download this PPT slide to display statistical analysis. This slide will help you to sequence your thoughts.
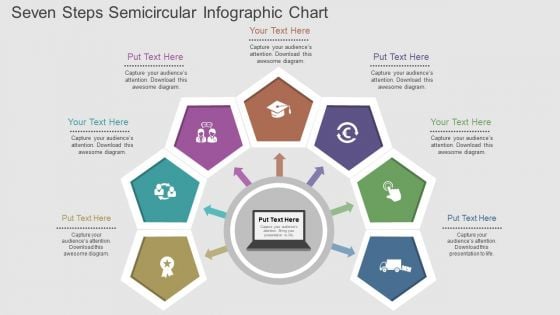
Seven Steps Semicircular Infographic Chart Powerpoint Template
This business slide contains four option banners with business icons. This PPT diagram is suitable to present concept of profit growth value analysis. Visual effect of this diagram provides more clarity to the subject.
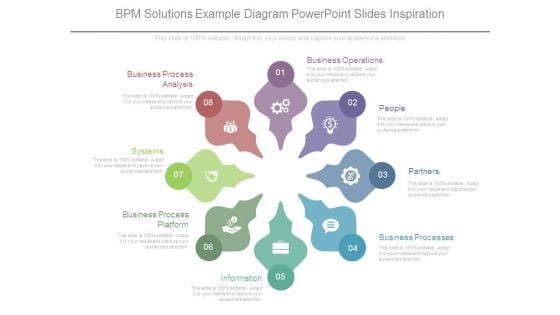
Bpm Solutions Example Diagram Powerpoint Slides Inspiration
This is a bpm solutions example diagram powerpoint slides inspiration. This is a eight stage process. The stages in this process are business process analysis, systems, business process platform, information, business processes, partners, people, business operations.
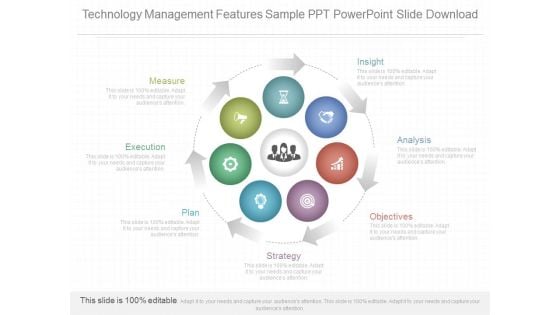
Technology Management Features Sample Ppt Powerpoint Slide Download
This is a technology management features sample ppt powerpoint slide download. This is a seven stage process. The stages in this process are insight, analysis, objectives, strategy, plan, execution, measure.
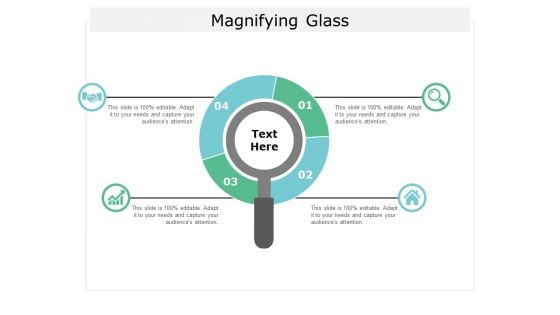
Magnifying Glass Technology Ppt Powerpoint Presentation Infographic Template Background Designs
This is a magnifying glass technology ppt powerpoint presentation infographic template background designs. This is a four stage process. The stages in this process are finance, marketing, analysis, investment, strategy.
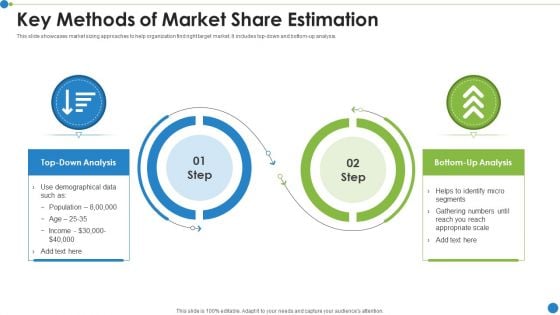
Key Methods Of Market Share Estimation Ppt PowerPoint Presentation File Slides PDF
This slide showcases market sizing approaches to help organization find right target market. It includes top-down and bottom up analysis. Presenting key methods of market share estimation ppt powerpoint presentation file slides pdf to dispense important information. This template comprises two stages. It also presents valuable insights into the topics including analysis, demographical. This is a completely customizable PowerPoint theme that can be put to use immediately. So, download it and address the topic impactfully.
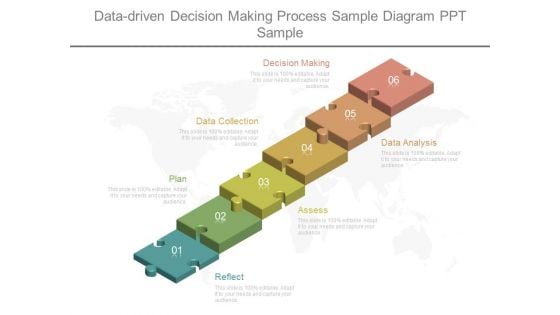
Data Driven Decision Making Process Sample Diagram Ppt Sample
This is a data driven decision making process sample diagram ppt sample. This is a six stage process. The stages in this process are decision making, data collection, plan, reflect, assess, data analysis.
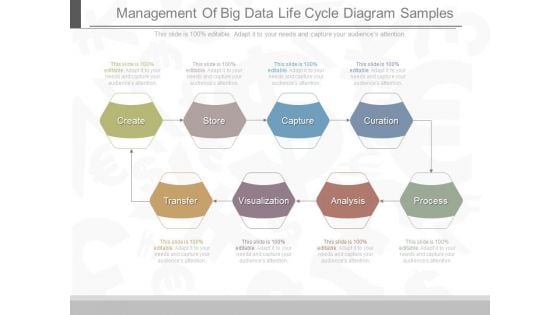
Management Of Big Data Life Cycle Diagram Samples
This is a management of big data life cycle diagram samples. This is a eight stage process. The stages in this process are create, store, capture, curation, transfer, visualization, analysis, process.
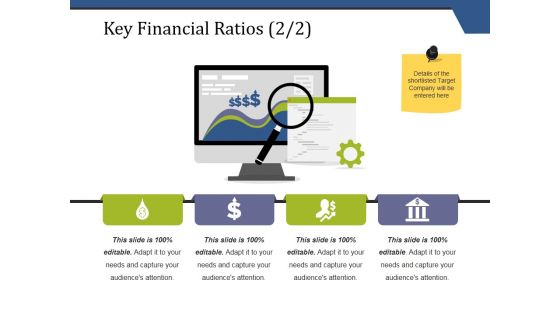
Key Financial Ratios Template 2 Ppt PowerPoint Presentation Pictures Styles
This is a key financial ratios template 2 ppt powerpoint presentation pictures styles. This is a four stage process. The stages in this process are business, finance, analysis, computer, technology, knowledge.
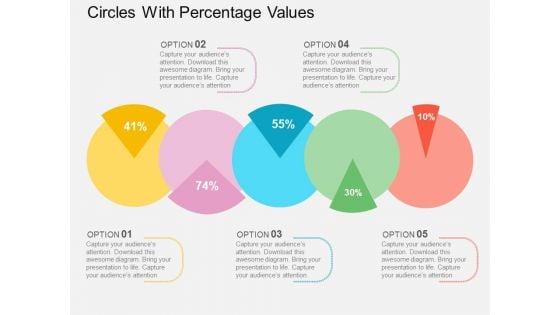
Circles With Percentage Values Powerpoint Templates
This PowerPoint template displays circles with percentage values. This business diagram is suitable for financial data analysis. Use this business diagram slide to highlight the key issues of your presentation.
Four Circles Venn Diagram With Icons Powerpoint Slides
Four circles Venn diagram has been used to design this power point template. This PPT helps to portray the concept of business data analysis. Use this PPT for your business and marketing related presentations.
Two Circles Venn Diagram With Icons Powerpoint Slides
Venn diagram of two circles has been used to design this power point template. This PPT helps to portray the concept of business data analysis. Use this PPT for your business and marketing related presentations.


 Continue with Email

 Home
Home


