Quantitative Techniques
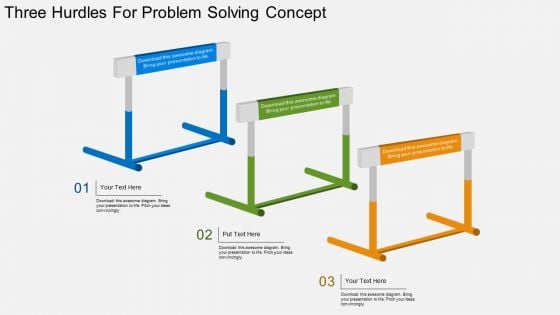
Three Hurdles For Problem Solving Concept Powerpoint Template
This PowerPoint template has been designed with graphics of three hurdles. This PPT slide is best to describe business strategy analysis. You can provide a fantastic explanation of the topic with this slide.
Three Sections In Cube With Icons Powerpoint Template
Our above PowerPoint template has been designed with graphics of cube with icons. This PPT slide is designed for business strategy analysis. Add this diagram in your presentations to visually support your content.
Five Hexagons With Business Icons Powerpoint Templates
This PowerPoint template contains graphics of hexagons with business icons. This layout helps you to portray concepts teamwork, idea sharing and business analysis. Streamline the flow of information across the board using this diagram.
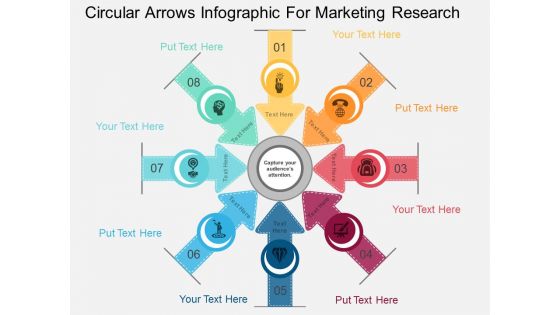
Circular Arrows Infographic For Marketing Research Powerpoint Template
This PPT slide has been designed with circular arrows infographic diagram. This business diagram is suitable for marketing research and analysis. This professional slide helps in making an instant impact on viewers.
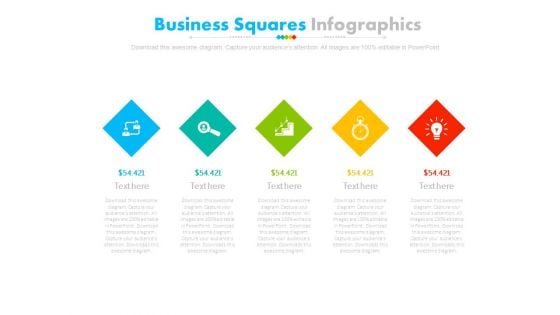
Five Steps Diamond Infographic Diagram Powerpoint Slides
This PowerPoint template has been designed with alphabet steps with icons. This PPT slide may be used to display financial strategy analysis. Make outstanding business presentation with this template.
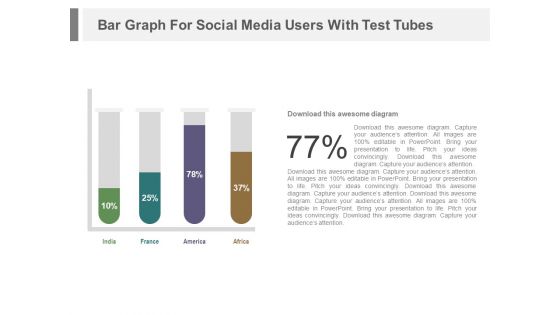
Test Tubes With Financial Data In Percentage Ratio Powerpoint Slides

Three Square Tags With Dollars Value Powerpoint Slides
This PowerPoint template contains three square tags with dollar value. You may download this PPT slide design to display financial analysis. You can easily customize this template to make it more unique as per your need.
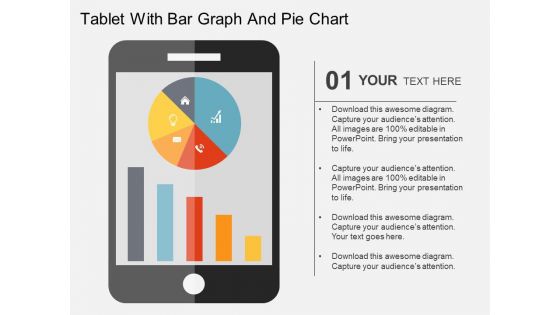
Tablet With Bar Graph And Pie Chart Powerpoint Templates
This business slide has been designed with business graphs on computer tablet. You may download this PPT slide to display statistical analysis. This slide will help you to sequence your thoughts.
Business Infographics Theme Design Powerpoint Slides
This PPT slide has been designed with circular arrows infographic diagram. This business diagram is suitable for marketing research and analysis. This professional slide helps in making an instant impact on viewers.

DNA Design Infographics For Research Powerpoint Slides
This business slide contains four DNA infographic structure. This diagram is suitable to present business research and analysis. Visual effect of this diagram helps in maintaining the flow of the discussion and provides more clarity to the subject.
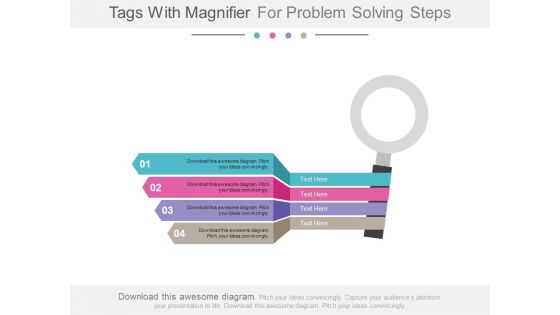
Four Tags With Magnifier For Solution Powerpoint Slides
Visually support your presentation with our above template showing graphics of magnifier with text tags. This PPT slide has been professionally designed to present market research and analysis. This template offers an excellent background to build impressive presentation.
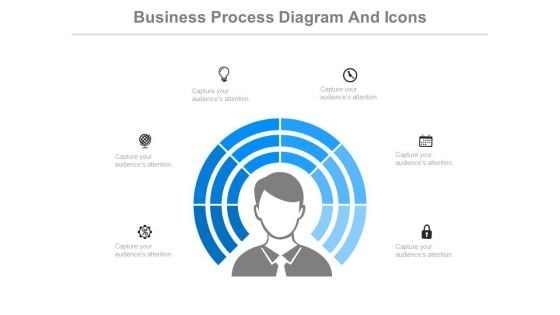
Human Thinking Business Process Diagram Powerpoint Slides
Our above PPT slide contains circles around human mind with icons. This PowerPoint template helps to display thinking process, business strategy and analysis. Use this diagram to impart more clarity to subject and to create more sound impact on viewers.
Six Staged Infographics Square With Business Icons Powerpoint Templates
This business diagram displays circular puzzle infographic. This editable slide is suitable to present global communication. Use this diagram for business and finance related topics and display complete data analysis in your presentation.
Three Arrows With Icons Powerpoint Templates
This business diagram displays graphic of three arrows with icons. This power point template contains the concept of business analysis and research. Use this diagram to build unique presentation for your viewers.
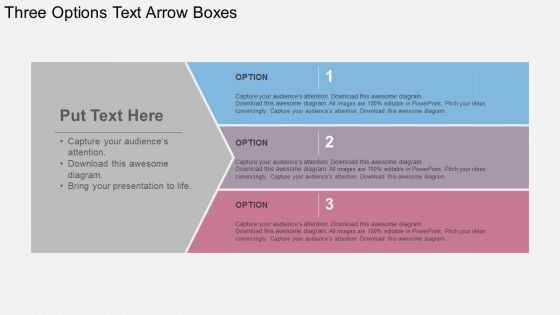
Three Options Text Arrow Boxes Powerpoint Templates
This business diagram displays graphic of arrows with icons. This power point template contains the concept of business analysis and research. Use this diagram to build unique presentation for your viewers.
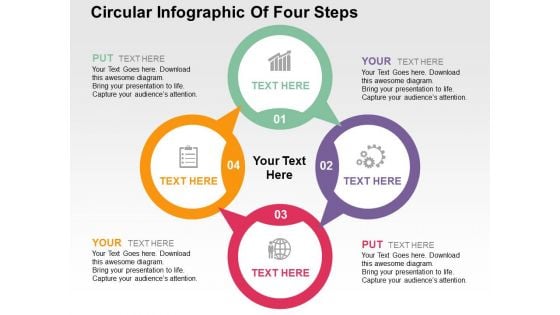
Circular Infographic Of Four Steps Powerpoint Templates
Visually support your presentation with our above template showing circular Infographic. This slide has been professionally designed to emphasize the concept of market research and analysis. Deliver amazing presentations to mesmerize your audience.
Colorful Cards With Icons For Technology Powerpoint Templates
This slide has been designed with graphics of colorful cards with icons of bulb, dollar, gear and magnifier. You may download this slide for financial analysis. Deliver amazing presentations to mesmerize your audience.
Circular Arrow Chart With Business Icons Powerpoint Slides
Graphics of circular arrow chart with icons have been displayed in this business slide. This business diagram helps to exhibit strategy analysis and management. Use this PowerPoint template to visually support your content.
Circular Arrows Design With Icons For Business Powerpoint Slides
Graphics of circular arrows design with icons have been displayed in this business slide. This business diagram helps to exhibit strategy analysis and management. Use this PowerPoint template to visually support your content.
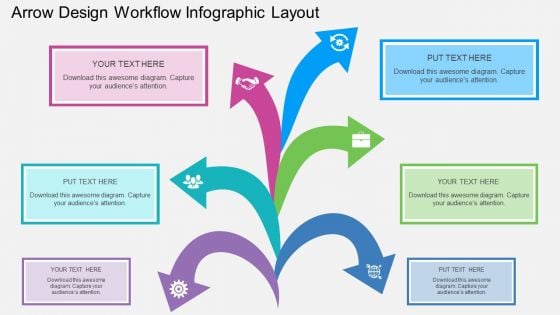
Arrow Design Workflow Infographic Layout Powerpoint Template
Concept of business analysis can be well explained with this power point template. This PPT slide contains design of arrow workflow infographic. Use this diagram slide to make impressive presentations.
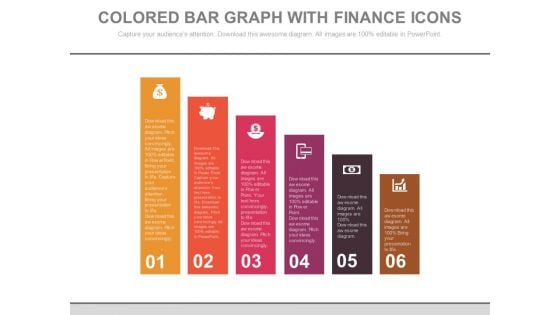
Bar Graph For Marketing Research Data Powerpoint Slides
This PowerPoint template has been designed with diagram of bar graph. This PPT slide can be used to prepare presentations for profit growth report and also for financial data analysis. You can download finance PowerPoint template to prepare awesome presentations.
Bar Graph For Marketing Research Process Powerpoint Slides
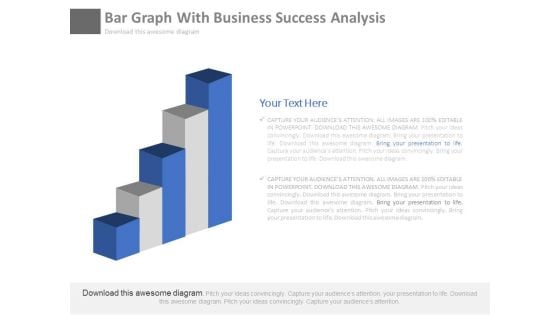
This PowerPoint template has been designed with diagram of bar graph. This PPT slide can be used to prepare presentations for profit growth report and also for financial data analysis. You can download finance PowerPoint template to prepare awesome presentations.
Circle Diagram For Business Marketing Mix Powerpoint Slides
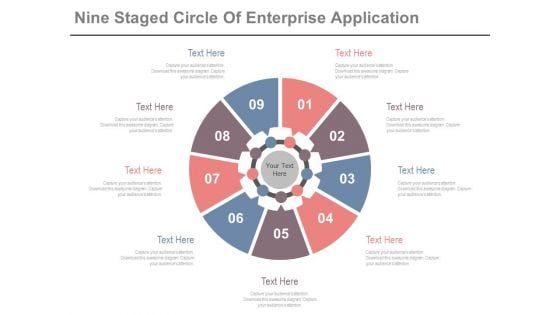
This PowerPoint template has been designed with nine steps circle chart. This PPT slide can be used to prepare presentations for profit growth report and also for financial data analysis. You can download finance PowerPoint template to prepare awesome presentations.
Four Steps Arrow Chart Design Powerpoint Slides
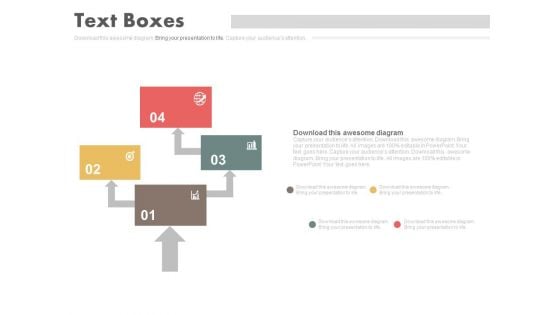
This PowerPoint template has been designed with four steps arrow chart. This PPT slide can be used to prepare presentations for marketing reports and also for financial data analysis. You can download finance PowerPoint template to prepare awesome presentations.
Pyramid For Financial Accounting Information Powerpoint Slides
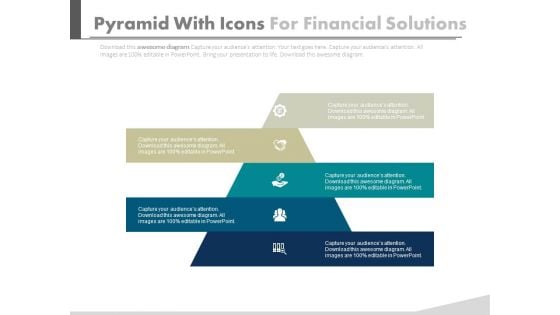
This PowerPoint template has been designed with graphics of pyramid chart. This PPT slide can be used to prepare presentations for profit growth report and also for financial data analysis. You can download finance PowerPoint template to prepare awesome presentations.

Four Business Option Banner Diagram Powerpoint Template
This business slide contains four option banners with business icons. This PPT diagram is suitable to present concept of profit growth value analysis. Visual effect of this diagram provides more clarity to the subject.
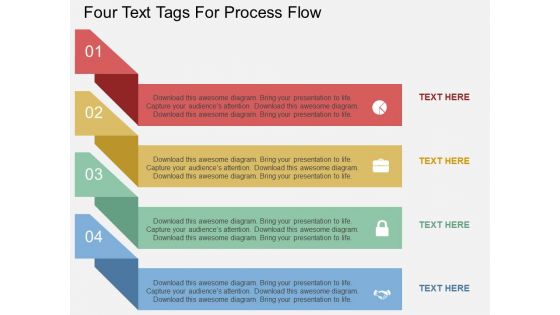
Four Text Tags For Process Flow Powerpoint Template
This PPT slide contains four text tags with business icons. This PPT diagram is suitable to present concept of profit growth value analysis. Enlighten others on the process with this innovative PowerPoint template.
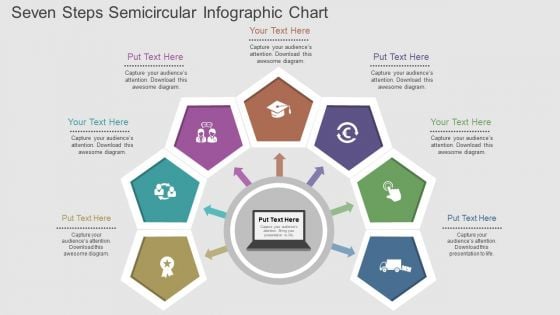
Seven Steps Semicircular Infographic Chart Powerpoint Template
This business slide contains four option banners with business icons. This PPT diagram is suitable to present concept of profit growth value analysis. Visual effect of this diagram provides more clarity to the subject.
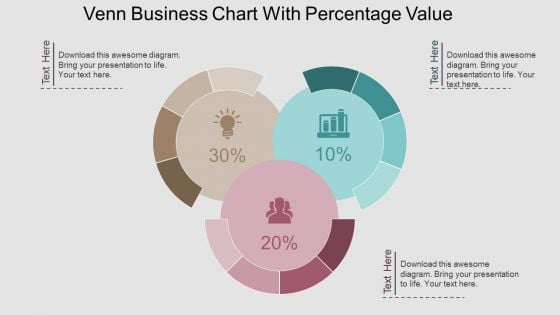
Venn Business Chart With Percentage Value Powerpoint Template
This PPT slide contains Venn business chart with percentage values. This PPT diagram is suitable to present data comparison and analysis. Enlighten others on the process with this innovative PowerPoint template.
Six Circular Arrows With Globe And Icons Powerpoint Template
This power point template contains graphics of six circular arrows with globe and icons. Download this PPT diagram slide to display global business analysis. Make outstanding presentation by using this creative diagram.

Future Vision And Mission Corporate Layout Powerpoint Slides
This PowerPoint template displays pictures of corporate team member and globe in open sky. You may download this PPT slide to depict corporate vision, mission and strategy analysis. Add this slide to your presentation and impress your superiors.

Three Steps Ribbon Diagram For Financial Measurement Powerpoint Slides
This PowerPoint template has been designed with three steps ribbon diagram. This PPT slide may be used to display financial strategy and analysis. Make outstanding business presentation with this template.
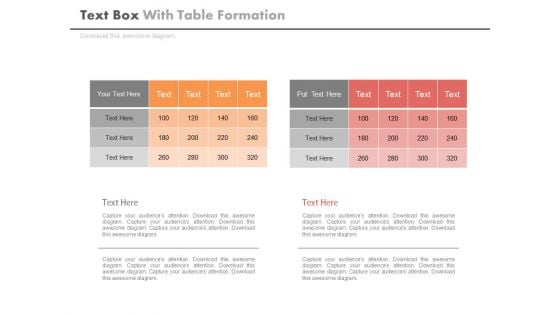
Two Table Charts For Business Data Powerpoint Slides
This PowerPoint template contains two tables chart. You may download this PPT slide to display statistical analysis. You can easily customize this template to make it more unique as per your need.
Four Icons Around Target Board For Business Powerpoint Slides
This PPT slide contains graphics of target board with four icons. You may download this PPT slide as tool for marketing target analysis. Impress your audiences by using this PPT slide.
Circular Chart With Icons For Value Chain Powerpoint Template
This PowerPoint template has been designed with circular chart and icons. This professional PPT slide is suitable to present value chain analysis. Capture the attention of your audience using this professional slide.
Pie Chart With Seven Business Icons Powerpoint Templates
Our compelling template consists with a design of pie chart with seven business icons. This slide has been professionally designed to exhibit financial ratio analysis. This template offers an excellent background to build impressive presentation.
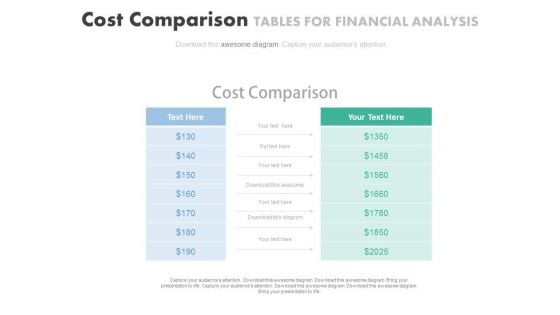
Cost Comparison Table Chart Powerpoint Slides
Our above PPT slide displays cost comparison table chart. This diagram may be used to display cost comparison and financial analysis. Download this PowerPoint template to leave permanent impression on your audience.
Four Overlapping Steps With Icons Powerpoint Template
This PPT slide contains four overlapping steps with business icons. This PPT diagram is suitable to present concept of profit growth value analysis. Enlighten others on the process with this innovative PowerPoint template.
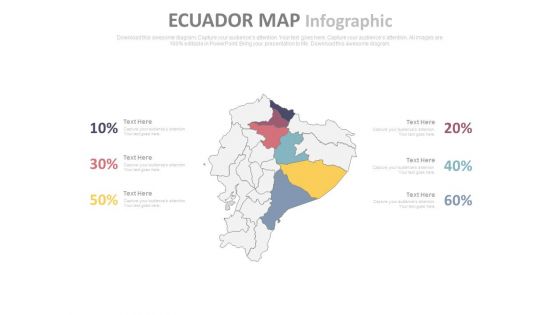
Ecuador Map With Six Different Locations And Percentage Values Powerpoint Slides
This PowerPoint template displays graphics of Ecuador map with six different locations and percentage values. This Map template can be used in business presentations to depict economic analysis. This slide can also be used by school students for educational projects.

About Company Ceo Skills Profile Powerpoint Slides
This PowerPoint template contains picture of company CEO with performance analysis. You may use this as introduction slide for your presentation. Download this creative template to catch the attention of the people.

About Us With Founder Ceo Photo Powerpoint Slides
This PowerPoint template contains picture of founder CEO with performance analysis. You may use this as introduction slide for your presentation. Download this creative template to catch the attention of the people.
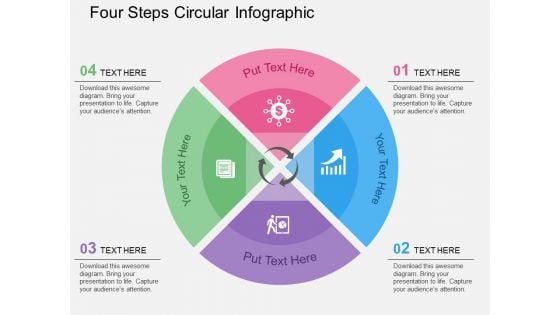
Four Steps Circular Infographic Powerpoint Templates
Our above slide contains diagram of three stage circular infographic. It helps to display global business analysis. Use this diagram to impart more clarity to data and to create more sound impact on viewers.
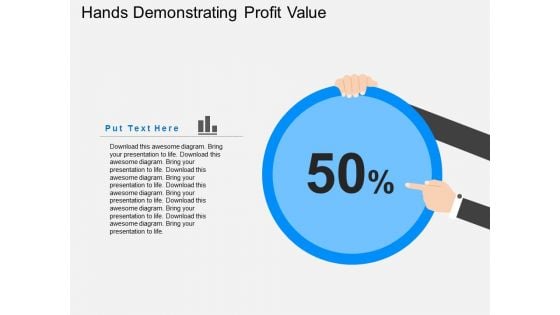
Hands Demonstrating Profit Value Powerpoint Templates
Our above slide contains diagram of zigzag arrow on monitor. It helps to display growth analysis and management. Use this diagram to impart more clarity to information and to create more sound impact on viewers.
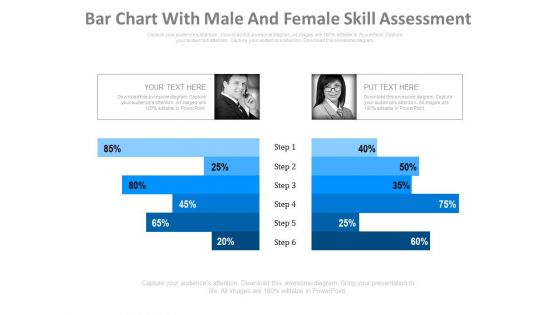
Chart For Employees Performance Measurement Powerpoint Slides
This PowerPoint template has been designed with graphics of compare chart. You may download this diagram slide for analysis of employee performance. Add this slide to your presentation and impress your superiors.
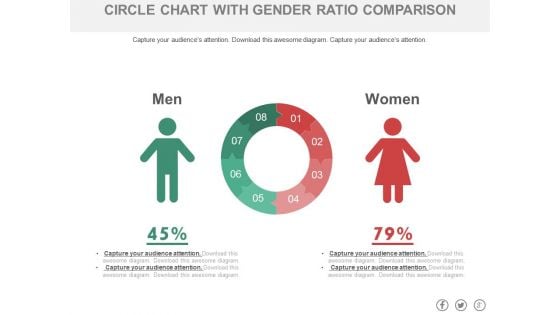
Circle Chart With Man And Woman Ratio Comparison Powerpoint Slides
This PowerPoint template has been designed with graphics of circle chart. You may download this PPT slide to depict man and woman ratio analysis. Add this slide to your presentation and impress your superiors.
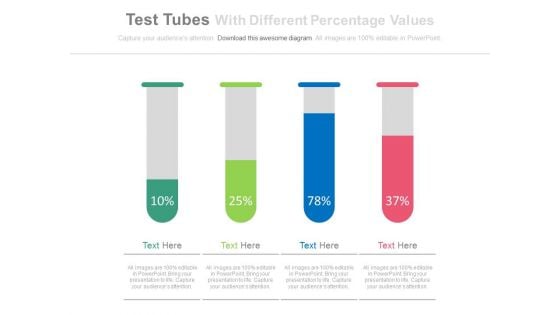
Test Tubes With Percentage Data For Comparison Powerpoint Slides
This PowerPoint template has been designed with test tubes and percentage data. You may download this PPT slide to display data comparison and analysis. Add this slide to your presentation and impress your superiors.
Three Text Boxes With Percentage Values And Icons Powerpoint Slides
This PowerPoint template has been designed with text boxes and percentage data. You may download this PPT slide to display data comparison and analysis. Add this slide to your presentation and impress your superiors.

Three Text Tags Compare Chart Powerpoint Slides
This PowerPoint template has been designed with text tags and percentage data. You may download this PPT slide to display data comparison and analysis. Add this slide to your presentation and impress your superiors.
Four Circles With Percentage Values And Icons Powerpoint Slides
This PowerPoint template displays info graphic diagram of linear circles. This diagram may be used to exhibit financial growth and analysis. Grab center stage with this slide and capture the attention of your audience.
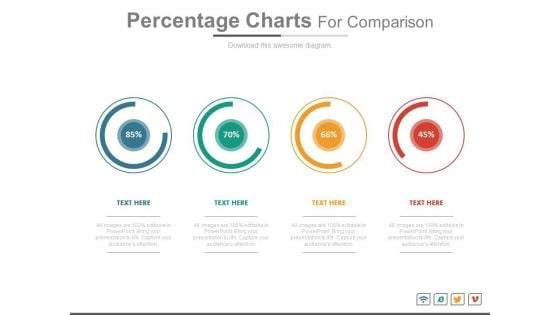
Percentage Charts For Statistical Comparison Powerpoint Slides
This PowerPoint template has been chart of percentage values. You may download this diagram for statistical comparison and analysis. Add this PPT slide to your presentation and impress your superiors.
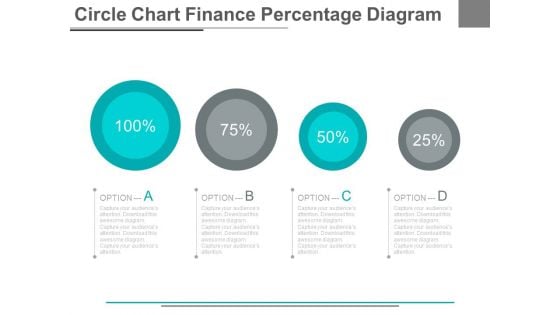
Four Options Circle Chart With Percentage Powerpoint Slides
This PowerPoint template has been designed with graphics of four options circle chart. This PowerPoint template may be used to display four steps of financial analysis. Prove the viability of your ideas using this impressive slide.
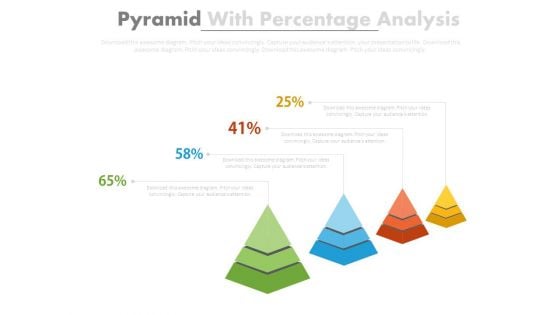
Four Pyramids With Growth Steps Powerpoint Slides
This business slide has been designed with four pyramids. This PowerPoint template may use to display sales growth and analysis. Prove the viability of your ideas using this impressive slide.
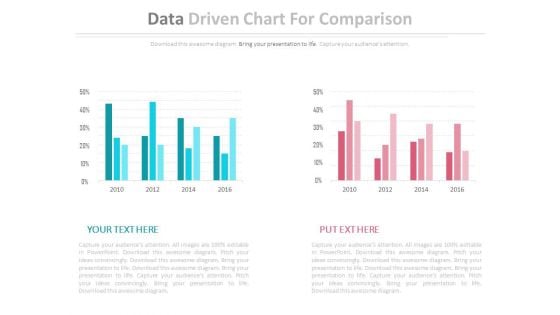
Two Data Driven Comparison Charts Powerpoint Slides
This PowerPoint template contains diagram of two data driven charts. You may use this PPT slide to depict strategic analysis for business. The color coding of this template is specifically designed to highlight you points.
Map Diagram With Bar Graph And Icons Powerpoint Slides
This PowerPoint template displays graphics of map diagram with bar graph and icons. This Map template can be used in business presentations to depict economic analysis. This slide can also be used by school students for educational projects.
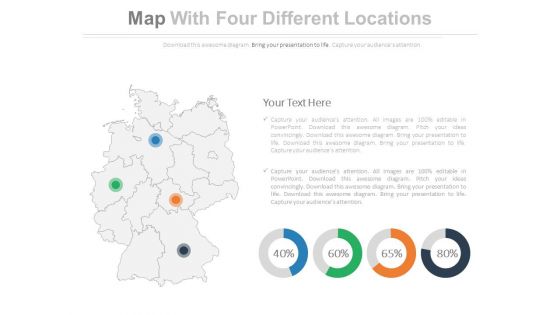
Map Diagram With Four Locations Powerpoint Slides
This PowerPoint template displays graphics of map diagram with four locations and percentage values. This Map template can be used in business presentations to depict economic analysis. This slide can also be used by school students for educational projects.
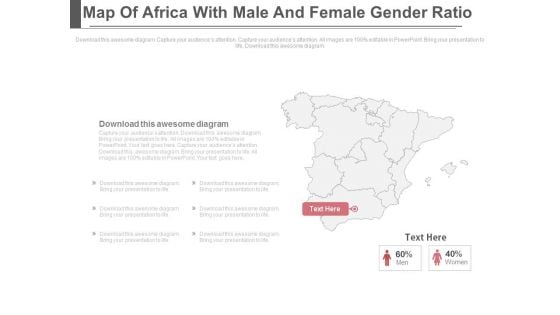
Map Of Africa With Men And Women Gender Ratio Powerpoint Slides
This PowerPoint template displays graphics of Africa map with men women icons. This PPT template can be used to display gender ratio analysis. This slide can also be used by school students for educational projects.
Five Circles Sequential Chart With Icons Powerpoint Slides
This PowerPoint template contains sequential chart of five circles with icons. You may download this PPT slide to depict corporate vision, mission and strategy analysis. Add this slide to your presentation and impress your superiors.
Market Trends Chart With Percentage And Icons Powerpoint Slides
This PowerPoint template has been designed with graphics of chart with percentage values and icons. This PowerPoint template may be used to market trends and financial analysis. Prove the viability of your ideas using this impressive slide.

Three Person Tags With Skill Percentage Charts Powerpoint Slides
This PowerPoint template has been designed with three person?s tags with percentage values. This Info graphic diagram may be used to display team skill analysis. Download this impressive diagram to build unique presentations.

Pyramid Design For Employees Performance Powerpoint Slides
This PPT slide contains graphics of pyramid diagram. Download this PowerPoint template to depict employee?s performance and analysis. Deliver amazing presentations to mesmerize your audience by using this slide design.


 Continue with Email

 Home
Home


