Raci Chart
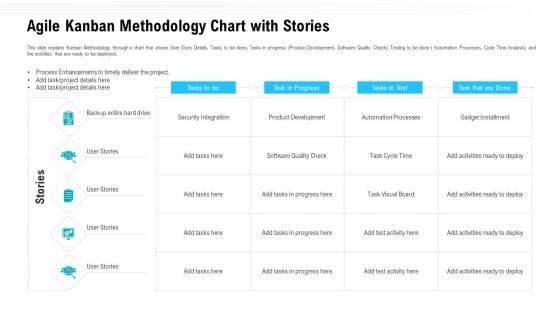
Agile Kanban Methodology Chart With Stories Ppt Model Show PDF
This slide explains Kanban Methodology through a chart that shows User Story Details, Tasks to be done, Tasks in progress Product Development, Software Quality Check, Testing to be done Automation Processes, Cycle Time Analysis and the activities that are ready to be deployed. Deliver an awe inspiring pitch with this creative agile kanban methodology chart with stories ppt model show pdf bundle. Topics like product development, process enhancements to timely deliver the project, agile kanban methodology chart with stories can be discussed with this completely editable template. It is available for immediate download depending on the needs and requirements of the user.
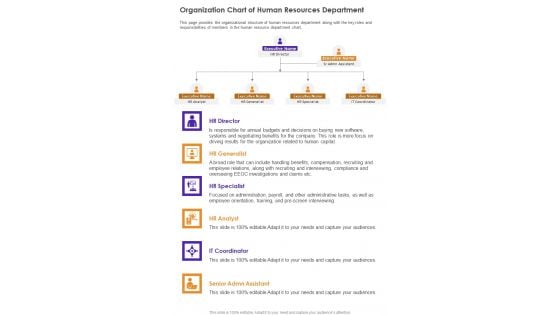
Organization Chart Of Human Resources Department One Pager Documents
This page provides the organizational structure of human resources department along with the key roles and responsibilities of members in the human resource department chart. Presenting you an exemplary Organization Chart Of Human Resources Department One Pager Documents. Our one-pager comprises all the must-have essentials of an inclusive document. You can edit it with ease, as its layout is completely editable. With such freedom, you can tweak its design and other elements to your requirements. Download this Organization Chart Of Human Resources Department One Pager Documents brilliant piece now.
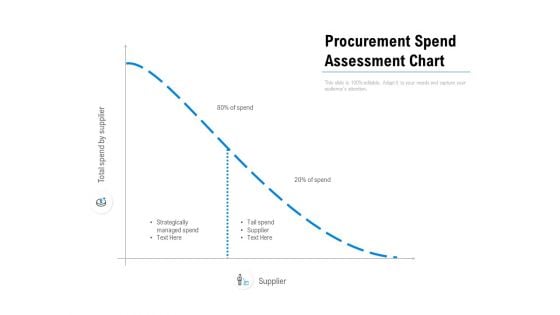
Procurement Spend Assessment Chart Ppt PowerPoint Presentation Model Introduction
Presenting this set of slides with name procurement spend assessment chart ppt powerpoint presentation model introduction. This is a one stage process. The stages in this process are strategically managed spend, tail spend, supplier. This is a completely editable PowerPoint presentation and is available for immediate download. Download now and impress your audience.
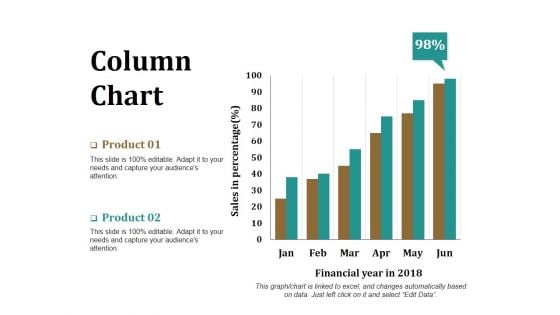
Column Chart Ppt PowerPoint Presentation Model Graphics Download
This is a column chart ppt powerpoint presentation model graphics download. This is a two stage process. The stages in this process are product, financial year, sales in percentage, bar graph, success.
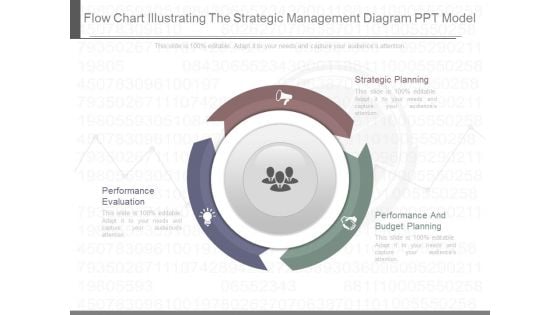
Flow Chart Illustrating The Strategic Management Diagram Ppt Model
This is a flow chart illustrating the strategic management diagram ppt model. This is a three stage process. The stages in this process are strategic planning, performance and budget planning, performance evaluation.
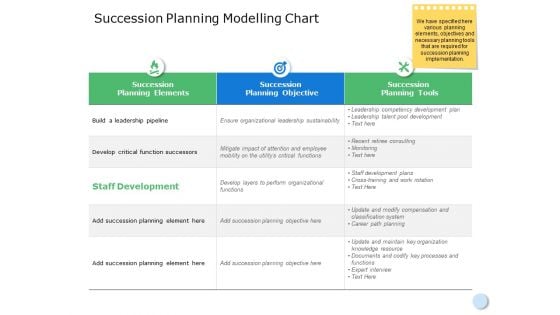
Succession Planning Modelling Chart Ppt Powerpoint Presentation File Professional
This is a succession planning modelling chart ppt powerpoint presentation file professional.The topics discussed in this diagram aresuccession planning elements, compare, planning, business, management. This is a completely editable PowerPoint presentation, and is available for immediate download.
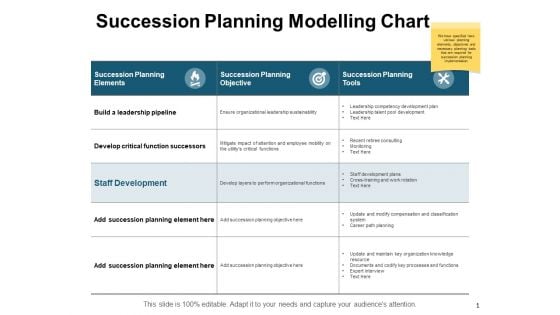
Succession Planning Modelling Chart Ppt PowerPoint Presentation Professional Outline
This is a succession planning modelling chart ppt powerpoint presentation professional outline. The topics discussed in this diagram are marketing, business, management, planning, strategy This is a completely editable PowerPoint presentation, and is available for immediate download.
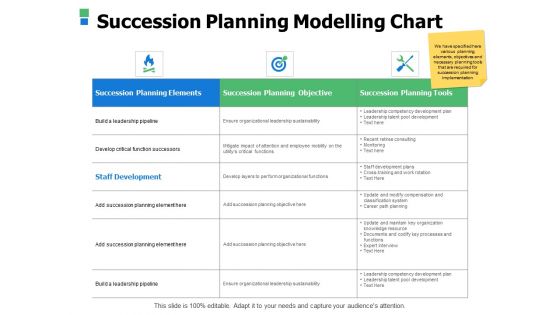
Succession Planning Modelling Chart Ppt Powerpoint Presentation Slides Samples
This is a succession planning modelling chart ppt powerpoint presentation slides samples. The topics discussed in this diagram are business, management, planning, strategy, marketing. This is a completely editable PowerPoint presentation, and is available for immediate download.
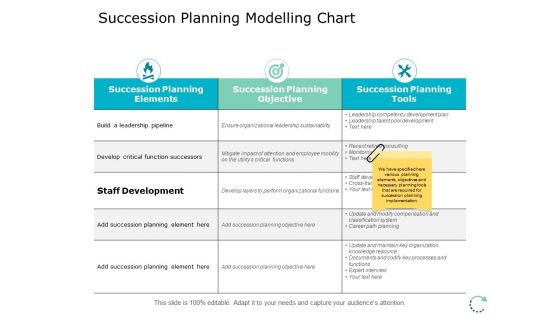
Succession Planning Modelling Chart Ppt PowerPoint Presentation Inspiration Slideshow
This is a succession planning modelling chart ppt powerpoint presentation inspiration slideshow. The topics discussed in this diagram are marketing, business, management, planning, strategy This is a completely editable PowerPoint presentation and is available for immediate download.
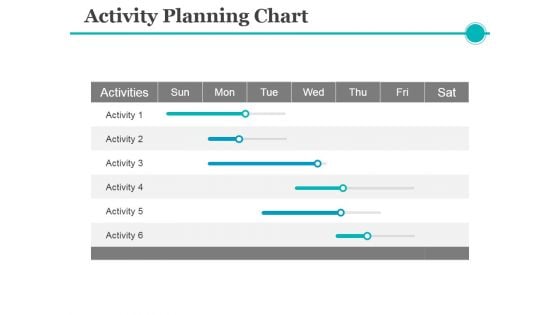
Activity Planning Chart Ppt PowerPoint Presentation Visual Aids Model
This is a activity planning chart ppt powerpoint presentation visual aids model. This is a six stage process. The stages in this process are activities, business, management, table, planning.
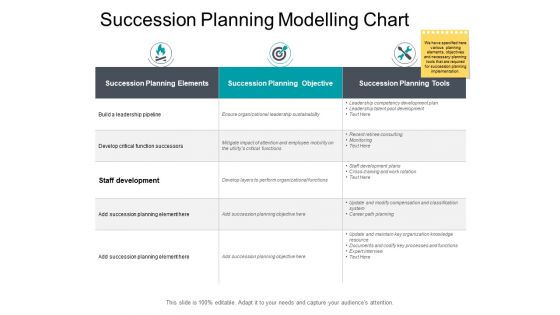
Succession Planning Modelling Chart Ppt PowerPoint Presentation Professional Gridlines
This is a succession planning modelling chart ppt powerpoint presentation professional gridlines. This is a three stage process. The stages in this process are compare, marketing, business, management, planning.
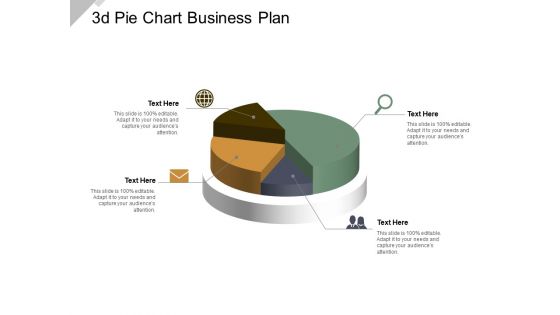
3D Pie Chart Business Plan Ppt PowerPoint Presentation Model Guidelines
This is a 3d pie chart business plan ppt powerpoint presentation model guidelines. This is a four stage process. The stages in this process are art, colouring, paint brush.
Woman Showing Financial Modelling Chart Vector Icon Diagrams PDF
Persuade your audience using this woman showing financial modelling chart vector icon diagrams pdf. This PPT design covers three stages, thus making it a great tool to use. It also caters to a variety of topics including woman showing financial modelling chart vector icon. Download this PPT design now to present a convincing pitch that not only emphasizes the topic but also showcases your presentation skills.
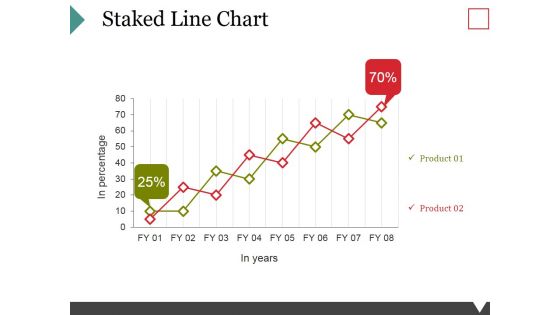
Staked Line Chart Ppt PowerPoint Presentation Model Graphics Download
This is a staked line chart ppt powerpoint presentation model graphics download. This is a two stage process. The stages in this process are business, marketing, growth, finance, management.
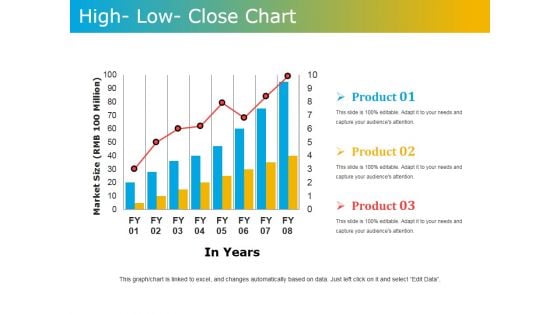
High Low Close Chart Ppt PowerPoint Presentation Model Graphics Tutorials
This is a high low close chart ppt powerpoint presentation model graphics tutorials. This is a three stage process. The stages in this process are market size, in years, product.
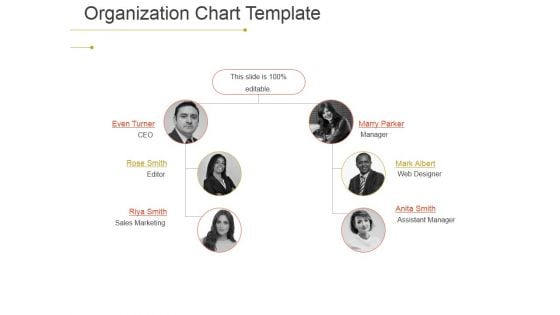
Organization Chart Ppt PowerPoint Presentation Model Graphic Images
This is a organization chart ppt powerpoint presentation model graphic images. This is a six stage process. The stages in this process are editor, sales marketing, assistant manager, manager, web designer.
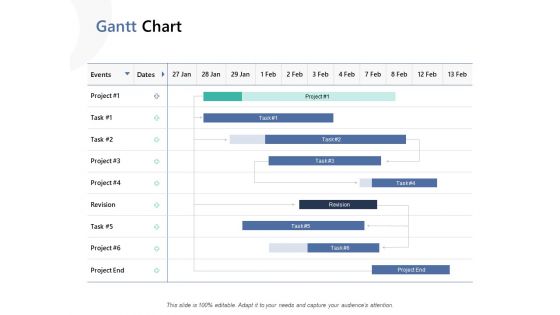
Gantt Chart Ppt PowerPoint Presentation Model Design Inspiration
Make a highly optimized project management report using this content-ready Gantt Chart PPT Diagram. Effortless yet very clear, this layout proves a useful tool to present the professional details of a task or activity. Showcase the activities and allotted time to the business executives with this Gantt Chart PowerPoint theme. List down the column tasks in various timeframes and the activities associated with each of them here. Further, plot time allocation for various tasks, monitor their actual time and make comparisons to interpret the final progress with this well-structured Gantt Chart Excel Template. You can add all the significant details of a particular project in this chart and showcase it to all the project members so that they can participate in the overall development. Not only this but also our PPT template can help you showcase the work breakdown structure of your project.
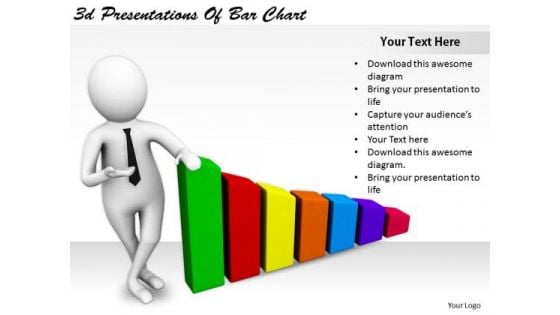
Business Strategy Innovation 3d Presentations Of Bar Chart Character Modeling
Your Thoughts Will Be The Main Course. Provide The Dressing With Our business strategy innovation 3d presentations of bar chart character modeling Powerpoint Templates. Dress Up Your Views With Our Marketing Powerpoint Templates. Deliver Your Ideas With Aplomb.
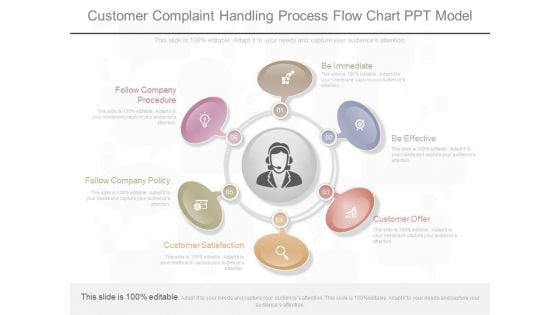
Customer Complaint Handling Process Flow Chart Ppt Model
This is a customer complaint handling process flow chart ppt model. This is a six stage process. The stages in this process are follow company procedure, follow company policy, customer satisfaction, be immediate, be effective, customer offer.
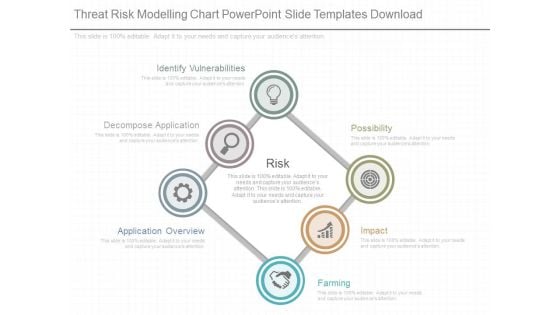
Threat Risk Modelling Chart Powerpoint Slide Templates Download
This is a threat risk modelling chart powerpoint slide templates download. This is a six stage process. The stages in this process are identify vulnerabilities, decompose application, application overview, possibility, impact, farming, risk.
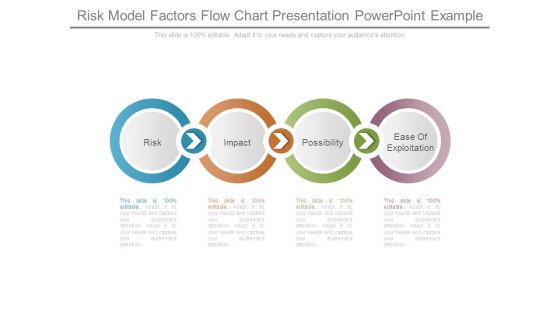
Risk Model Factors Flow Chart Presentation Powerpoint Example
This is a risk model factors flow chart presentation powerpoint example. This is a four stage process. The stages in this process are risk, impact, possibility, ease of exploitation.
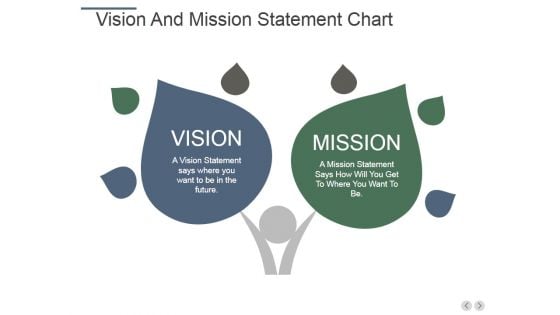
Vision And Mission Statement Chart Ppt PowerPoint Presentation Model Demonstration
This is a vision and mission statement chart ppt powerpoint presentation model demonstration. This is a two stage process. The stages in this process are vision, mission, business, strategy, management.

Scatter Bubble Chart Ppt PowerPoint Presentation Professional Model
This is a scatter bubble chart ppt powerpoint presentation professional model. This is a six stage process. The stages in this process are sales in profit, financial year, growth, business, marketing, strategy.
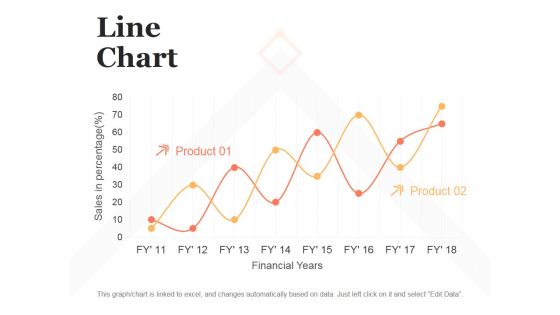
Line Chart Ppt PowerPoint Presentation Model Design Templates
This is a line chart ppt powerpoint presentation model design templates. This is a two stage process. The stages in this process are sales in percentage, financial years, product.
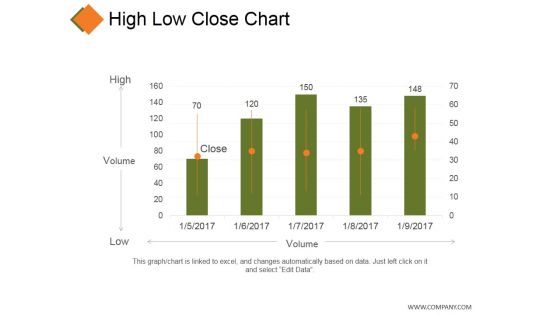
High Low Close Chart Ppt PowerPoint Presentation Model Grid
This is a high low close chart ppt powerpoint presentation model grid. This is a five stage process. The stages in this process are business, high, volume, low, marketing.
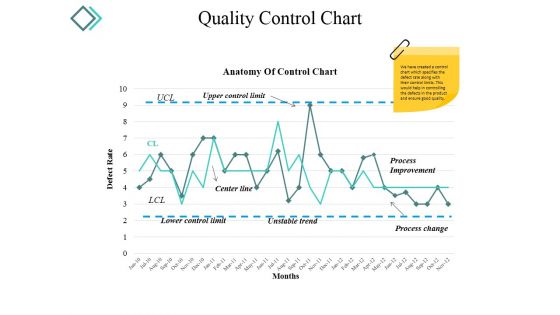
Quality Control Chart Ppt PowerPoint Presentation Model Background Images
This is a quality control chart ppt powerpoint presentation model background images. This is a two stage process. The stages in this process are center line, process improvement, process change, unstable trend.
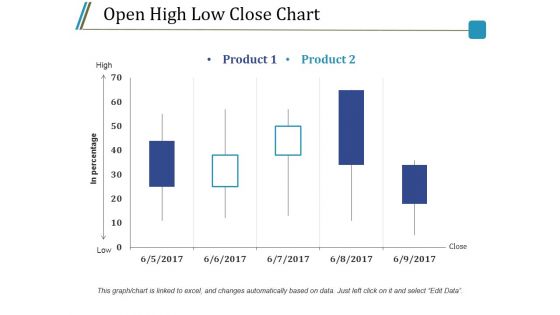
Open High Low Close Chart Ppt PowerPoint Presentation Styles Model
This is a open high low close chart ppt powerpoint presentation styles model. This is a five stage process. The stages in this process are product, high, low, in percentage, close.
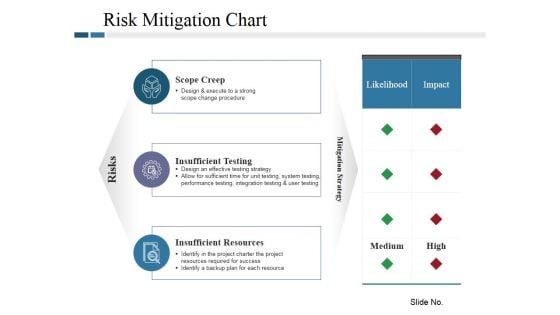
Risk Mitigation Chart Ppt PowerPoint Presentation Model Tips
This is a risk mitigation chart ppt powerpoint presentation model tips. This is a three stage process. The stages in this process are scope creep, insufficient testing, insufficient resources, risks, likelihood.
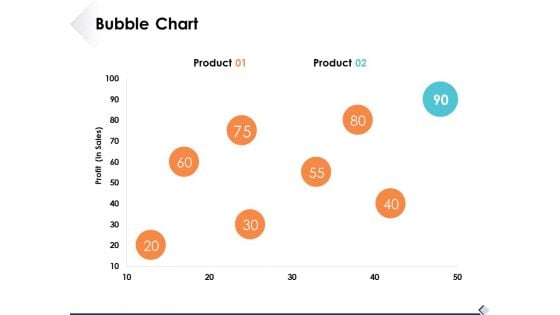
Bubble Chart Marketing Business Ppt PowerPoint Presentation Model Sample
This is a bubble chart marketing business ppt powerpoint presentation model sample. This is a two stage process. The stages in this process are finance, business, management, strategy, analysis.

Donut Pie Chart Finance Ppt PowerPoint Presentation Portfolio Model
This is a donut pie chart finance ppt powerpoint presentation portfolio model. This is a three stage process. The stages in this process are finance, management, strategy, analysis, marketing.
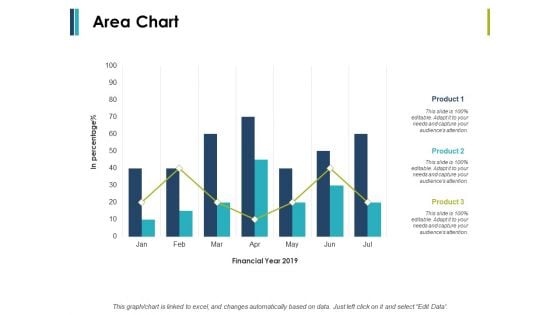
Area Chart Finance Ppt PowerPoint Presentation Infographic Template Model
This is a area chart finance ppt powerpoint presentation infographic template model. This is a two stage process. The stages in this process are finance, marketing, management, investment, analysis.

Emotional Investing Chart Ppt PowerPoint Presentation Portfolio Model Cpb Pdf
Presenting this set of slides with name emotional investing chart ppt powerpoint presentation portfolio model cpb pdf. This is an editable Powerpoint one stages graphic that deals with topics like emotional investing chart to help convey your message better graphically. This product is a premium product available for immediate download and is 100 percent editable in Powerpoint. Download this now and use it in your presentations to impress your audience.
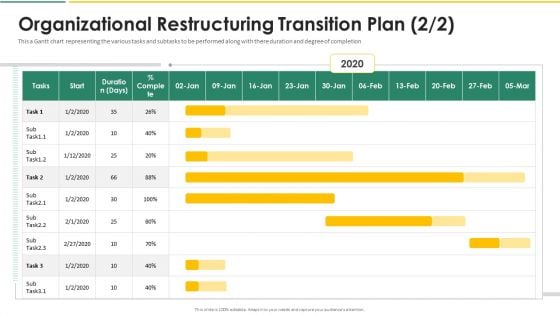
Organization Chart And Corporate Model Transformation Organizational Restructuring Background PDF
This a Gantt chart representing the various tasks and subtasks to be performed along with there duration and degree of completion. Deliver and pitch your topic in the best possible manner with this organization chart and corporate model transformation organizational restructuring background pdf. Use them to share invaluable insights on organizational restructuring transition plan and impress your audience. This template can be altered and modified as per your expectations. So, grab it now.

Expected Return And Variance Chart Powerpoint Slide Deck Template
This is a expected return and variance chart powerpoint slide deck template. This is a one stage process. The stages in this process are investment reward, reward matrix, high, med, low.
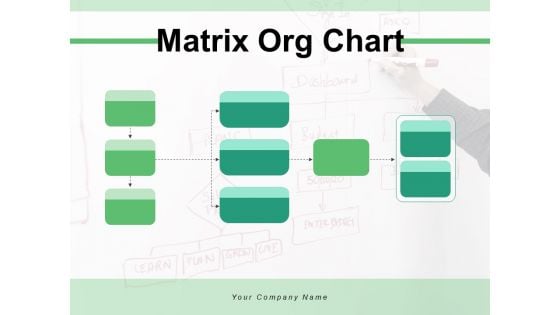
Matrix Org Chart Sales Department Ppt PowerPoint Presentation Complete Deck
Presenting this set of slides with name matrix org chart sales department ppt powerpoint presentation complete deck. The topics discussed in these slides are construction, management, employee, sales department, manufacturing. This is a completely editable PowerPoint presentation and is available for immediate download. Download now and impress your audience.
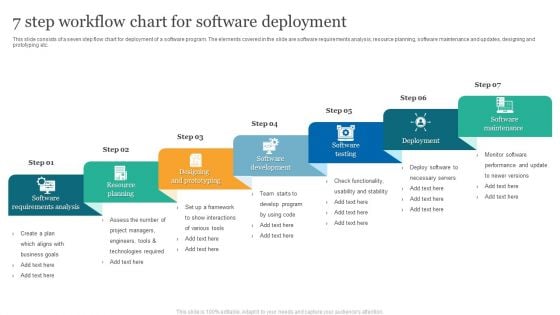
7 Step Workflow Chart For Software Deployment Introduction PDF
This slide consists of a seven step flow chart for deployment of a software program. The elements covered in the slide are software requirements analysis, resource planning, software maintenance and updates, designing and prototyping etc. Persuade your audience using this 7 Step Workflow Chart For Software Deployment Introduction PDF. This PPT design covers Seven stages, thus making it a great tool to use. It also caters to a variety of topics including Software Requirements Analysis, Resource Planning, Designing And Prototyping. Download this PPT design now to present a convincing pitch that not only emphasizes the topic but also showcases your presentation skills.
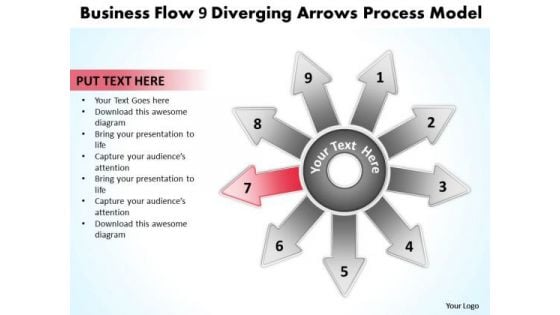
Templates Flow 9 Diverging Arrows Process Model Cycle Chart PowerPoint
We present our templates flow 9 diverging arrows process model Cycle Chart PowerPoint.Download our Business PowerPoint Templates because everybody knows The world over it is a priority for many. Along with it there are so many oppurtunities waiting to be utilised. Download and present our Shapes PowerPoint Templates because Our PowerPoint Templates and Slides are effectively colour coded to prioritise your plans They automatically highlight the sequence of events you desire. Download and present our Success PowerPoint Templates because the choices you make today will determine the future growth of your enterprise. Present our Process and Flows PowerPoint Templates because this diagram helps you to develop your marketing strategy and communicate your enthusiasm and motivation to raise the bar. Download our Arrows PowerPoint Templates because you can Adorn them with your ideas and thoughts.Use these PowerPoint slides for presentations relating to Arrow, Background, Center, Chart, Clip, Communication, Competition, Computer, Concept, Connect, Connection, Diagram, Direction, Group, Illustration, Information, Network, Process, Progress, Purpose, Strategy, Symbol, Target. The prominent colors used in the PowerPoint template are Pink, White, Gray. People tell us our templates flow 9 diverging arrows process model Cycle Chart PowerPoint are Playful. People tell us our Computer PowerPoint templates and PPT Slides are Ultra. The feedback we get is that our templates flow 9 diverging arrows process model Cycle Chart PowerPoint are Multicolored. Presenters tell us our Computer PowerPoint templates and PPT Slides are Sparkling. Customers tell us our templates flow 9 diverging arrows process model Cycle Chart PowerPoint are No-nonsense. The feedback we get is that our Chart PowerPoint templates and PPT Slides are Exuberant. Curb assumptions with our Templates Flow 9 Diverging Arrows Process Model Cycle Chart PowerPoint. Face up to them with the facts.
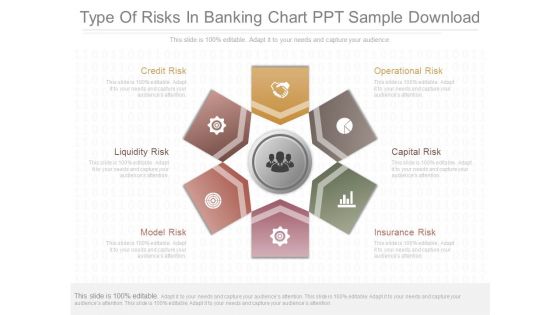
Type Of Risks In Banking Chart Ppt Sample Download
This is a type of risks in banking chart ppt sample download. This is a six stage process. The stages in this process are credit risk, liquidity risk, model risk, operational risk, capital risk, insurance risk.
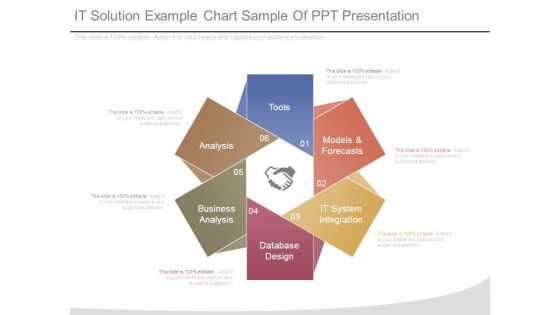
It Solution Example Chart Sample Of Ppt Presentation
This is a it solution example chart sample of ppt presentation. This is a six stage process. The stages in this process are tools, models and forecasts, it system integration, database design, business analysis, analysis.
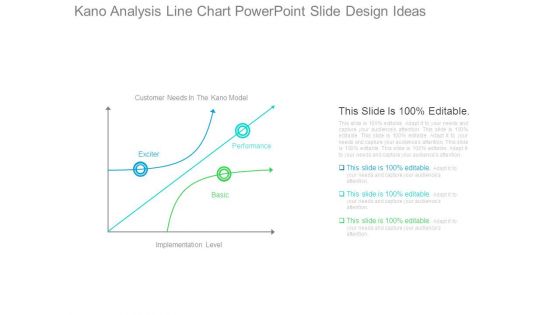
Kano Analysis Line Chart Powerpoint Slide Design Ideas
This is a kano analysis line chart powerpoint slide design ideas. This is a three stage process. The stages in this process are customer needs in the kano model, exciter, performance, basic, implementation level.
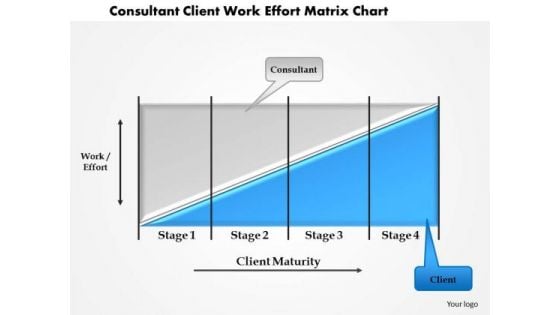
Business Framework Consultant Client Work Effort Matrix Chart PowerPoint Presentation
This business power point template slide has been crafted with graphic of bar graph. This bar graph is called as coase theorem. Use this professional diagram for your result analysis related presentation.

Business Information Application Protection Testing Flow Chart Themes PDF
This slide covers business application security testing flow chart which includes secure application model, security standard recognition and privacy testing.Pitch your topic with ease and precision using this Business Information Application Protection Testing Flow Chart Themes PDF. This layout presents information on Security Consistency, Target Weighting, Target Recognition. It is also available for immediate download and adjustment. So, changes can be made in the color, design, graphics or any other component to create a unique layout.
Brand Rollout Plan Chart Ppt PowerPoint Presentation Icon Graphics Tutorials
Presenting this set of slides with name brand rollout plan chart ppt powerpoint presentation icon graphics tutorials. This is a five stage process. The stages in this process are quality, value proposition, product. This is a completely editable PowerPoint presentation and is available for immediate download. Download now and impress your audience.
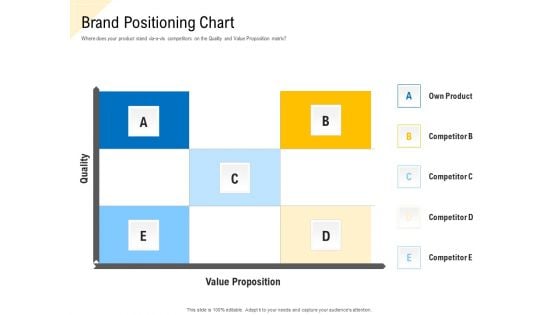
Developing Market Positioning Strategy Brand Positioning Chart Themes PDF
Presenting this set of slides with name developing market positioning strategy brand positioning chart themes pdf. This is a five stage process. The stages in this process are quality, value proposition, competitor. This is a completely editable PowerPoint presentation and is available for immediate download. Download now and impress your audience.
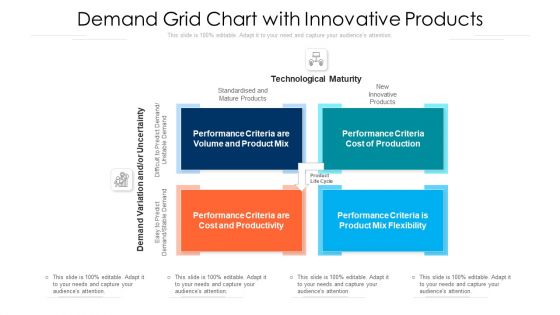
Demand Grid Chart With Innovative Products Ppt Layouts Deck PDF
Presenting demand grid chart with innovative products ppt layouts deck pdf to dispense important information. This template comprises four stages. It also presents valuable insights into the topics including cost and productivity, performance criteria, flexibility, product mix, volume. This is a completely customizable PowerPoint theme that can be put to use immediately. So, download it and address the topic impactfully.
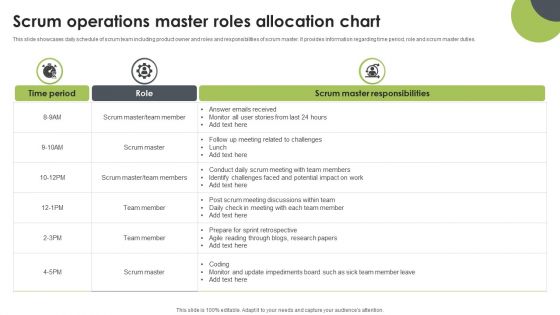
Scrum Operations Master Roles Allocation Chart Information PDF
This slide showcases daily schedule of scrum team including product owner and roles and responsibilities of scrum master. It provides information regarding time period, role and scrum master duties. Showcasing this set of slides titled Scrum Operations Master Roles Allocation Chart Information PDF. The topics addressed in these templates are Scrum Master, Team Member, Answer Emails Received. All the content presented in this PPT design is completely editable. Download it and make adjustments in color, background, font etc. as per your unique business setting.
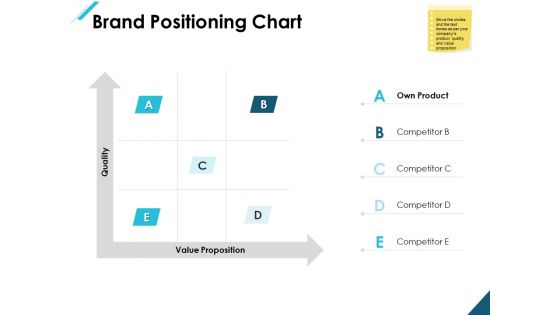
Brand Positioning Chart Ppt PowerPoint Presentation Infographics Layout
Presenting this set of slides with name brand positioning chart ppt powerpoint presentation infographics layout. This is a five stage process. The stages in this process are brand positioning, business, management, planning, strategy. This is a completely editable PowerPoint presentation and is available for immediate download. Download now and impress your audience.
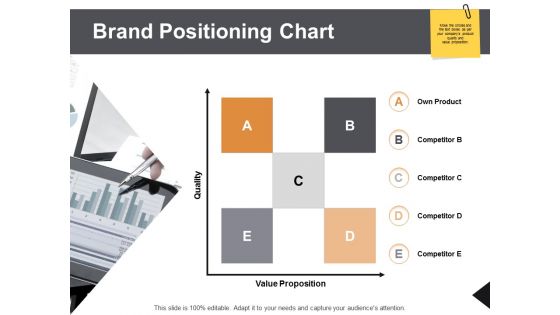
Brand Positioning Chart Ppt PowerPoint Presentation Layouts Show
Presenting this set of slides with name brand positioning chart ppt powerpoint presentation layouts show. This is a five stage process. The stages in this process are business, management, planning, strategy, marketing. This is a completely editable PowerPoint presentation and is available for immediate download. Download now and impress your audience.
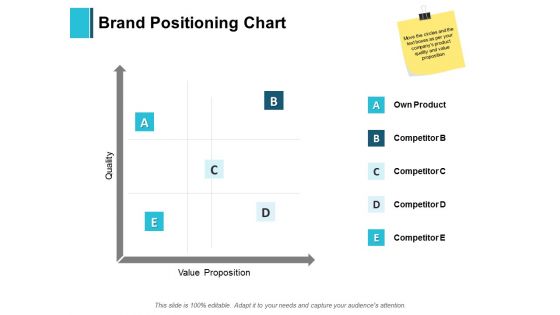
Brand Positioning Chart Ppt PowerPoint Presentation Summary Design Ideas
Presenting this set of slides with name brand positioning chart ppt powerpoint presentation summary design ideas. This is a five stage process. The stages in this process are business, management, planning, strategy, marketing. This is a completely editable PowerPoint presentation and is available for immediate download. Download now and impress your audience.
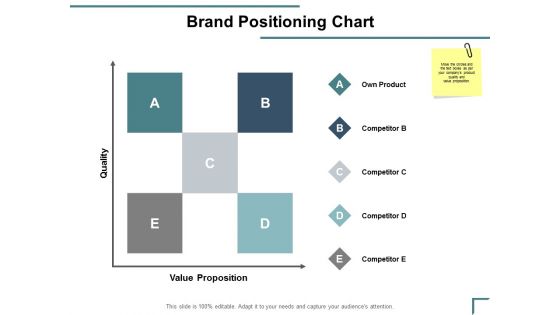
Brand Positioning Chart Ppt PowerPoint Presentation File Templates
Presenting this set of slides with name brand positioning chart ppt powerpoint presentation file templates. This is a five stage process. The stages in this process are business, management, planning, strategy, marketing. This is a completely editable PowerPoint presentation and is available for immediate download. Download now and impress your audience.
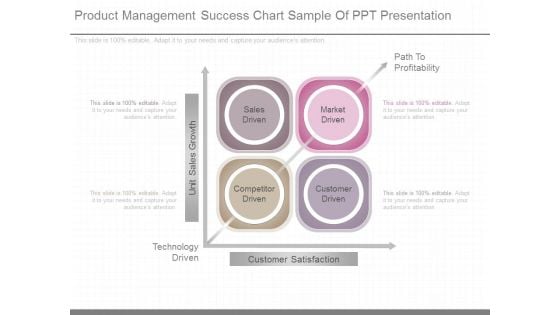
Product Management Success Chart Sample Of Ppt Presentation
This is a product management success chart sample of ppt presentation. This is a four stage process. The stages in this process are sales driven, market driven, competitor driven, customer driven, technology driven, path to profitability, customer satisfaction, unit sales growth.
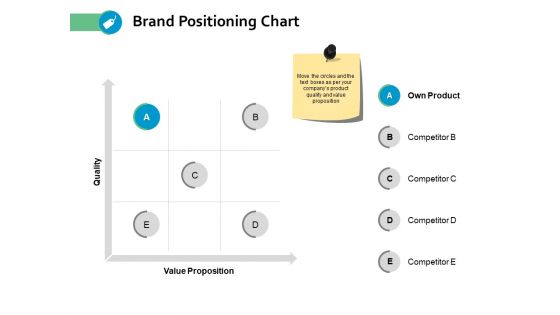
Brand Positioning Chart Ppt Powerpoint Presentation Inspiration Templates
Presenting this set of slides with name brand positioning chart ppt powerpoint presentation inspiration templates. This is a two stage process. The stages in this process are value proposition, quality. This is a completely editable PowerPoint presentation and is available for immediate download. Download now and impress your audience.
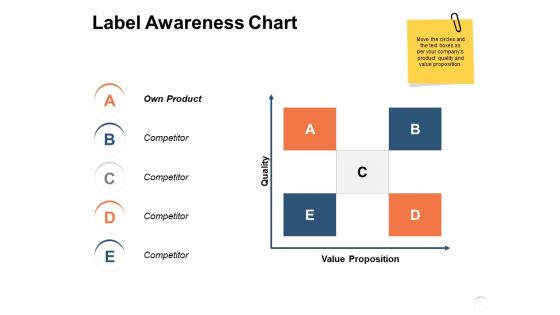
Label Awareness Chart Ppt PowerPoint Presentation Infographics Pictures
Presenting this set of slides with name label awareness chart ppt powerpoint presentation infographics pictures. This is a five stage process. The stages in this process are quality, value proposition, competitor. This is a completely editable PowerPoint presentation and is available for immediate download. Download now and impress your audience.
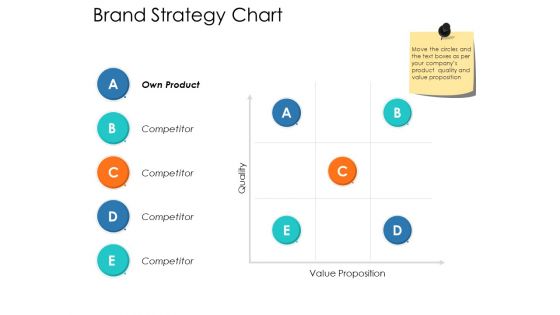
Brand Strategy Chart Ppt Powerpoint Presentation Infographic Template Maker
Presenting this set of slides with name brand strategy chart ppt powerpoint presentation infographic template maker. This is a five stage process. The stages in this process are competitor, quality, value proposition. This is a completely editable PowerPoint presentation and is available for immediate download. Download now and impress your audience.
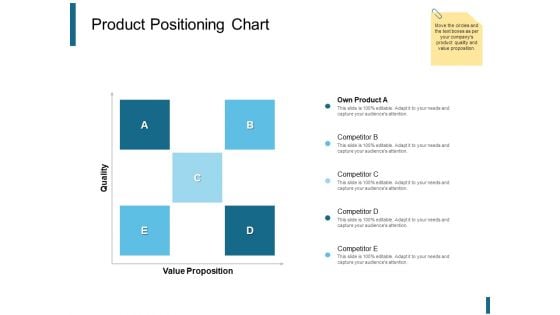
Product Positioning Chart Ppt PowerPoint Presentation Outline Objects
Presenting this set of slides with name product positioning chart ppt powerpoint presentation outline objects. This is a one stage process. The stages in this process are position brand, value proposition, quality, competitor, product. This is a completely editable PowerPoint presentation and is available for immediate download. Download now and impress your audience.
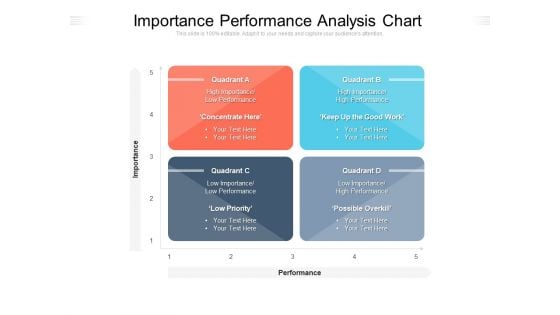
Importance Performance Analysis Chart Ppt PowerPoint Presentation Gallery Examples PDF
Presenting this set of slides with name importance performance analysis chart ppt powerpoint presentation gallery examples pdf. This is a four stage process. The stages in this process are performance, priority, quadrant. This is a completely editable PowerPoint presentation and is available for immediate download. Download now and impress your audience.
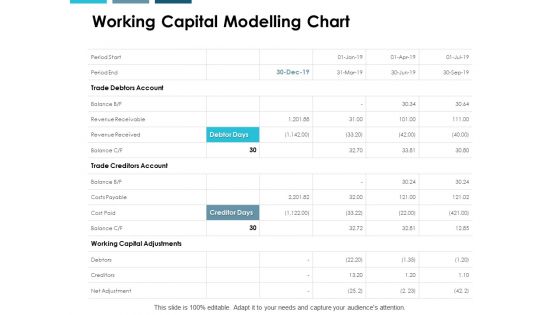
Working Capital Modelling Chart Ppt PowerPoint Presentation Model Deck
Presenting this set of slides with name working capital modelling chart ppt powerpoint presentation model deck. The topics discussed in these slides are business, management, planning, strategy, marketing. This is a completely editable PowerPoint presentation and is available for immediate download. Download now and impress your audience.
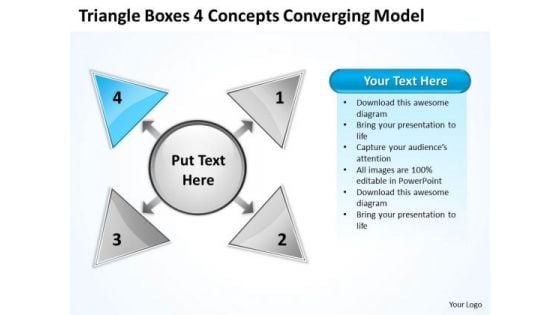
Triangle Boxes 4 Concepts Converging Model Cycle Chart PowerPoint Slides
We present our triangle boxes 4 concepts converging model Cycle Chart PowerPoint Slides.Download our Shapes PowerPoint Templates because you can outline your targets to your team. Present our Business PowerPoint Templates because the great Bald headed Eagle embodies your personality. the eagle eye to seize upon the smallest of opportunities. Present our Arrows PowerPoint Templates because we all know that alphabetical order is a time honoured concept. Download and present our Symbol PowerPoint Templates because you can Grab the attention of your team with this eye catching template signifying . Download our Signs PowerPoint Templates because your team and you always raise a toast.Use these PowerPoint slides for presentations relating to 3d, Abstract, Arrow, Business, Chart, Circle, Circular, Collection, Color, Continuity, Cycle, Decoration, Design, Diagram, Dimensional, Direction, Element, Flow, Glossy, Graph, Icon, Illustration, Isolated, Modern, Motion, Movement, Pattern, Pie, Recycling, Repetition, Report, Ring, Round, Scheme, Section, Set, Shape, Shiny, Sign, Slice, Spinning, Symbol. The prominent colors used in the PowerPoint template are Blue, Gray, Black. Customers tell us our triangle boxes 4 concepts converging model Cycle Chart PowerPoint Slides are Flirty. PowerPoint presentation experts tell us our Circular PowerPoint templates and PPT Slides are Luxurious. We assure you our triangle boxes 4 concepts converging model Cycle Chart PowerPoint Slides are Nice. Customers tell us our Circle PowerPoint templates and PPT Slides are Reminiscent. We assure you our triangle boxes 4 concepts converging model Cycle Chart PowerPoint Slides are Colorful. People tell us our Collection PowerPoint templates and PPT Slides are specially created by a professional team with vast experience. They diligently strive to come up with the right vehicle for your brilliant Ideas. Forget about ceilings with our Triangle Boxes 4 Concepts Converging Model Cycle Chart PowerPoint Slides. They pitch it so high that the glass will crack.
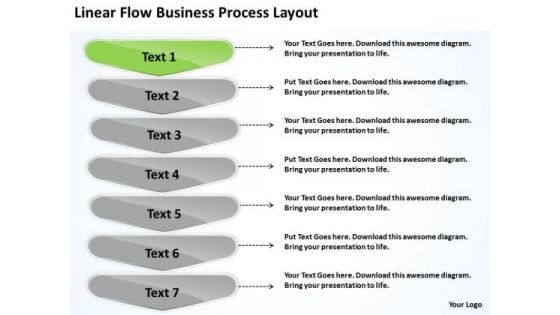
PowerPoint Presentation Process Layout Business Flow Chart Slides
We present our powerpoint presentation process layout business flow chart Slides.Use our Marketing PowerPoint Templates because networking is an imperative in todays world. You need to access the views of others. Similarly you need to give access to them of your abilities. Use our Leadership PowerPoint Templates because there are so many different pieces to the puzzle. Present our Business PowerPoint Templates because you have selected your team man for man. Download our Shapes PowerPoint Templates because it can bring your ideas to the fore so that all around can know. Dissect each idea to the core and select the best. Use our Arrows PowerPoint Templates because it is all there in bits and pieces.Use these PowerPoint slides for presentations relating to Abstract, Arrow, Arrows, Business, Chart, Design, Development, Diagram, Direction, Element, Flow, Flowchart, Graph, Linear, Management, Model, Motion, Organization, Plan, Process, Program, Section, Segment, Set, Sign, Solution, Strategy, Symbol, Technology,,. The prominent colors used in the PowerPoint template are White, Green, Gray. PowerPoint presentation experts tell us our powerpoint presentation process layout business flow chart Slides are Enchanting. Customers tell us our Chart PowerPoint templates and PPT Slides are Elevated. Use our powerpoint presentation process layout business flow chart Slides are Spectacular. Use our Arrows PowerPoint templates and PPT Slides are Dazzling. We assure you our powerpoint presentation process layout business flow chart Slides are Zippy. People tell us our Chart PowerPoint templates and PPT Slides are Stylish. Win trust with our PowerPoint Presentation Process Layout Business Flow Chart Slides. You will come out on top.
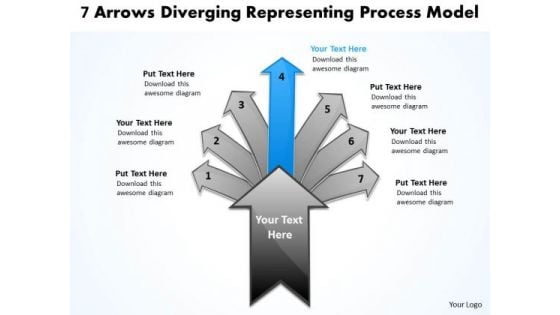
7 Arrows Diverging Representing Process Model Circular Chart PowerPoint Templates
We present our 7 arrows diverging representing process model Circular Chart PowerPoint templates.Use our Sale PowerPoint Templates because you can Highlight the key components of your entire manufacturing/ business process. Download our Arrows PowerPoint Templates because this template with an image of helps you chart the course of your presentation. Present our Process and Flows PowerPoint Templates because our creative template will lay down your views. Present our Business PowerPoint Templates because you too have got the framework of your companys growth in place. Download and present our Shapes PowerPoint Templates because your listeners do not have to put on their thinking caps.Use these PowerPoint slides for presentations relating to Abstract, Arrow, Art, Artistic, Background, Banner, Boost, Box, Business, Clip Art, Color, Colorful, Concept, Cover, Creative, Decide, Decision, Design, Direction, Finance, Futuristic, Graphic, Icon, Idea, Illustration, Increase, Info, Information, Journey, Label, Modern, Path, Pattern, Pop, Print, Process, Sale, Solution, Statistic, Sticker, Stylish, Template. The prominent colors used in the PowerPoint template are Blue, Gray, Black. PowerPoint presentation experts tell us our 7 arrows diverging representing process model Circular Chart PowerPoint templates are Radiant. People tell us our Background PowerPoint templates and PPT Slides are Upbeat. People tell us our 7 arrows diverging representing process model Circular Chart PowerPoint templates are Sparkling. Presenters tell us our Background PowerPoint templates and PPT Slides are Functional. Customers tell us our 7 arrows diverging representing process model Circular Chart PowerPoint templates are Delightful. The feedback we get is that our Boost PowerPoint templates and PPT Slides are Festive. March on ahead with our 7 Arrows Diverging Representing Process Model Circular Chart PowerPoint Templates. You will be at the top of your game.


 Continue with Email

 Home
Home


