Ratio Analysis
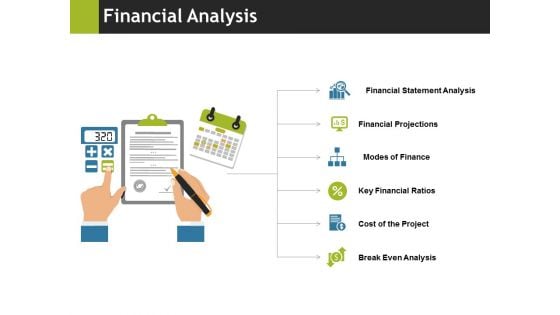
Financial Analysis Ppt PowerPoint Presentation Layouts Visual Aids
This is a financial analysis ppt powerpoint presentation layouts visual aids. This is a six stage process. The stages in this process are financial statement analysis, financial projections, modes of finance, key financial ratios, cost of the project.
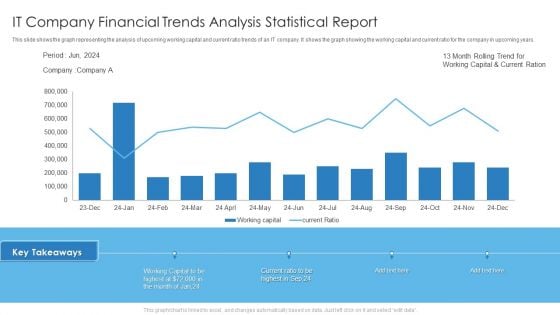
IT Company Financial Trends Analysis Statistical Report Slides PDF
This slide shows the graph representing the analysis of upcoming working capital and current ratio trends of an IT company. It shows the graph showing the working capital and current ratio for the company in upcoming years. Deliver and pitch your topic in the best possible manner with this IT Company Financial Trends Analysis Statistical Report Slides PDF. Use them to share invaluable insights on It Company Financial, Trends Analysis Statistical Report and impress your audience. This template can be altered and modified as per your expectations. So, grab it now.
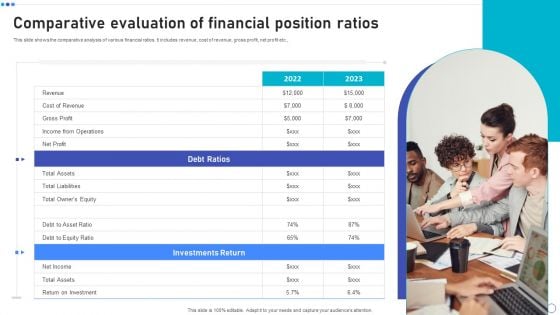
Comparative Evaluation Of Financial Position Ratios Information PDF
This slide shows the comparative analysis of various financial ratios. It includes revenue, cost of revenue, gross profit, net profit etc. Persuade your audience using this Comparative Evaluation Of Financial Position Ratios Information PDF. This PPT design covers two stages, thus making it a great tool to use. It also caters to a variety of topics including Debt Ratios, Investments Return, Net Income. Download this PPT design now to present a convincing pitch that not only emphasizes the topic but also showcases your presentation skills.
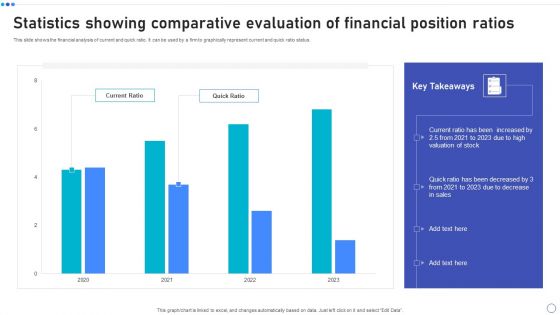
Statistics Showing Comparative Evaluation Of Financial Position Ratios Download PDF
This slide shows the financial analysis of current and quick ratio. It can be used by a firm to graphically represent current and quick ratio status. Pitch your topic with ease and precision using this Statistics Showing Comparative Evaluation Of Financial Position Ratios Download PDF. This layout presents information on Current Ratio, Quick Ratio, 2021 To 2023. It is also available for immediate download and adjustment. So, changes can be made in the color, design, graphics or any other component to create a unique layout.
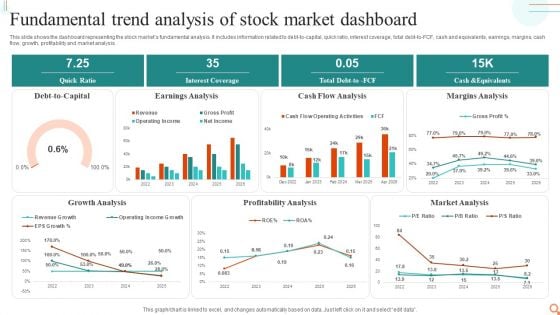
Fundamental Trend Analysis Of Stock Market Dashboard Professional PDF
This slide shows the dashboard representing the stock markets fundamental analysis. It includes information related to debt-to-capital, quick ratio, interest coverage, total debt-to-FCF, cash and equivalents, earnings, margins, cash flow, growth, profitability and market analysis.Showcasing this set of slides titled Fundamental Trend Analysis Of Stock Market Dashboard Professional PDF. The topics addressed in these templates are Earnings Analysis, Cash Flow Analysis, Margins Analysis. All the content presented in this PPT design is completely editable. Download it and make adjustments in color, background, font etc. as per your unique business setting.

Equity Analysis Project Table Of Content Ppt PowerPoint Presentation Infographic Template Example Introduction PDF
Presenting this set of slides with name equity analysis project table of content ppt powerpoint presentation infographic template example introduction pdf. This is a eight stage process. The stages in this process are executive summary, industry overview, target company highlights, financial ratio analysis, review and rating, about our company, risk factors, valuation analysis. This is a completely editable PowerPoint presentation and is available for immediate download. Download now and impress your audience.
Financial Procedure Dashboard Indicating Yearly Revenue Analysis Icons PDF
This slide illustrates finance process dashboard indicating yearly revenue analysis which contains gross profit margin, operating profit ratio, net profit, revenue and cost of goods sold cogs operating expenses, etc. It can be referred by company owners who can compare it with previous years performance and make related decisions for future. Showcasing this set of slides titled Financial Procedure Dashboard Indicating Yearly Revenue Analysis Icons PDF. The topics addressed in these templates are Operating Profit Percentage, Net Profit Percentage, Operating Profit Ratio. All the content presented in this PPT design is completely editable. Download it and make adjustments in color, background, font etc. as per your unique business setting.
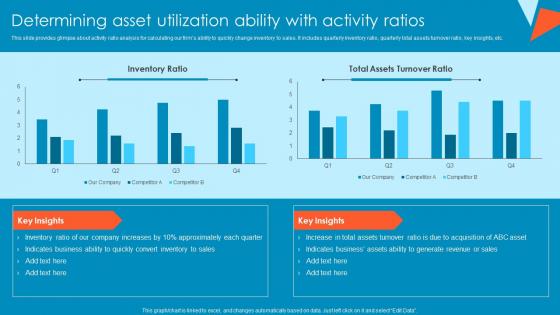
Determining Asset Utilization Ability With Activity Ratios Tactical Financial Governance Formats Pdf
This slide provides glimpse about activity ratio analysis for calculating our firms ability to quickly change inventory to sales. It includes quarterly inventory ratio, quarterly total assets turnover ratio, key insights, etc.Are you searching for a Determining Asset Utilization Ability With Activity Ratios Tactical Financial Governance Formats Pdf that is uncluttered, straightforward, and original Its easy to edit, and you can change the colors to suit your personal or business branding. For a presentation that expresses how much effort you have put in, this template is ideal. With all of its features, including tables, diagrams, statistics, and lists, its perfect for a business plan presentation. Make your ideas more appealing with these professional slides. Download Determining Asset Utilization Ability With Activity Ratios Tactical Financial Governance Formats Pdf from Slidegeeks today. This slide provides glimpse about activity ratio analysis for calculating our firms ability to quickly change inventory to sales. It includes quarterly inventory ratio, quarterly total assets turnover ratio, key insights, etc.
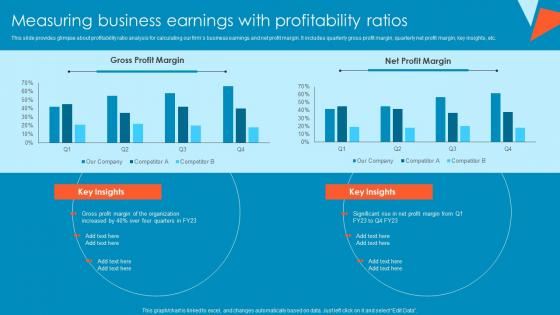
Measuring Business Earnings With Profitability Ratios Tactical Financial Governance Pictures Pdf
This slide provides glimpse about profitability ratio analysis for calculating our firms business earnings and net profit margin. It includes quarterly gross profit margin, quarterly net profit margin, key insights, etc.Create an editable Measuring Business Earnings With Profitability Ratios Tactical Financial Governance Pictures Pdf that communicates your idea and engages your audience. Whether you are presenting a business or an educational presentation, pre-designed presentation templates help save time. Measuring Business Earnings With Profitability Ratios Tactical Financial Governance Pictures Pdf is highly customizable and very easy to edit, covering many different styles from creative to business presentations. Slidegeeks has creative team members who have crafted amazing templates. So, go and get them without any delay. This slide provides glimpse about profitability ratio analysis for calculating our firms business earnings and net profit margin. It includes quarterly gross profit margin, quarterly net profit margin, key insights, etc.
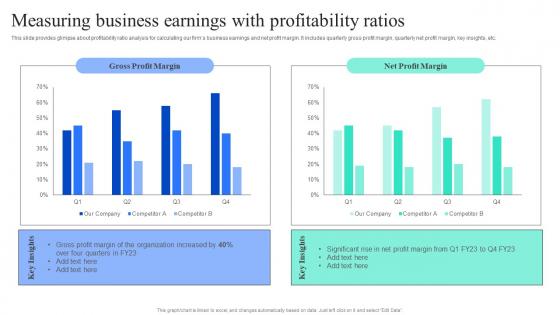
Strategic Financial Planning And Administration Measuring Business Earnings Profitability Ratios Designs PDF
This slide provides glimpse about profitability ratio analysis for calculating our firms business earnings and net profit margin. It includes quarterly gross profit margin, quarterly net profit margin, key insights, etc. Slidegeeks has constructed Strategic Financial Planning And Administration Measuring Business Earnings Profitability Ratios Designs PDF after conducting extensive research and examination. These presentation templates are constantly being generated and modified based on user preferences and critiques from editors. Here, you will find the most attractive templates for a range of purposes while taking into account ratings and remarks from users regarding the content. This is an excellent jumping-off point to explore our content and will give new users an insight into our top-notch PowerPoint Templates. This slide provides glimpse about profitability ratio analysis for calculating our firms business earnings and net profit margin. It includes quarterly gross profit margin, quarterly net profit margin, key insights, etc.
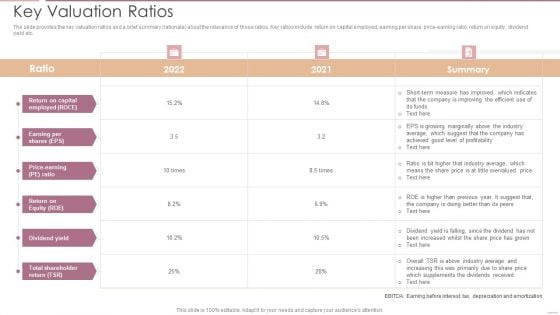
Investment Banking Security Underwriting Pitchbook Key Valuation Ratios Infographics PDF
The slide provides the key valuation ratios and a brief summary rationale about the relevance of those ratios. Key ratios include return on capital employed, earning per share, price-earning ratio, return on equity, dividend yield etc.Deliver and pitch your topic in the best possible manner with this Investment Banking Security Underwriting Pitchbook Key Valuation Ratios Infographics PDF Use them to share invaluable insights on Measure Improved, Dividends Received, Total Shareholder and impress your audience. This template can be altered and modified as per your expectations. So, grab it now.
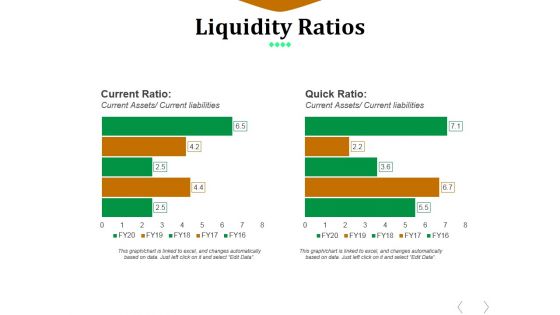
Liquidity Ratios Template 2 Ppt PowerPoint Presentation Inspiration File Formats
This is a liquidity ratios template 2 ppt powerpoint presentation inspiration file formats. This is a two stage process. The stages in this process are current ratio, quick ratio, current assets, current liabilities.
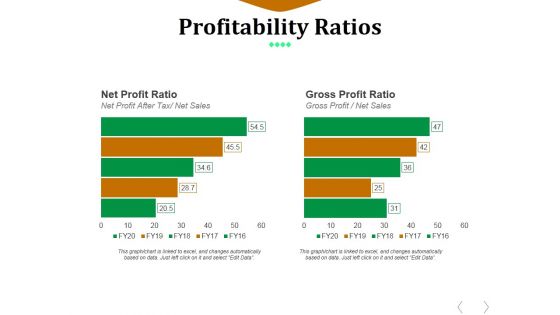
Profitability Ratios Template 2 Ppt PowerPoint Presentation Diagram Ppt
This is a profitability ratios template 2 ppt powerpoint presentation diagram ppt. This is a two stage process. The stages in this process are net profit ratio, gross profit ratio, net profit after tax, net sales.

Solvency Ratios Template 2 Ppt PowerPoint Presentation File Example File
This is a solvency ratios template 2 ppt powerpoint presentation file example file. This is a two stage process. The stages in this process are debt equity ratio, time interest earned ratio, total liabilities, total equity, ebit, interest expense.
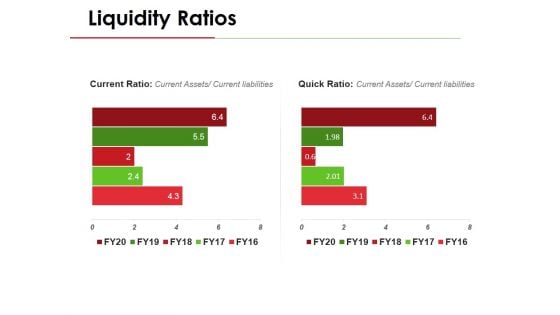
Liquidity Ratios Template 2 Ppt PowerPoint Presentation Show Vector
This is a liquidity ratios template 2 ppt powerpoint presentation show vector. This is a two stage process. The stages in this process are quick ratio, current ratio, current assets, current liabilities.
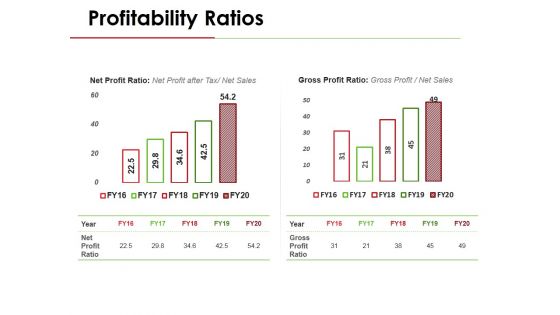
Profitability Ratios Template 1 Ppt PowerPoint Presentation Inspiration Graphics Pictures
This is a profitability ratios template 1 ppt powerpoint presentation inspiration graphics pictures. This is a two stage process. The stages in this process are net profit ratio, net profit after tax, net sales, gross profit ratio.
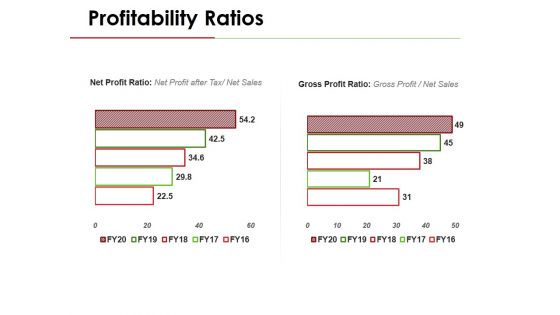
Profitability Ratios Template 2 Ppt PowerPoint Presentation Professional Slide
This is a profitability ratios template 2 ppt powerpoint presentation professional slide. This is a two stage process. The stages in this process are net profit ratio, net profit after tax, net sales, gross profit ratio.
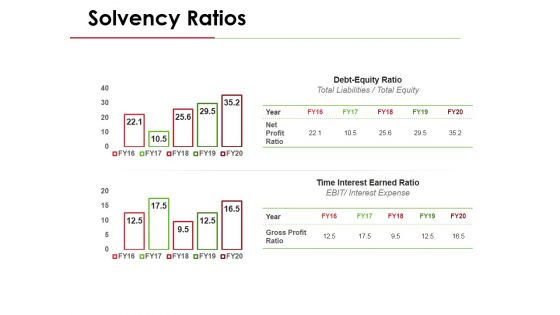
Solvency Ratios Template 1 Ppt PowerPoint Presentation Portfolio Display
This is a solvency ratios template 1 ppt powerpoint presentation portfolio display. This is a two stage process. The stages in this process are debt equity ratio, total liabilities, total equity, time interest earned ratio, ebit, interest expense.
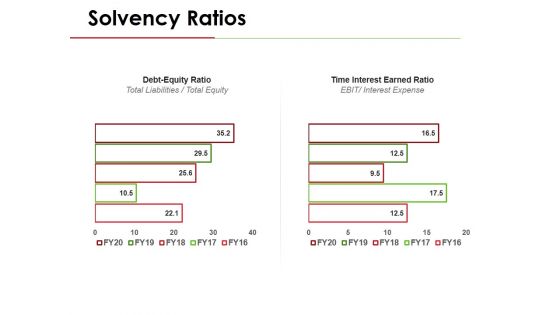
Solvency Ratios Template 2 Ppt PowerPoint Presentation Pictures Ideas
This is a solvency ratios template 2 ppt powerpoint presentation pictures ideas. This is a two stage process. The stages in this process are debt equity ratio, total liabilities, total equity, time interest earned ratio, ebit, interest expense.
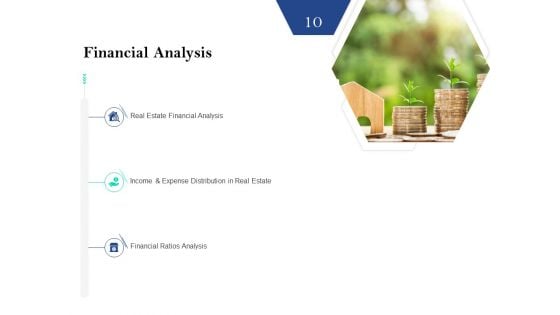
Property Investment Strategies Financial Analysis Ppt PowerPoint Presentation Outline Ideas PDF
Presenting property investment strategies financial analysis ppt powerpoint presentation outline ideas pdf. to provide visual cues and insights. Share and navigate important information on three stages that need your due attention. This template can be used to pitch topics like real estate financial analysis, income and expense distribution in real estate, financial ratios analysis. In addtion, this PPT design contains high resolution images, graphics, etc, that are easily editable and available for immediate download.
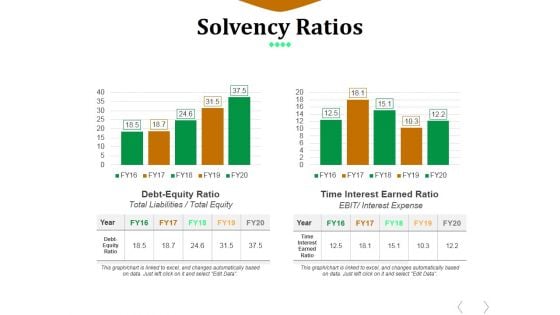
Solvency Ratios Template 1 Ppt PowerPoint Presentation File Gallery
This is a solvency ratios template 1 ppt powerpoint presentation file gallery. This is a two stage process. The stages in this process are debt equity, time interest earned ratio, total liabilities, total equity, ebit, interest expense.
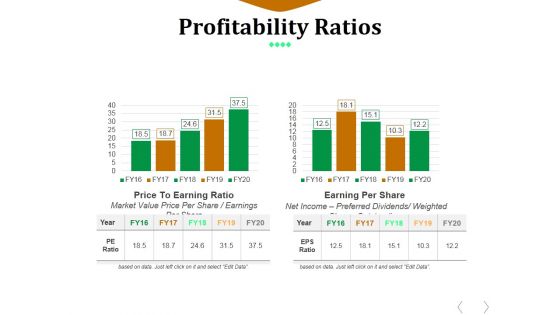
Profitability Ratios Template 3 Ppt PowerPoint Presentation Ideas Layout Ideas
This is a profitability ratios template 3 ppt powerpoint presentation ideas layout ideas. This is a two stage process. The stages in this process are price to earning ratio, earning per share, market value price per share, earnings per share, preferred dividends, weighted shares outstanding.
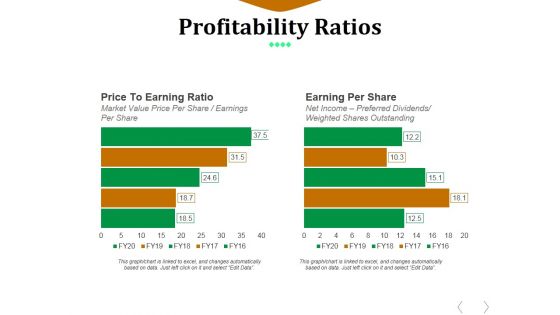
Profitability Ratios Template 4 Ppt PowerPoint Presentation Pictures Background Image
This is a profitability ratios template 4 ppt powerpoint presentation pictures background image. This is a two stage process. The stages in this process are price to earning ratio, earning per share, market value price per share, earnings per share, preferred dividends, weighted shares outstanding.
Profitability Ratios Template 3 Ppt PowerPoint Presentation Gallery Icon
This is a profitability ratios template 3 ppt powerpoint presentation gallery icon. This is a two stage process. The stages in this process are price to earning ratio, market value price per share, earnings per share, net income, preferred dividends, weighted shares outstanding.
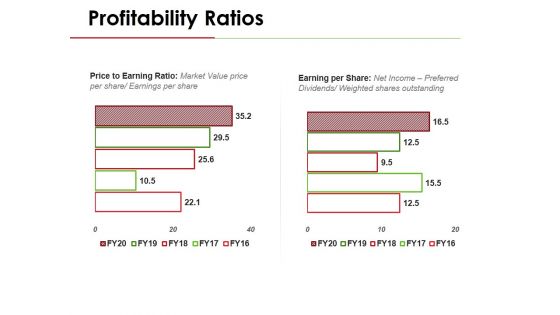
Profitability Ratios Template 4 Ppt PowerPoint Presentation Outline Designs
This is a profitability ratios template 4 ppt powerpoint presentation outline designs. This is a two stage process. The stages in this process are price to earning ratio, market value price per share, earnings per share, net income, preferred dividends, weighted shares outstanding.
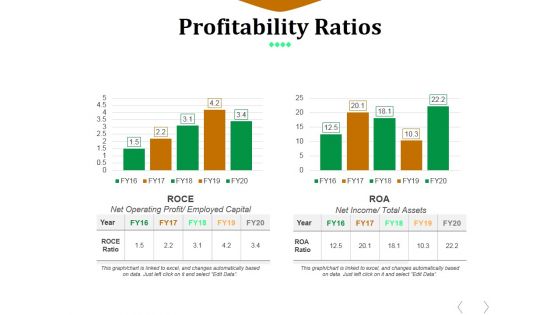
Profitability Ratios Template 5 Ppt PowerPoint Presentation Model Clipart Images
This is a profitability ratios template 5 ppt powerpoint presentation model clipart images. This is a two stage process. The stages in this process are net operating profit, employed capital, net income, total assets.
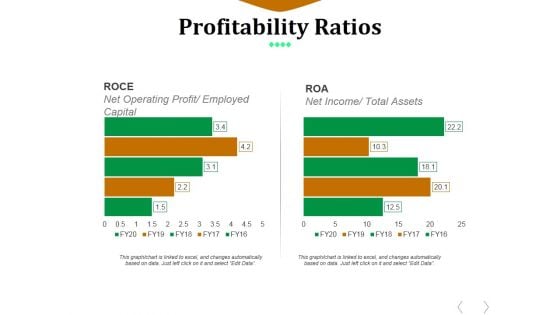
Profitability Ratios Template 6 Ppt PowerPoint Presentation File Infographic Template
This is a profitability ratios template 6 ppt powerpoint presentation file infographic template. This is a two stage process. The stages in this process are net operating profit, employed capital, net income, total assets.

Activity Ratios Template 2 Ppt PowerPoint Presentation Layouts Clipart Images
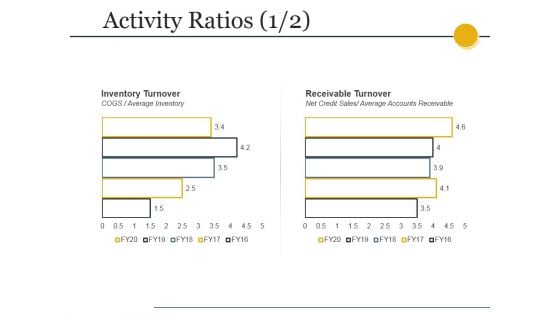
This is a activity ratios template 2 ppt powerpoint presentation layouts clipart images. This is a two stage process. The stages in this process are inventory turnover, receivables turnover, avg inventory, net credit sales, average accounts receivable.
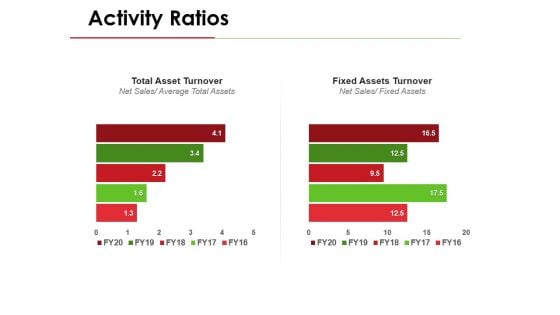
Activity Ratios Template 4 Ppt PowerPoint Presentation Ideas Objects
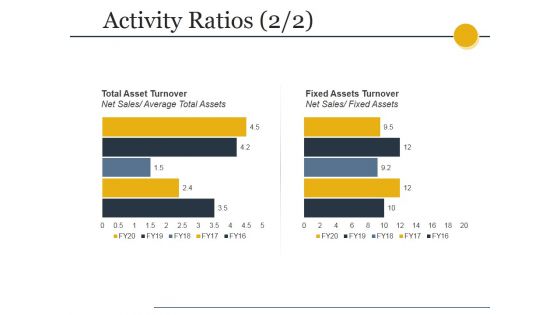
This is a activity ratios template 4 ppt powerpoint presentation ideas objects. This is a two stage process. The stages in this process are total asset turnover, net sales, average total assets, fixed assets turnover, fixed assets.
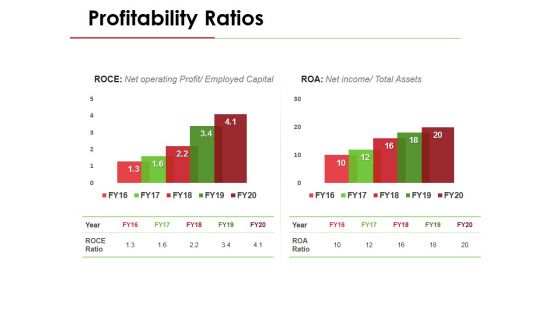
Profitability Ratios Template 5 Ppt PowerPoint Presentation File Elements
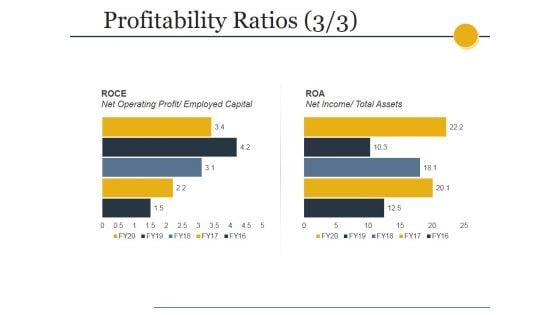
This is a profitability ratios template 5 ppt powerpoint presentation file elements. This is a two stage process. The stages in this process are roce, net operating profit, employed capital, net income, total assets.
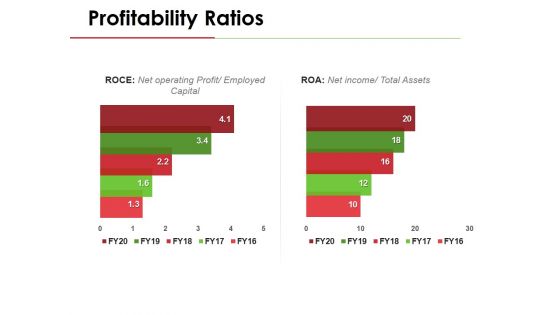
Profitability Ratios Template 6 Ppt PowerPoint Presentation Pictures Structure
This is a profitability ratios template 6 ppt powerpoint presentation pictures structure. This is a two stage process. The stages in this process are roce, net operating profit, employed capital, net income, total assets.
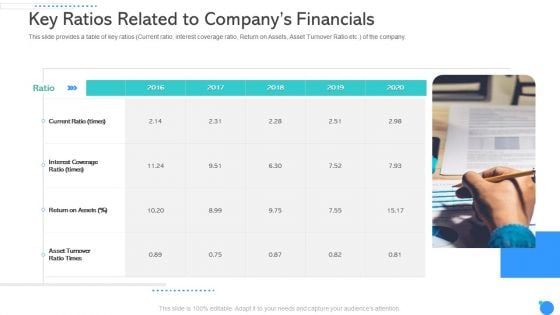
Key Ratios Related To Companys Financials Ppt Show Portfolio PDF
This slide provides a table of key ratios Current ratio, interest coverage ratio, Return on Assets, Asset Turnover Ratio etc. of the company. Presenting key ratios related to companys financials ppt show portfolio pdf to provide visual cues and insights. Share and navigate important information on one stage that need your due attention. This template can be used to pitch topics like current ratio, interest coverage ratio, return on assets. In addtion, this PPT design contains high resolution images, graphics, etc, that are easily editable and available for immediate download.
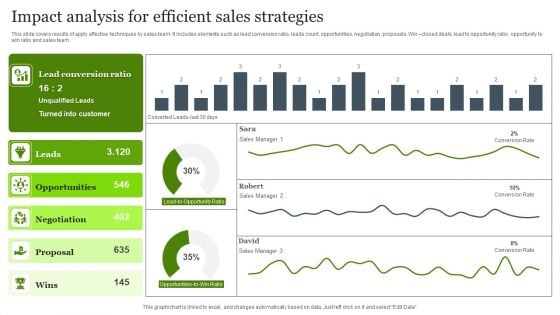
Impact Analysis For Efficient Sales Strategies Diagrams PDF
This slide covers results of apply effective techniques by sales team. It includes elements such as lead conversion ratio, leads count, opportunities, negotiation, proposals. Win closed deals, lead to opportunity ratio, opportunity to win ratio and sales team. Pitch your topic with ease and precision using this Impact Analysis For Efficient Sales Strategies Diagrams PDF. This layout presents information on Customer, Opportunities, Efficient Sales Strategies. It is also available for immediate download and adjustment. So, changes can be made in the color, design, graphics or any other component to create a unique layout.
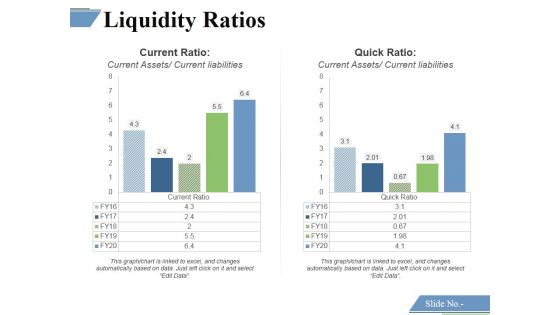
Liquidity Ratios Template 1 Ppt PowerPoint Presentation Outline Themes
This is a liquidity ratios template 1 ppt powerpoint presentation outline themes. This is a two stage process. The stages in this process are current ratio, quick ratio.
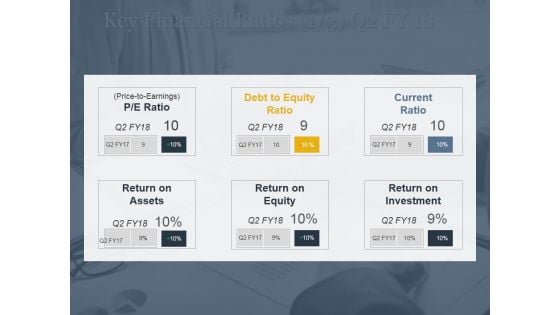
Key Financial Ratios Ppt PowerPoint Presentation Model Objects
This is a key financial ratios ppt powerpoint presentation model objects. This is a three stage process. The stages in this process are p e ratio, price to earnings, debt, equity ratio, current, ratio.
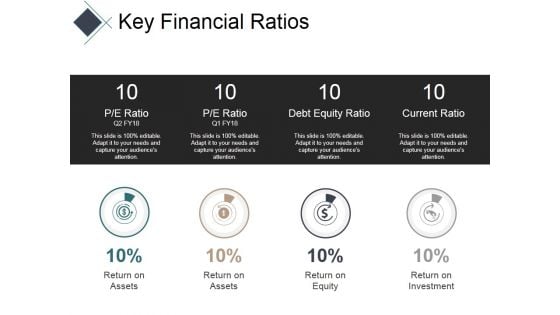
Key Financial Ratios Ppt PowerPoint Presentation Summary Inspiration
This is a key financial ratios ppt powerpoint presentation summary inspiration. This is a four stage process. The stages in this process are pe ratio, debt equity ratio, current ratio.
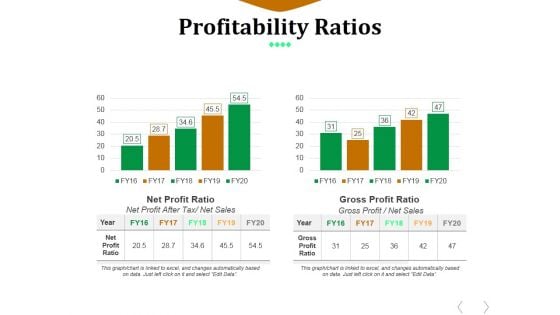
Profitability Ratios Template 1 Ppt PowerPoint Presentation Outline Information
This is a profitability ratios template 1 ppt powerpoint presentation outline information. This is a two stage process. The stages in this process are net profit ratio, gross profit ratio, net profit after tax, net sales.
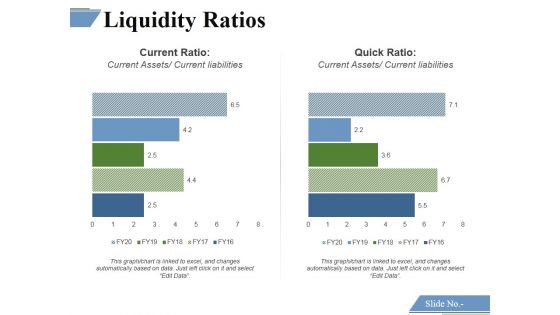
Liquidity Ratios Template 2 Ppt PowerPoint Presentation File Topics
This is a liquidity ratios template 2 ppt powerpoint presentation file topics. This is a two stage process. The stages in this process are current ratio, quick ratio, current assets current liabilities, current assets current liabilities.
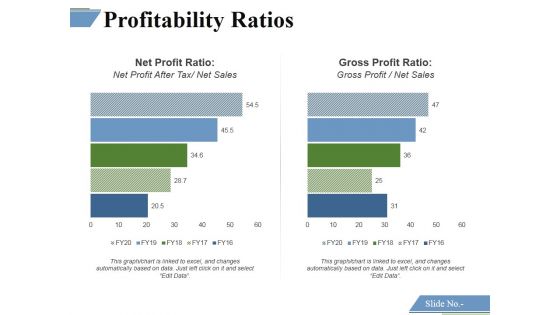
Profitability Ratios Template 1 Ppt PowerPoint Presentation Outline Deck
This is a profitability ratios template 1 ppt powerpoint presentation outline deck. This is a two stage process. The stages in this process are net profit ratio, gross profit ratio.
Profitability Ratios Template 2 Ppt PowerPoint Presentation Icon Diagrams
This is a profitability ratios template 2 ppt powerpoint presentation icon diagrams. This is a two stage process. The stages in this process are net profit ratio, gross profit ratio.
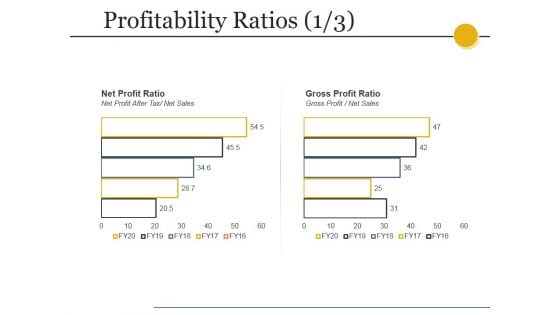
Profitability Ratios Template Ppt PowerPoint Presentation Styles Slide
This is a profitability ratios template ppt powerpoint presentation styles slide. This is a two stage process. The stages in this process are net profit ratio, net profit after tax net sales, gross profit ratio, gross profit net sales.

Activity Ratios Template 1 Ppt PowerPoint Presentation Clipart
This is a activity ratios template 1 ppt powerpoint presentation clipart. This is a two stage process. The stages in this process are business, marketing, finance, growth, analysis.
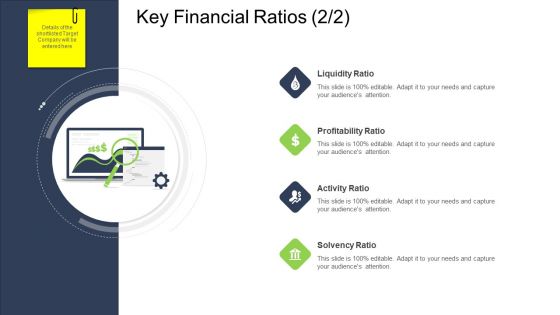
Tactical Merger Key Financial Ratios Activity Ppt Slides Objects PDF
Presenting tactical merger key financial ratios activity ppt slides objects pdf to provide visual cues and insights. Share and navigate important information on four stages that need your due attention. This template can be used to pitch topics like liquidity ratio, profitability ratio, activity ratio, solvency ratio. In addition, this PPT design contains high-resolution images, graphics, etc, that are easily editable and available for immediate download.
Amalgamation Acquisitions Key Financial Ratios Ppt Layouts Icon PDF
This is a amalgamation acquisitions key financial ratios ppt layouts icon pdf template with various stages. Focus and dispense information on four stages using this creative set, that comes with editable features. It contains large content boxes to add your information on topics like liquidity ratio, profitability ratio, activity ratio, solvency ratio. You can also showcase facts, figures, and other relevant content using this PPT layout. Grab it now.
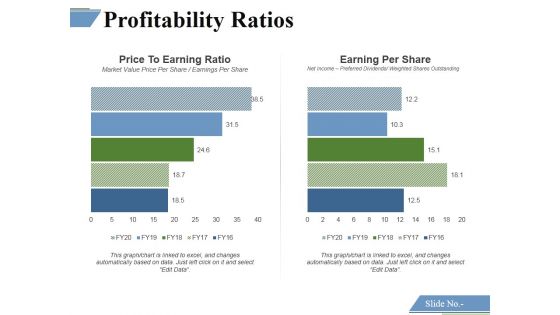
Profitability Ratios Template 3 Ppt PowerPoint Presentation Summary Files
This is a profitability ratios template 3 ppt powerpoint presentation summary files. This is a two stage process. The stages in this process are price to earning ratio, earning per share.

Profitability Ratios Template 4 Ppt PowerPoint Presentation Ideas Graphic Images
This is a profitability ratios template 4 ppt powerpoint presentation ideas graphic images. This is a two stage process. The stages in this process are price to earning ratio, earning per share.
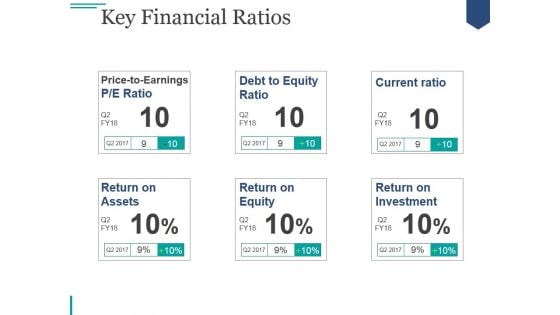
Key Financial Ratios Template 2 Ppt PowerPoint Presentation Inspiration
This is a key financial ratios template 2 ppt powerpoint presentation inspiration. This is a six stage process. The stages in this process are price to earnings, debt to equity ratio, current ratio, return on, assets, return on equity, return on, investment.
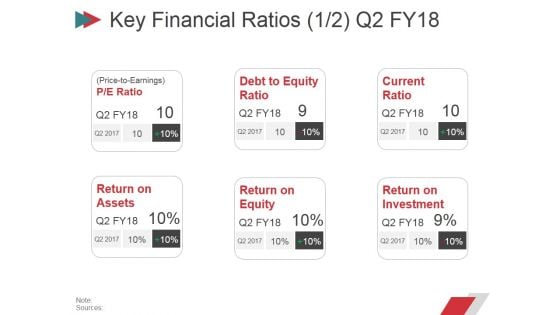
Key Financial Ratios Ppt PowerPoint Presentation Infographic Template Structure
This is a key financial ratios ppt powerpoint presentation infographic template structure. This is a six stage process. The stages in this process are price to earnings, debt to equity ratio, current ratio, return on, assets, return on , equity, return on investment.

Activity Ratios Template 2 Ppt PowerPoint Presentation Design Templates
This is a activity ratios template 2 ppt powerpoint presentation design templates. This is a two stage process. The stages in this process are business, marketing, finance, growth, analysis.
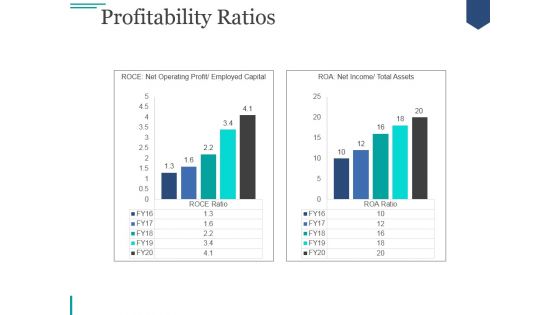
Profitability Ratios Template 2 Ppt PowerPoint Presentation Professional
This is a profitability ratios template 2 ppt powerpoint presentation professional. This is a two stage process. The stages in this process are graph, business, marketing, strategy, growth.
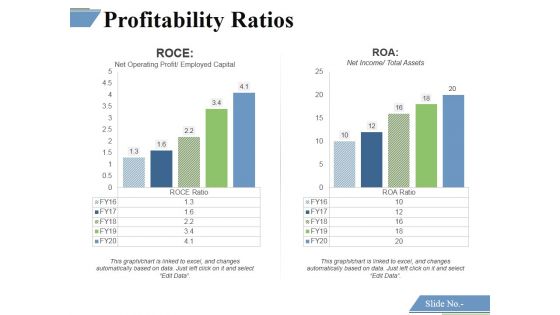
Profitability Ratios Template 6 Ppt PowerPoint Presentation Portfolio Graphics
This is a profitability ratios template 6 ppt powerpoint presentation portfolio graphics. This is a two stage process. The stages in this process are roce, roa.
Key Financial Ratios Template Ppt PowerPoint Presentation Icon
This is a key financial ratios template ppt powerpoint presentation icon. This is a four stage process. The stages in this process are business, marketing, planning, strategy, finance.
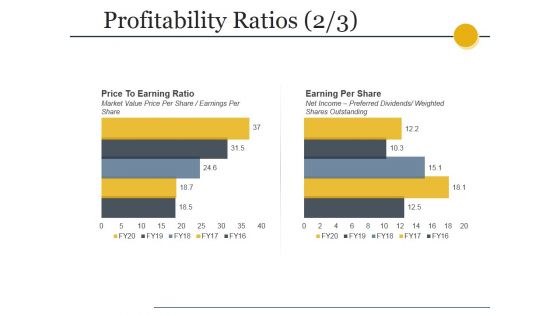
Profitability Ratios Template 2 Ppt PowerPoint Presentation Gallery Designs
This is a profitability ratios template 2 ppt powerpoint presentation gallery designs. This is a two stage process. The stages in this process are price to earning ratio, market value price per share earnings per share, earning per share, net income preferred dividends, weighted shares outstanding.
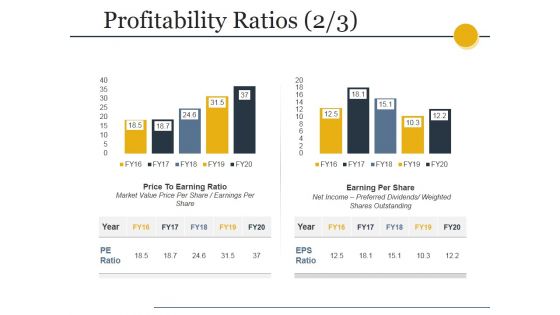
Profitability Ratios Template 4 Ppt PowerPoint Presentation Professional Deck
This is a profitability ratios template 4 ppt powerpoint presentation professional deck. This is a two stage process. The stages in this process are price to earning ratio, market value price per share earnings per share, earning per share, net income preferred dividends, weighted shares outstanding.
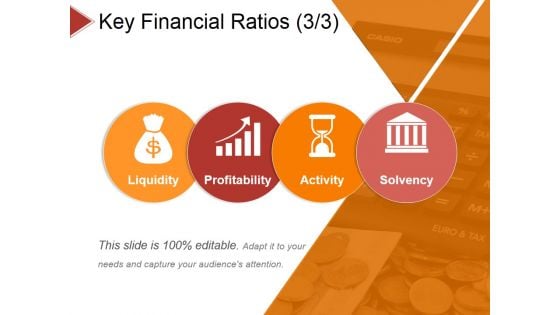
Key Financial Ratios Template 3 Ppt PowerPoint Presentation Summary Sample
This is a key financial ratios template 3 ppt powerpoint presentation summary sample. This is a four stage process. The stages in this process are liquidity, profitability, activity, solvency.
Activity Ratios Template 1 Ppt PowerPoint Presentation Outline Design Templates
This is a activity ratios template 1 ppt powerpoint presentation outline design templates. This is a two stage process. The stages in this process are inventory turnover, receivable turnover, graph, success, growth.
Activity Ratios Template 3 Ppt PowerPoint Presentation Professional Example
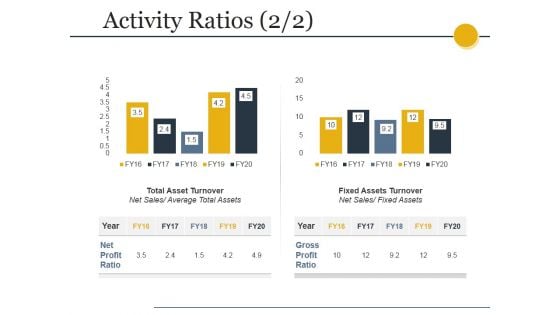
This is a activity ratios template 3 ppt powerpoint presentation professional example. This is a two stage process. The stages in this process are total asset turnover, net sales, fixed assets turnover, fixed assets.
Activity Ratios Template Ppt PowerPoint Presentation Summary Slides
This is a activity ratios template ppt powerpoint presentation summary slides. This is a two stage process. The stages in this process are total asset turnover, net sales, fixed assets turnover, fixed assets.
Profitability Ratios Template 3 Ppt PowerPoint Presentation Show Graphics Download
This is a profitability ratios template 3 ppt powerpoint presentation show graphics download. This is a two stage process. The stages in this process are roce, net operating profit, employed capital, roa, net income, total assets.
Competitive Analysis Of Geo Energy Company For 2021 Icons PDF
This slide shows the competitive analysis of GEO Energy Company with other similar line competitors on the bases of certain parameters such as Revenue , Return on Investment, Performance Ratio , Wind Energy Level , Plant Availability, Market Share etc. Deliver an awe inspiring pitch with this creative competitive analysis of geo energy company for 2021 icons pdf bundle. Topics like revenue, return on investment, performance ratio, plant availability, employees can be discussed with this completely editable template. It is available for immediate download depending on the needs and requirements of the user.


 Continue with Email

 Home
Home


