Ratio
Ratio Analysis Efficiency Rations Ppt Powerpoint Presentation Icon Professional
This is a ratio analysis efficiency rations ppt powerpoint presentation icon professional. This is a six stage process. The stages in this process are ratio analysis, efficiency ratios, coverage ratios, market prospect ratios, liquidity ratios.
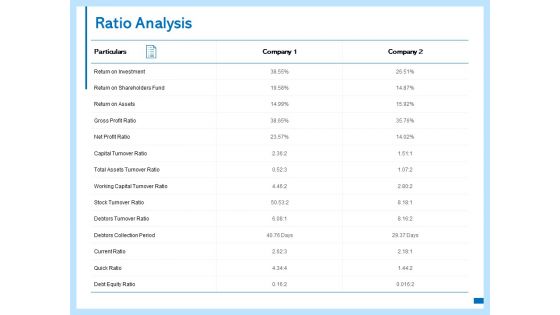
Ratio Analysis Investment Ppt PowerPoint Presentation Pictures Summary
Presenting this set of slides with name ratio analysis investment ppt powerpoint presentation pictures summary. The topics discussed in these slides are investment, return, assets, gross profit ratio, net profit ratio, capital turnover ratio, working capital turnover ratio, debt equity ratio. This is a completely editable PowerPoint presentation and is available for immediate download. Download now and impress your audience.
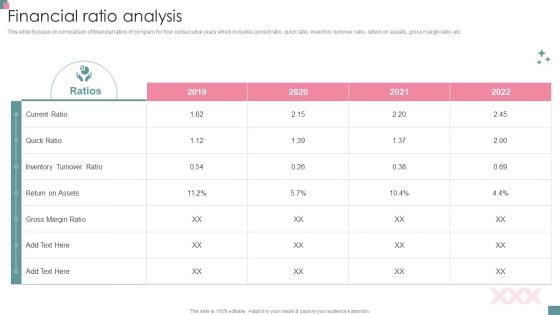
Small Business Venture Company Profile Financial Ratio Analysis Pictures PDF
This slide focuses on comparison of financial ratios of company for four consecutive years which includes current ratio, quick ratio, inventory turnover ratio, return on assets, gross margin ratio, etc. Deliver an awe inspiring pitch with this creative Small Business Venture Company Profile Financial Ratio Analysis Pictures PDF bundle. Topics like Inventory Turnover, Gross Margin, Quick Ratio can be discussed with this completely editable template. It is available for immediate download depending on the needs and requirements of the user.
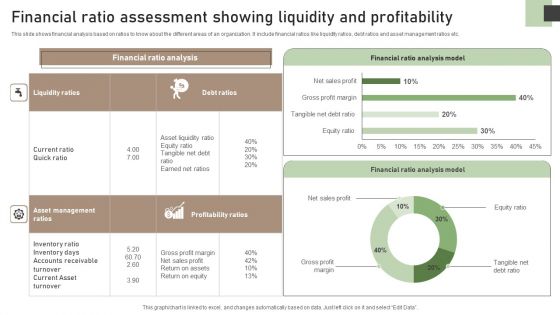
Financial Ratio Assessment Showing Liquidity And Profitability Brochure PDF
This slide shows financial analysis based on ratios to know about the different areas of an organization. It include financial ratios like liquidity ratios, debt ratios and asset management ratios etc. Showcasing this set of slides titled Financial Ratio Assessment Showing Liquidity And Profitability Brochure PDF. The topics addressed in these templates are Financial Ratio Analysis, Equity Ratio, Tangible Net Debt Ratio. All the content presented in this PPT design is completely editable. Download it and make adjustments in color, background, font etc. as per your unique business setting.
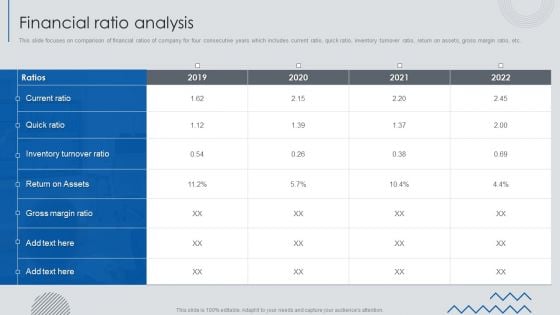
Information Technology Solutions Business Profile Financial Ratio Analysis Clipart PDF
This slide focuses on comparison of financial ratios of company for four consecutive years which includes current ratio, quick ratio, inventory turnover ratio, return on assets, gross margin ratio, etc. Deliver an awe inspiring pitch with this creative Information Technology Solutions Business Profile Financial Ratio Analysis Clipart PDF bundle. Topics like Return On Assets, Gross Margin, Inventory Turnover can be discussed with this completely editable template. It is available for immediate download depending on the needs and requirements of the user.
IT Consultancy Services Company Profile Financial Ratio Analysis Diagrams PDF
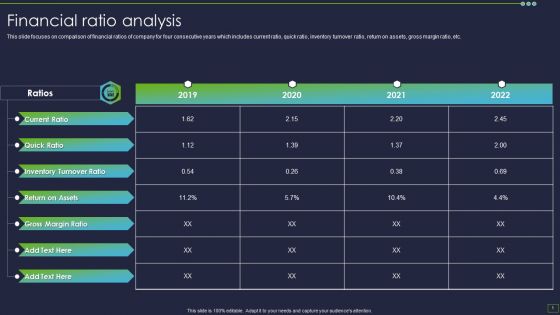
This slide focuses on comparison of financial ratios of company for four consecutive years which includes current ratio, quick ratio, inventory turnover ratio, return on assets, gross margin ratio, etc. Deliver an awe inspiring pitch with this creative IT Consultancy Services Company Profile Financial Ratio Analysis Diagrams PDF bundle. Topics like Inventory Turnover, Return On Assets, Gross Margin can be discussed with this completely editable template. It is available for immediate download depending on the needs and requirements of the user.

Solvency Ratio Example Ppt Powerpoint Presentation Inspiration Gallery Cpb
This is a solvency ratio example ppt powerpoint presentation inspiration gallery cpb. This is a four stage process. The stages in this process are solvency ratio example.
Solvability Ratio Ppt Powerpoint Presentation Summary Shapes Cpb
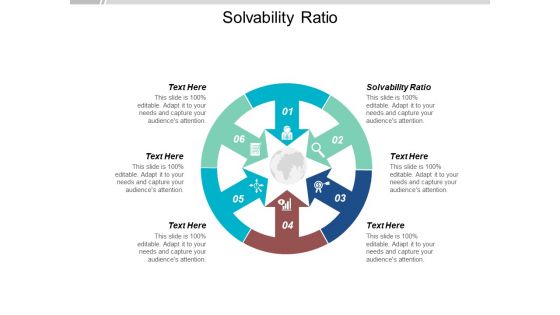
This is a solvability ratio ppt powerpoint presentation summary shapes cpb. This is a six stage process. The stages in this process are solvability ratio.
Equity Ratio Ppt Powerpoint Presentation Infographics Templates Cpb
This is a equity ratio ppt powerpoint presentation infographics templates cpb. This is a four stage process. The stages in this process are equity ratio.
Debt Equity Ratio Ppt PowerPoint Presentation Slides Show Cpb
This is a debt equity ratio ppt powerpoint presentation slides show cpb. This is a three stage process. The stages in this process are debt equity ratio.
Employee Turnover Ratio Ppt PowerPoint Presentation Show Rules Cpb
This is a employee turnover ratio ppt powerpoint presentation show rules cpb. This is a five stage process. The stages in this process are employee turnover ratio.
Retail Industry Ratio Ppt PowerPoint Presentation Show Layout Cpb
This is a retail industry ratio ppt powerpoint presentation show layout cpb. This is a four stage process. The stages in this process are retail industry ratio.
Loan Value Ratio Ppt PowerPoint Presentation Styles Background Images Cpb
This is a loan value ratio ppt powerpoint presentation styles background images cpb. This is a six stage process. The stages in this process are loan value ratio.
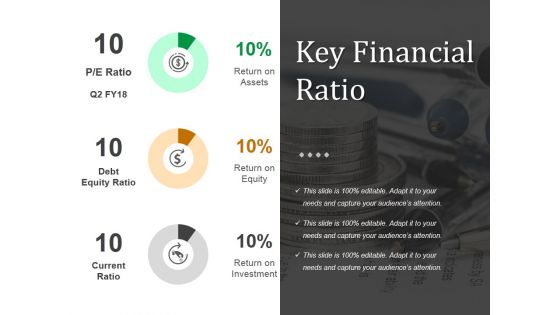
Key Financial Ratio Template 2 Ppt PowerPoint Presentation Gallery Demonstration
This is a key financial ratio template 2 ppt powerpoint presentation gallery demonstration. This is a three stage process. The stages in this process are pe ratio, return on assets, debt equity ratio, return on equity, current ratio, return on investment.
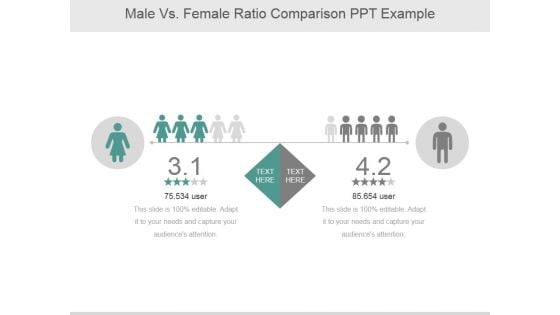
Male Vs Female Ratio Comparison Ppt PowerPoint Presentation Background Image
This is a male vs female ratio comparison ppt powerpoint presentation background image. This is a two stage process. The stages in this process are male, female, comparison, ratio, present.

Cac Ratio Ppt PowerPoint Presentation Complete Deck With Slides
This is a cac ratio ppt powerpoint presentation complete deck with slides. This is a one stage process. The stages in this process are cac, ratio, business, management, marketing.
Equity Asset Ratio Formula Ppt Powerpoint Presentation Ideas Influencers Cpb
This is a equity asset ratio formula ppt powerpoint presentation ideas influencers cpb. This is a three stage process. The stages in this process are equity asset ratio formula.

Debt Vs Equity Ratio Ppt PowerPoint Presentation Layouts Show Cpb
This is a debt vs equity ratio ppt powerpoint presentation layouts show cpb. This is a five stage process. The stages in this process are debt vs equity ratio.
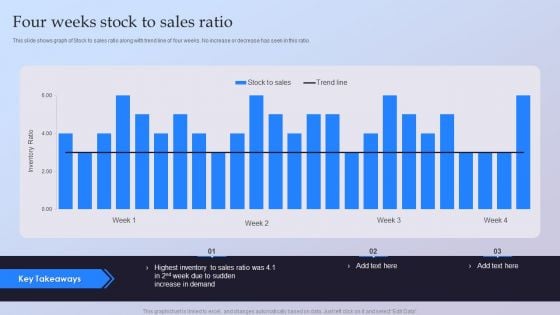
Four Weeks Stock To Sales Ratio Ppt Ideas Guide PDF
This slide shows graph of Stock to sales ratio along with trend line of four weeks. No increase or decrease has seen in this ratio. Pitch your topic with ease and precision using this Four Weeks Stock To Sales Ratio Ppt Ideas Guide PDF. This layout presents information on Highest Inventory, Sales Ratio, Increase Demand. It is also available for immediate download and adjustment. So, changes can be made in the color, design, graphics or any other component to create a unique layout.
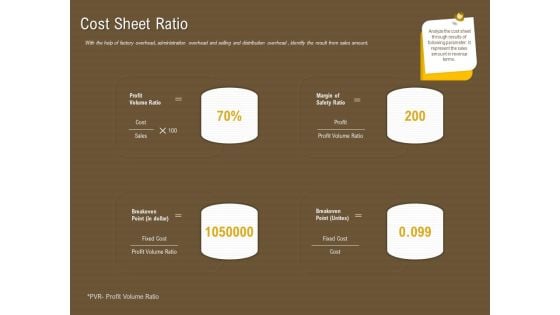
Managerial Accounting System Cost Sheet Ratio Ppt Summary Guidelines PDF
Presenting this set of slides with name managerial accounting system cost sheet ratio ppt summary guidelines pdf. This is a four stage process. The stages in this process are profit volume ratio, margin of safety ratio, breakeven point. This is a completely editable PowerPoint presentation and is available for immediate download. Download now and impress your audience.
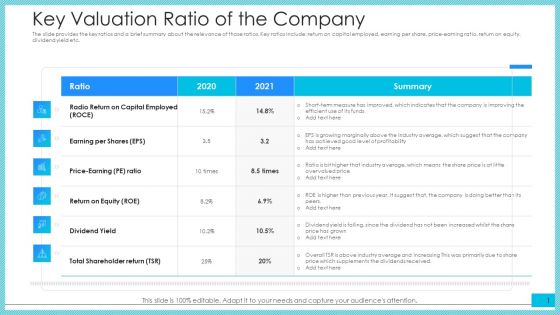
Key Valuation Ratio Of The Company Ppt Model Outline PDF
The slide provides the key ratios and a brief summary about the relevance of those ratios. Key ratios include return on capital employed, earning per share, price earning ratio, return on equity, dividend yield etc.Deliver an awe-inspiring pitch with this creative key valuation ratio of the company ppt model outline pdf. bundle. Topics like radio return on capital employed, return on equity can be discussed with this completely editable template. It is available for immediate download depending on the needs and requirements of the user.
Key Valuation Ratio Of The Company Ppt File Icons PDF
The slide provides the key ratios and a brief summary about the relevance of those ratios. Key ratios include return on capital employed, earning per share, price earning ratio, return on equity, dividend yield etc.Deliver an awe inspiring pitch with this creative key valuation ratio of the company ppt file icons pdf.bundle.Topics like radio return on capital employed, return on equity can be discussed with this completely editable template. It is available for immediate download depending on the needs and requirements of the user.
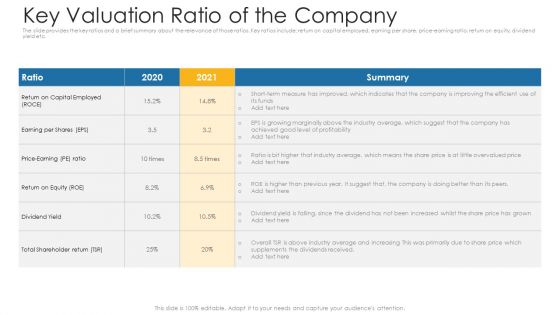
Key Valuation Ratio Of The Company Ppt Outline Format PDF
The slide provides the key ratios and a brief summary about the relevance of those ratios. Key ratios include return on capital employed, earning per share, price-earning ratio, return on equity, dividend yield etc.Deliver and pitch your topic in the best possible manner with this key valuation ratio of the company ppt outline format pdf. Use them to share invaluable insights on radio return on capital employed, return on equity and impress your audience. This template can be altered and modified as per your expectations. So, grab it now.
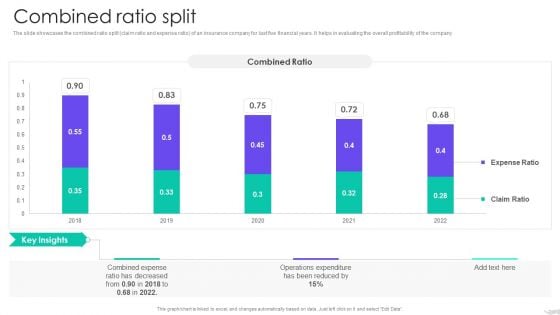
Insurance Services Firm Profile Combined Ratio Split Download PDF
The slide showcases the combined ratio split claim ratio and expense ratio of an insurance company for last five financial years. It helps in evaluating the overall profitability of the company Deliver and pitch your topic in the best possible manner with this Insurance Services Firm Profile Combined Ratio Split Download PDF . Use them to share invaluable insights on Combined Expense, Operations Expenditure, Combined Ratio and impress your audience. This template can be altered and modified as per your expectations. So, grab it now.
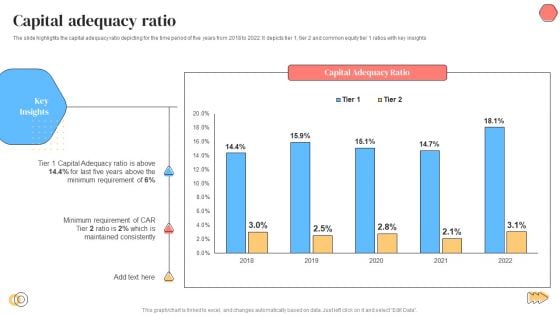
Banking Solutions Company Overview Capital Adequacy Ratio Diagrams PDF
The slide highlights the capital adequacy ratio depicting for the time period of five years from 2018 to 2022. It depicts tier 1, tier 2 and common equity tier 1 ratios with key insights. Deliver an awe inspiring pitch with this creative Banking Solutions Company Overview Capital Adequacy Ratio Diagrams PDF bundle. Topics like Capital Adequacy Ratio, Minimum Requirement, Capital Adequacy Ratio can be discussed with this completely editable template. It is available for immediate download depending on the needs and requirements of the user.
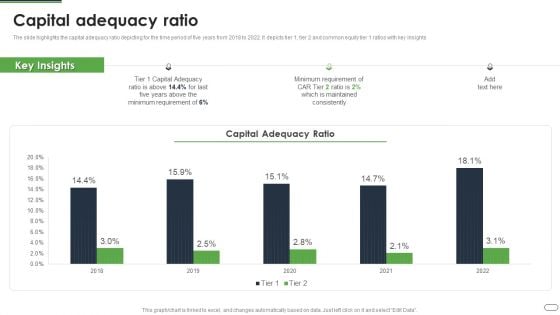
Financial Solutions Company Profile Capital Adequacy Ratio Information PDF
The slide highlights the capital adequacy ratio depicting for the time period of five years from 2018 to 2022. It depicts tier 1, tier 2 and common equity tier 1 ratios with key insights Deliver an awe inspiring pitch with this creative Financial Solutions Company Profile Capital Adequacy Ratio Information PDF bundle. Topics like Minimum Requirement, Capital Adequacy, Minimum Requirement can be discussed with this completely editable template. It is available for immediate download depending on the needs and requirements of the user.
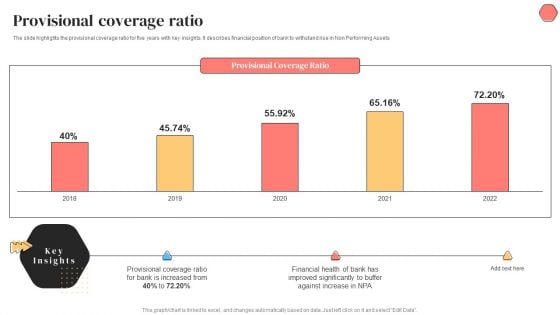
Banking Solutions Company Overview Provisional Coverage Ratio Guidelines PDF
The slide highlights the provisional coverage ratio for five years with key insights. It describes financial position of bank to withstand rise in Non Performing Assets. Deliver an awe inspiring pitch with this creative Banking Solutions Company Overview Provisional Coverage Ratio Guidelines PDF bundle. Topics like Provisional Coverage Ratio, Financial Health can be discussed with this completely editable template. It is available for immediate download depending on the needs and requirements of the user.
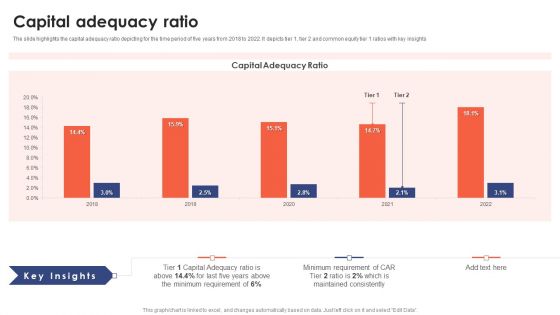
Banking Institution Company Profile Capital Adequacy Ratio Infographics PDF
The slide highlights the capital adequacy ratio depicting for the time period of five years from 2018 to 2022. It depicts tier 1, tier 2 and common equity tier 1 ratios with key insights.Deliver an awe inspiring pitch with this creative Banking Institution Company Profile Capital Adequacy Ratio Infographics PDF bundle. Topics like Capital Adequacy, Minimum Requirement, Maintained Consistently can be discussed with this completely editable template. It is available for immediate download depending on the needs and requirements of the user.
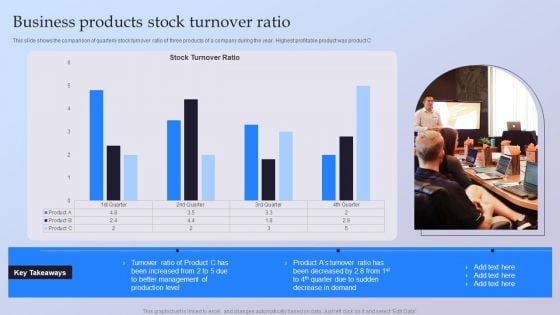
Business Products Stock Turnover Ratio Ppt File Aids PDF
This slide shows the comparison of quarterly stock turnover ratio of three products of a company during the year. Highest profitable product was product C Pitch your topic with ease and precision using this Business Products Stock Turnover Ratio Ppt File Aids PDF. This layout presents information on Better Management, Production Level, Turnover Ratio. It is also available for immediate download and adjustment. So, changes can be made in the color, design, graphics or any other component to create a unique layout.
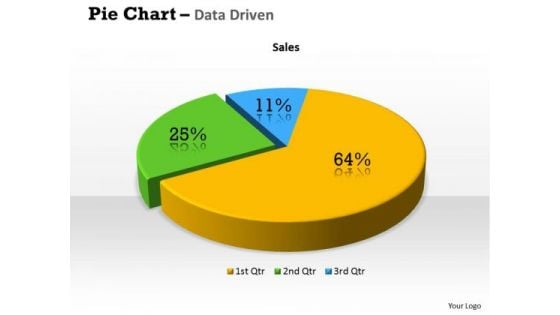
Quantitative Data Analysis 3d Percentage Ratio Pie Chart PowerPoint Templates
Plan Your Storyboard With Our quantitative data analysis 3d percentage ratio pie chart Powerpoint Templates . Give An Outline To The Solutions You Have.
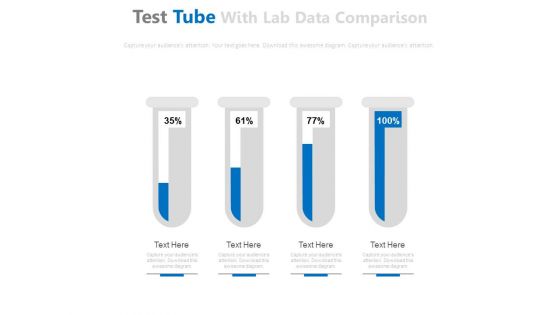
Test Tubes For Financial Ratio Analysis Powerpoint Slides
This PowerPoint template has been designed with graphics of test tubes. Use this PPT slide to depict financial ratio analysis. Download this PPT template to make impressive presentations.
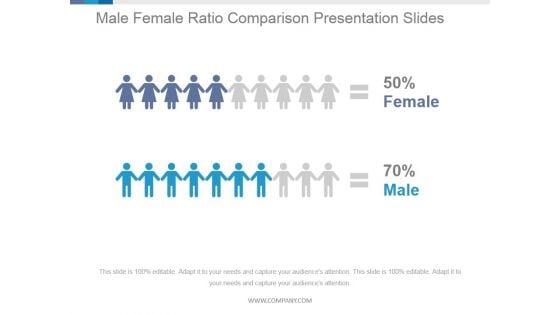
Male Female Ratio Comparison Ppt PowerPoint Presentation Picture
This is a male female ratio comparison ppt powerpoint presentation picture. This is a two stage process. The stages in this process are female, male, finance, compare.
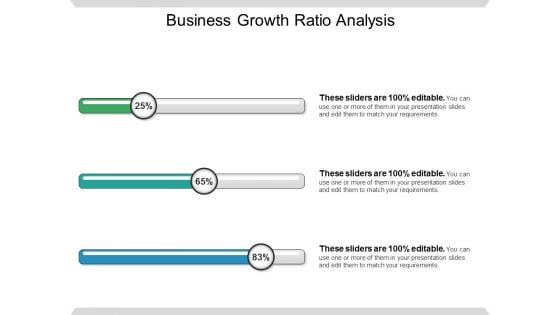
Business Growth Ratio Analysis Ppt PowerPoint Presentation Gallery Design Templates
This is a business growth ratio analysis ppt powerpoint presentation gallery design templates. This is a three stage process. The stages in this process are cost reduction strategies.
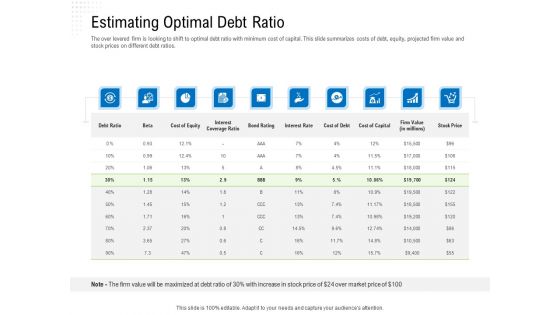
Revaluate Capital Structure Resolution Estimating Optimal Debt Ratio Inspiration PDF
The over levered firm is looking to shift to optimal debt ratio with minimum cost of capital. This slide summarizes costs of debt, equity, projected firm value and stock prices on different debt ratios.Deliver an awe inspiring pitch with this creative revaluate capital structure resolution estimating optimal debt ratio inspiration pdf. bundle. Topics like interest rate, interest coverage ratio, cost of capital, cost of equity, bond rating can be discussed with this completely editable template. It is available for immediate download depending on the needs and requirements of the user.
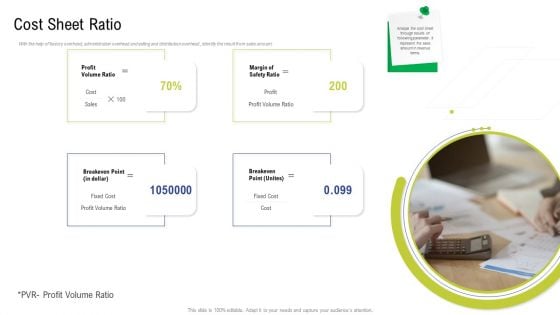
Factory Costs Components Cost Sheet Ratio Ppt Show Images PDF
With the help of factory overhead, administration overhead and selling and distribution overhead , identify the result from sales amount.Presenting factory costs components cost sheet ratio ppt show images pdf. to provide visual cues and insights. Share and navigate important information on four stages that need your due attention. This template can be used to pitch topics like profit volume ratio, profit volume ratio, breakeven point unites, margin of safety ratio. In addtion, this PPT design contains high resolution images, graphics, etc, that are easily editable and available for immediate download.
Contents Ratio Analysis Ppt PowerPoint Presentation Icon Graphics
Presenting this set of slides with name contents ratio analysis ppt powerpoint presentation icon graphics. The topics discussed in these slides are contents, ratio analysis, marketing return, investment, analysis. This is a completely editable PowerPoint presentation and is available for immediate download. Download now and impress your audience.
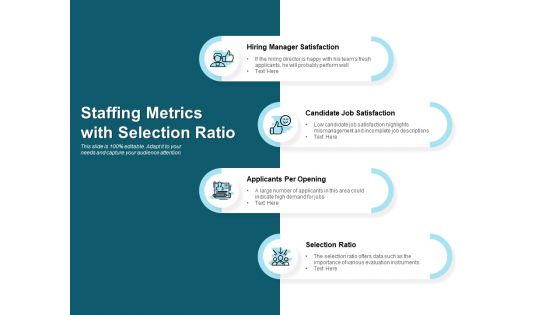
Staffing Metrics With Selection Ratio Ppt PowerPoint Presentation Picture
Presenting this set of slides with name staffing metrics with selection ratio ppt powerpoint presentation picture. This is a four stage process. The stages in this process are hiring manager satisfaction, candidate job satisfaction, applicants per opening, selection ratio. This is a completely editable PowerPoint presentation and is available for immediate download. Download now and impress your audience.
Icon Of Key Financial Ratio Calculation Professional PDF
Presenting icon of key financial ratio calculation professional pdf to dispense important information. This template comprises four stages. It also presents valuable insights into the topics including icon of key financial ratio calculation. This is a completely customizable PowerPoint theme that can be put to use immediately. So, download it and address the topic impactfully.
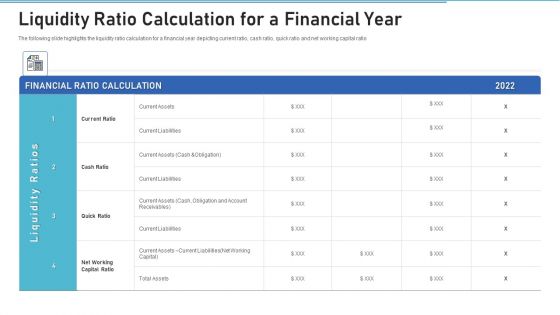
Liquidity Ratio Calculation For A Financial Year Background PDF
Showcasing this set of slides titled liquidity ratio calculation for a financial year background pdf. The topics addressed in these templates are capital ratio, current liabilities, financial. All the content presented in this PPT design is completely editable. Download it and make adjustments in color, background, font etc. as per your unique business setting.
Stock Ratio Icon With Dollar Ppt Styles Shapes PDF
Presenting Stock Ratio Icon With Dollar Ppt Styles Shapes PDF to dispense important information. This template comprises four stages. It also presents valuable insights into the topics including Stock Ratio, Icon, Dollar. This is a completely customizable PowerPoint theme that can be put to use immediately. So, download it and address the topic impactfully.
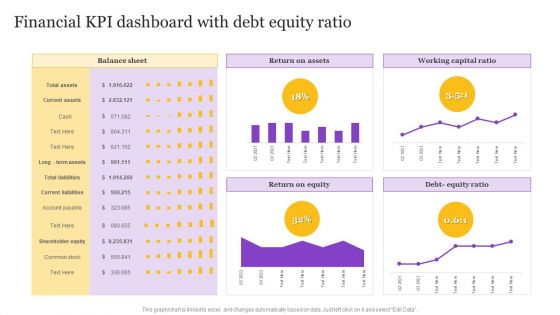
Financial KPI Dashboard With Debt Equity Ratio Rules PDF
Pitch your topic with ease and precision using this Financial KPI Dashboard With Debt Equity Ratio Rules PDF. This layout presents information on Working Capital Ratio, Return On Assets, Return On Equity. It is also available for immediate download and adjustment. So, changes can be made in the color, design, graphics or any other component to create a unique layout.

Elements Of Production Cost Cost Sheet Ratio Download PDF
With the help of factory overhead, administration overhead and selling and distribution overhead , identify the result from sales amount. This is a elements of production cost cost sheet ratio download pdf. template with various stages. Focus and dispense information on four stages using this creative set, that comes with editable features. It contains large content boxes to add your information on topics like profit volume ratio, breakeven point, breakeven point, margin of safety ratio. You can also showcase facts, figures, and other relevant content using this PPT layout. Grab it now.
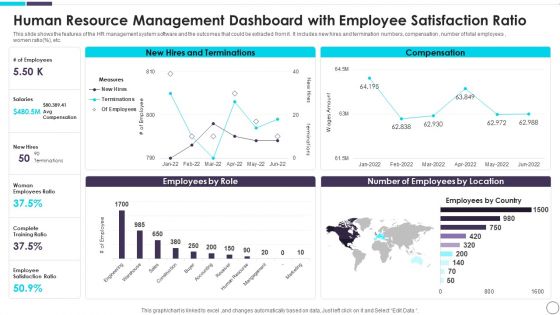
Human Resource Management Dashboard With Employee Satisfaction Ratio Inspiration PDF
This slide shows the features of the HR management system software and the outcomes that could be extracted from it. It includes new hires and termination numbers, compensation , number of total employees , women ratio persent, etc. Showcasing this set of slides titled Human Resource Management Dashboard With Employee Satisfaction Ratio Inspiration PDF The topics addressed in these templates are Human Resource Management Dashboard With Employee Satisfaction Ratio All the content presented in this PPT design is completely editable. Download it and make adjustments in color, background, font etc. as per your unique business setting.
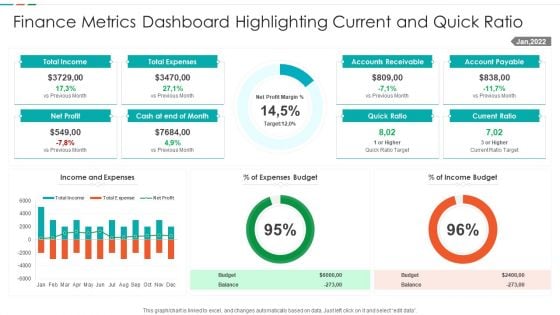
Finance Metrics Dashboard Highlighting Current And Quick Ratio Template PDF
This graph or chart is linked to excel, and changes automatically based on data. Just left click on it and select edit data. Showcasing this set of slides titled Finance Metrics Dashboard Highlighting Current And Quick Ratio Template PDF. The topics addressed in these templates are Total Income Budget, Total Expenses Balance, Net Profit Quick, Ratio Current Ratio. All the content presented in this PPT design is completely editable. Download it and make adjustments in color, background, font etc. as per your unique business setting.
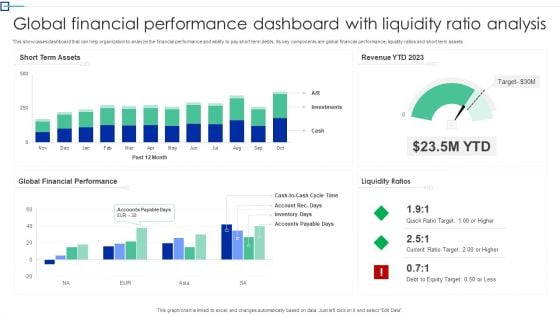
Global Financial Performance Dashboard With Liquidity Ratio Analysis Information PDF
This showcases dashboard that can help organization to analyze the financial performance and ability to pay short term debts. Its key components are global financial performance, liquidity ratios and short term assets. Pitch your topic with ease and precision using this Global Financial Performance Dashboard With Liquidity Ratio Analysis Information PDF. This layout presents information on Short Term Assets, Global Financial Performance, Liquidity Ratios. It is also available for immediate download and adjustment. So, changes can be made in the color, design, graphics or any other component to create a unique layout.

Maintaining Financial Health Of Organization Financial Ratio Analysis Information PDF
This slide showcases analyzing ratios for supporting financial health management initiatives. It provides details about liquidity, solvency and profitability ratios along with areas to analyze. The best PPT templates are a great way to save time, energy, and resources. Slidegeeks have 100 percent editable powerpoint slides making them incredibly versatile. With these quality presentation templates, you can create a captivating and memorable presentation by combining visually appealing slides and effectively communicating your message. Download Maintaining Financial Health Of Organization Financial Ratio Analysis Information PDF from Slidegeeks and deliver a wonderful presentation.
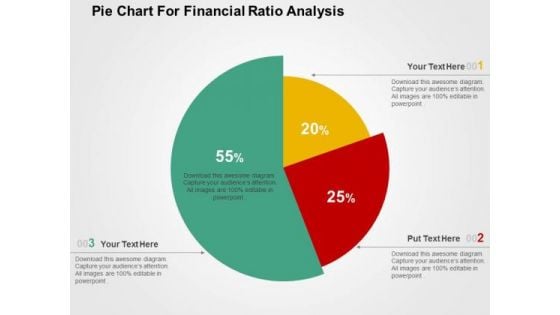
Pie Chart For Financial Ratio Analysis PowerPoint Templates
Create visually amazing presentations with this slide of pie chart. This PPT slide of pie chart for financial ratio analysis. Add this diagram in your presentations to visually support your content.
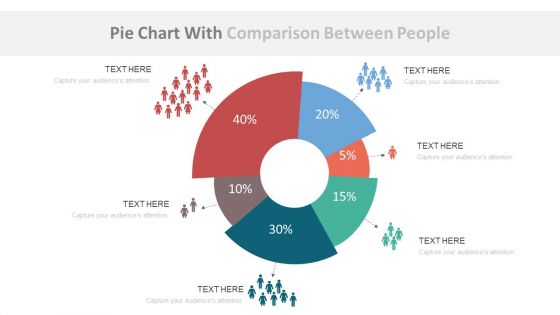
Pie Chart With Population Ratio Analysis Powerpoint Slides
This dashboard template contains graphics of pie chart with icons. This dashboard PowerPoint template helps to display population ratio analysis in a visual manner. Download this template to make impressive presentations.
Four Cubes For Financial Ratio Analysis Powerpoint Template
This business slide displays graphics of four cubes. This PPT slide has been designed to portray concept of financial ratio analysis. Download this PPT slide design to make interactive presentations.
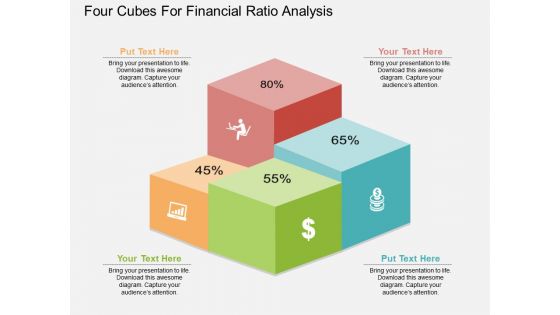
Four Cubes For Fnancial Ratio Analysis Powerpoint Template
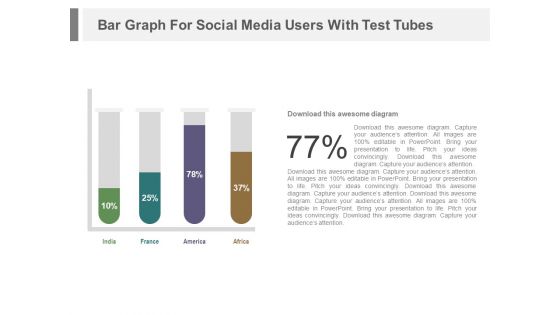
Test Tubes With Financial Data In Percentage Ratio Powerpoint Slides
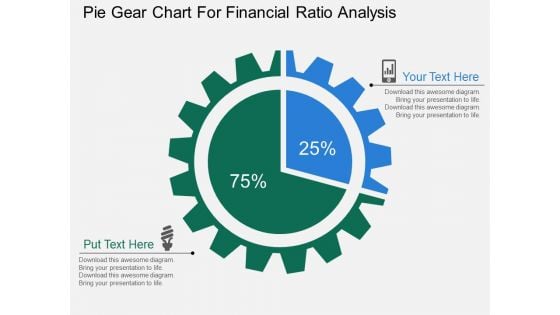
Pie Gear Chart For Financial Ratio Analysis Powerpoint Templates
This PPT slide displays diagram of pie gear chart. This PowerPoint template has been designed to exhibit financial ratio analysis. You can present your opinions using this impressive slide
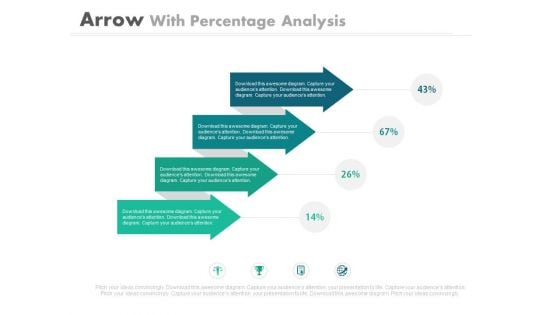
Four Arrows For Percentage Ratio Analysis Powerpoint Slides
This PowerPoint template has been designed with graphics of four arrows with icons. This professional template is suitable to display percentage ratio analysis. Use this diagram slide to build an exclusive presentation.
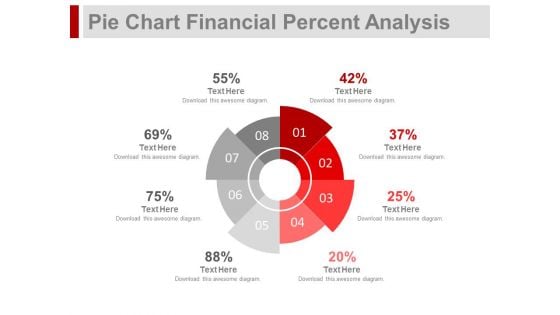
Pie Chart For Financial Ratio Analysis Powerpoint Slides
This PPT slide contains graphics of eight stage pie chart. Download this PowerPoint template slide for financial ratio analysis. This diagram is editable you can edit text, color, shade and style as per you need.
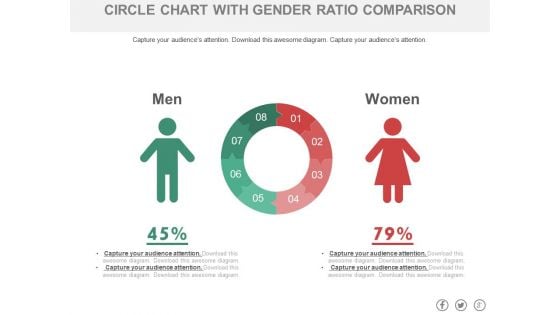
Circle Chart With Man And Woman Ratio Comparison Powerpoint Slides
This PowerPoint template has been designed with graphics of circle chart. You may download this PPT slide to depict man and woman ratio analysis. Add this slide to your presentation and impress your superiors.
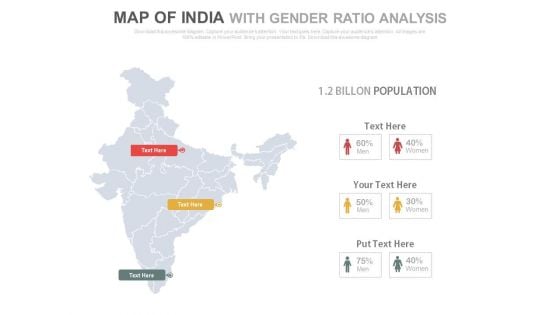
India Map Of With Gender Ratio Analysis Powerpoint Slides
This PowerPoint template displays graphics of India map with male female icons. This Map template can be used in presentations to depict gender ratio analysis. This slide can also be used by school students for educational projects.
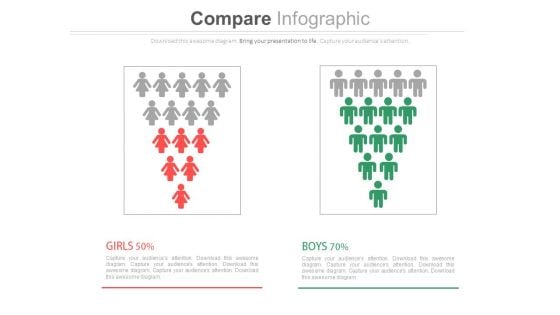
Male Female Gender Ratio Analysis Comparison Chart Powerpoint Slides
This PowerPoint template has been designed with graphics of male and female icons. Download this PPT slide to depict gender ratio analysis. Grab the attention of your team with this eye catching template.
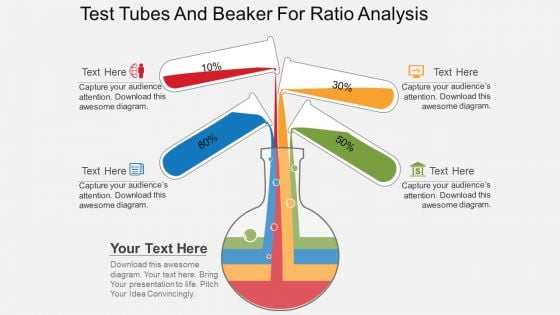
Test Tubes And Beaker For Ratio Analysis Powerpoint Template
Visually support your presentation with our above template containing diagram of test tubes and beaker. This diagram is excellent visual tools for explaining ratio analysis. Use this diagram to make interactive presentations.
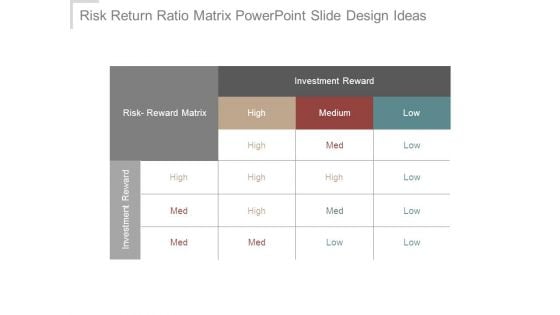
Risk Return Ratio Matrix Powerpoint Slide Design Ideas
This is a risk return ratio matrix powerpoint slide design ideas. This is a three stage process. The stages in this process are risk reward matrix, investment reward, high, medium, low.

Men Vs Female Performance Ratio Analysis Ppt Background Designs
This is a men vs female performance ratio analysis ppt background designs. This is a two stage process. The stages in this process are percentage, finance, business, compare, performance.

 Home
Home