Real Estate Dashboard
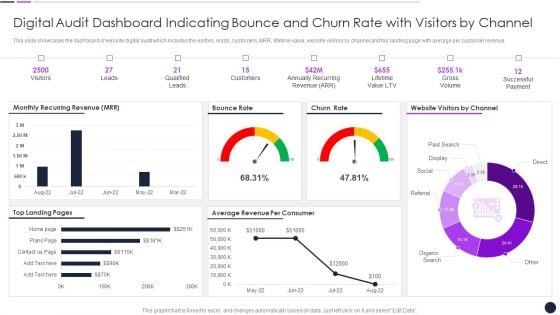
Digital Audit Dashboard Indicating Bounce And Churn Rate With Visitors By Channel Inspiration PDF
This slide showcases the dashboard of website digital audit which includes the visitors, leads, customers, MRR, lifetime value, website visitors by channel and top landing page with average per customer revenue.Deliver and pitch your topic in the best possible manner with this Digital Audit Dashboard Indicating Bounce And Churn Rate With Visitors By Channel Inspiration PDF. Use them to share invaluable insights on Qualified Leads, Annually Recurring, Lifetime Value and impress your audience. This template can be altered and modified as per your expectations. So, grab it now.
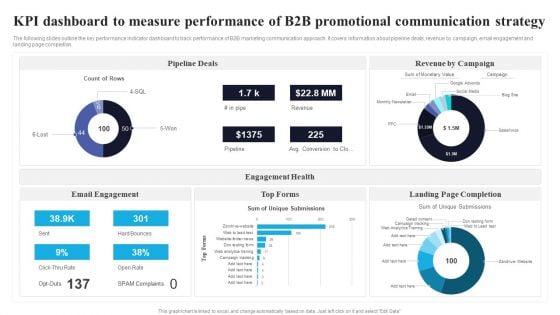
KPI Dashboard To Measure Performance Of B2B Promotional Communication Strategy Mockup PDF
The following slides outline the key performance indicator dashboard to track performance of B2B marketing communication approach. It covers information about pipeline deals, revenue by campaign, email engagement and landing page completion. Pitch your topic with ease and precision using this KPI Dashboard To Measure Performance Of B2B Promotional Communication Strategy Mockup PDF. This layout presents information on Pipeline Deals, Engagement Health, Email Engagement. It is also available for immediate download and adjustment. So, changes can be made in the color, design, graphics or any other component to create a unique layout.
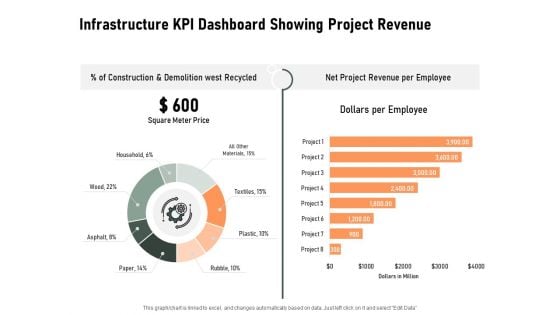
Construction Production Facilities Infrastructure KPI Dashboard Showing Project Revenue Elements PDF
Presenting this set of slides with name construction production facilities infrastructure kpi dashboard showing project revenue elements pdf. The topics discussed in these slides are net project revenue per employee, construction and demolition west recycled. This is a completely editable PowerPoint presentation and is available for immediate download. Download now and impress your audience.

Infrastructure Project Management In Construction Infrastructure KPI Dashboard Showing Project Revenue Portrait PDF
Deliver an awe inspiring pitch with this creativeinfrastructure project management in construction infrastructure kpi dashboard showing project revenue portrait pdf. bundle. Topics like net project revenue per employee, construction and demolition west recycled, project can be discussed with this completely editable template. It is available for immediate download depending on the needs and requirements of the user.
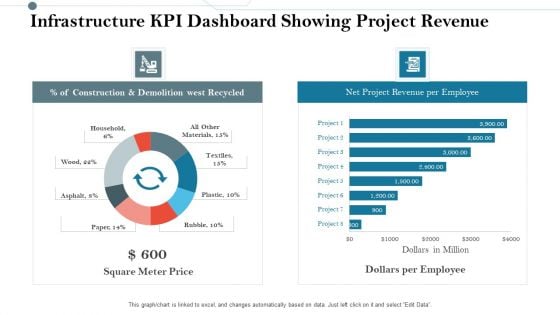
Construction Management Services And Action Plan Infrastructure KPI Dashboard Showing Project Revenue Graphics PDF
Deliver an awe inspiring pitch with this creative construction management services and action plan infrastructure kpi dashboard showing project revenue graphics pdf bundle. Topics like construction and demolition west recycled, net project revenue per employee can be discussed with this completely editable template. It is available for immediate download depending on the needs and requirements of the user.
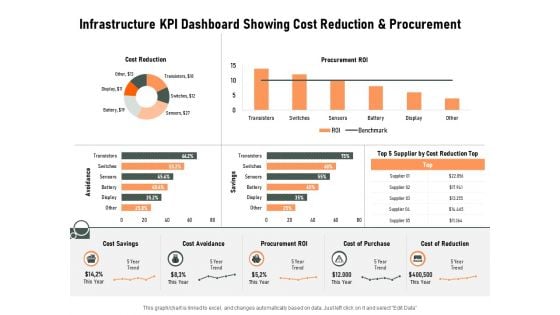
Construction Production Facilities Infrastructure KPI Dashboard Showing Cost Reduction And Procurement Microsoft PDF
Presenting this set of slides with name construction production facilities infrastructure kpi dashboard showing cost reduction and procurement microsoft pdf. The topics discussed in these slides are cost reduction, procurement roi, cost reduction, cost savings, cost avoidance, cost of purchase order. This is a completely editable PowerPoint presentation and is available for immediate download. Download now and impress your audience.
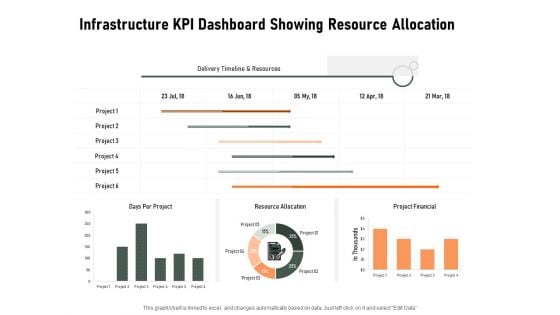
Construction Production Facilities Infrastructure KPI Dashboard Showing Resource Allocation Designs PDF
Presenting this set of slides with name construction production facilities infrastructure kpi dashboard showing resource allocation designs pdf. The topics discussed in these slides are delivery timeline and resources, project financially, resource allocation, days per project. This is a completely editable PowerPoint presentation and is available for immediate download. Download now and impress your audience.
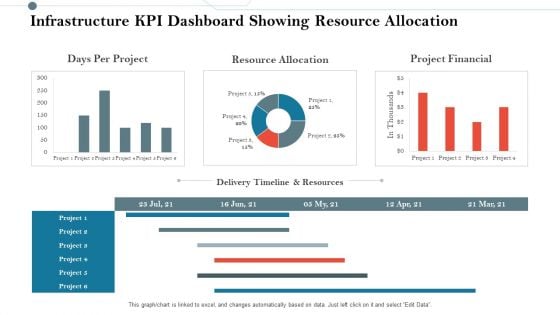
Construction Management Services And Action Plan Infrastructure KPI Dashboard Showing Resource Allocation Ideas PDF
Deliver an awe inspiring pitch with this creative construction management services and action plan infrastructure kpi dashboard showing resource allocation ideas pdf bundle. Topics like days per project, resource allocation, project financial can be discussed with this completely editable template. It is available for immediate download depending on the needs and requirements of the user.
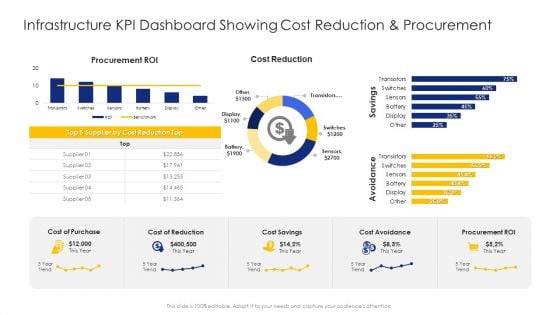
Construction Engineering And Industrial Facility Management Infrastructure KPI Dashboard Showing Cost Reduction And Procurement Demonstration PDF
Deliver an awe-inspiring pitch with this creative construction engineering and industrial facility management infrastructure kpi dashboard showing cost reduction and procurement demonstration pdf bundle. Topics like cost of purchase, cost of reduction, cost savings, cost avoidance, procurement roi can be discussed with this completely editable template. It is available for immediate download depending on the needs and requirements of the user.
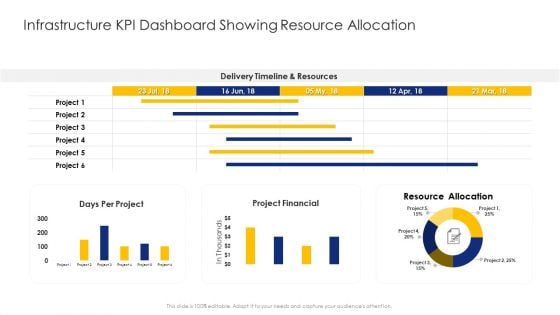
Construction Engineering And Industrial Facility Management Infrastructure KPI Dashboard Showing Resource Allocation Sample PDF
Deliver an awe-inspiring pitch with this creative construction engineering and industrial facility management infrastructure kpi dashboard showing resource allocation sample pdf bundle. Topics like delivery timeline and resources, resource allocation, project financial can be discussed with this completely editable template. It is available for immediate download depending on the needs and requirements of the user.
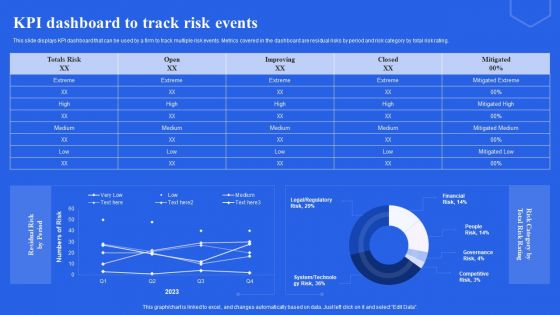
KPI Dashboard To Track Risk Events Ppt Infographic Template Layout Ideas PDF
This slide displays KPI dashboard that can be used by a firm to track multiple risk events. Metrics covered in the dashboard are residual risks by period and risk category by total risk rating. Are you in need of a template that can accommodate all of your creative concepts This one is crafted professionally and can be altered to fit any style. Use it with Google Slides or PowerPoint. Include striking photographs, symbols, depictions, and other visuals. Fill, move around, or remove text boxes as desired. Test out color palettes and font mixtures. Edit and save your work, or work with colleagues. Download KPI Dashboard To Track Risk Events Ppt Infographic Template Layout Ideas PDF and observe how to make your presentation outstanding. Give an impeccable presentation to your group and make your presentation unforgettable.

Digital Audit Dashboard Indicating Bounce And Churn Rate With Visitors By Channel Information PDF
This slide showcases the dashboard of website digital audit which includes the visitors, leads, customers, MRR, lifetime value, website visitors by channel and top landing page with average per customer revenue. Deliver an awe inspiring pitch with this creative Digital Audit Dashboard Indicating Bounce And Churn Rate With Visitors By Channel Information PDF bundle. Topics like Monthly Recurring Revenue, Bounce Rate, Churn Rate can be discussed with this completely editable template. It is available for immediate download depending on the needs and requirements of the user.
Sustainable Energy Dashboard For Our Green Energy Projects Ppt PowerPoint Presentation Show Icons PDF
This slide depicts the dashboard for our green energy projects by covering details of total projects, projects by sector, energy sources, the contribution of green energy projects in households, industry, etc.Deliver and pitch your topic in the best possible manner with this Sustainable Energy Dashboard For Our Green Energy Projects Ppt PowerPoint Presentation Show Icons PDF. Use them to share invaluable insights on Production Coasts, Total Sales, Under Construction and impress your audience. This template can be altered and modified as per your expectations. So, grab it now.

Iot And Digital Twin To Reduce Costs Post Covid Healthcare Dashboard Showing Analytical Data Elements PDF
This slide shows the healthcare dashboard that presents analytical data such as occupancy, patient turnover, efficiency and costs, satisfaction and service indicators. Deliver and pitch your topic in the best possible manner with this iot and digital twin to reduce costs post covid healthcare dashboard showing analytical data elements pdf. Use them to share invaluable insights on occupancy, patient turnover, efficiency and costs, satisfaction and service indicators and impress your audience. This template can be altered and modified as per your expectations. So, grab it now.
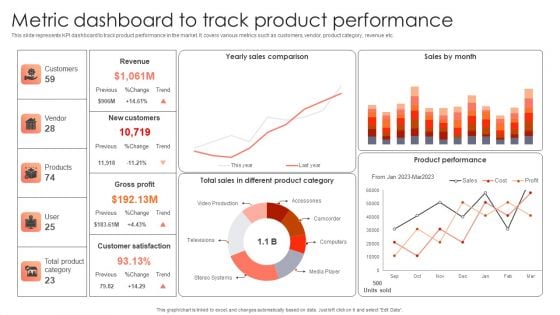
Management Plan For Product Life Cycle Metric Dashboard To Track Product Performance Infographics PDF
This slide represents KPI dashboard to track product performance in the market. It covers various metrics such as customers, vendor, product category, revenue etc. Slidegeeks has constructed Management Plan For Product Life Cycle Metric Dashboard To Track Product Performance Infographics PDF after conducting extensive research and examination. These presentation templates are constantly being generated and modified based on user preferences and critiques from editors. Here, you will find the most attractive templates for a range of purposes while taking into account ratings and remarks from users regarding the content. This is an excellent jumping-off point to explore our content and will give new users an insight into our top-notch PowerPoint Templates.
Executing And Monitoring Project Using Project Management Dashboard For Tracking PM SS V
This slide showcases dashboard for tracing project performance. This template focuses on changing the status of each task and graphs automatically tracking overall status. It covers aspects related to task priority, budget, etc. Slidegeeks has constructed Executing And Monitoring Project Using Project Management Dashboard For Tracking PM SS V after conducting extensive research and examination. These presentation templates are constantly being generated and modified based on user preferences and critiques from editors. Here, you will find the most attractive templates for a range of purposes while taking into account ratings and remarks from users regarding the content. This is an excellent jumping-off point to explore our content and will give new users an insight into our top-notch PowerPoint Templates. This slide showcases dashboard for tracing project performance. This template focuses on changing the status of each task and graphs automatically tracking overall status. It covers aspects related to task priority, budget, etc.
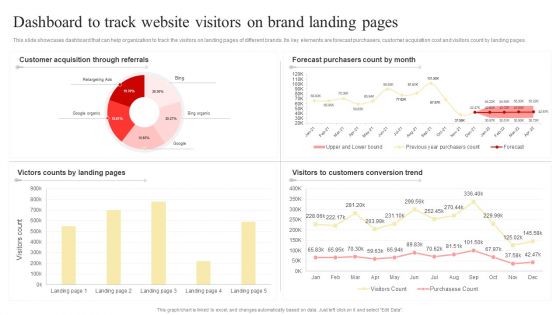
Dashboard To Track Website Visitors On Brand Landing Pages Mockup PDF
This slide showcases dashboard that can help organization to track the visitors on landing pages of different brands. Its key elements are forecast purchasers, customer acquisition cost and visitors count by landing pages.Are you in need of a template that can accommodate all of your creative concepts This one is crafted professionally and can be altered to fit any style. Use it with Google Slides or PowerPoint. Include striking photographs, symbols, depictions, and other visuals. Fill, move around, or remove text boxes as desired. Test out color palettes and font mixtures. Edit and save your work, or work with colleagues. Download Dashboard To Track Website Visitors On Brand Landing Pages Mockup PDF and observe how to make your presentation outstanding. Give an impeccable presentation to your group and make your presentation unforgettable.
Digital Transformation Strategy Roadmap Digital Vitality Dashboard Ppt PowerPoint Presentation Icon Background Images PDF
Presenting this set of slides with name digital transformation strategy roadmap digital vitality dashboard ppt powerpoint presentation icon background images pdf. The topics discussed in these slides are digital vitality score, strategy, data, organizational alignment, customer experience. This is a completely editable PowerPoint presentation and is available for immediate download. Download now and impress your audience.
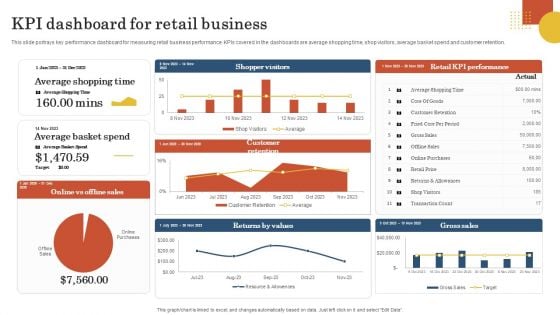
Retail Business Operation Management To Optimize Customer Experience KPI Dashboard For Retail Business Download PDF
This slide portrays key performance dashboard for measuring retail business performance. KPIs covered in the dashboards are average shopping time, shop visitors, average basket spend and customer retention. Are you in need of a template that can accommodate all of your creative concepts This one is crafted professionally and can be altered to fit any style. Use it with Google Slides or PowerPoint. Include striking photographs, symbols, depictions, and other visuals. Fill, move around, or remove text boxes as desired. Test out color palettes and font mixtures. Edit and save your work, or work with colleagues. Download Retail Business Operation Management To Optimize Customer Experience KPI Dashboard For Retail Business Download PDF and observe how to make your presentation outstanding. Give an impeccable presentation to your group and make your presentation unforgettable.
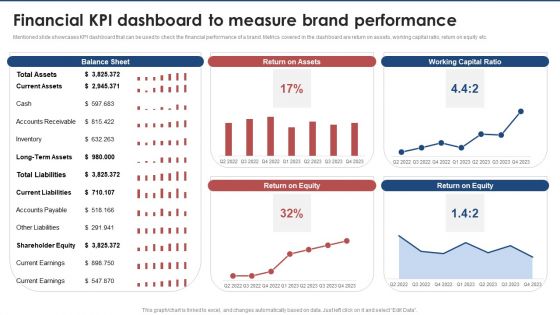
Financial Kpi Dashboard To Measure Brand Performance Brand Value Estimation Guide Inspiration PDF
Mentioned slide showcases KPI dashboard that can be used to check the financial performance of a brand. Metrics covered in the dashboard are return on assets, working capital ratio, return on equity etc.Are you in need of a template that can accommodate all of your creative concepts This one is crafted professionally and can be altered to fit any style. Use it with Google Slides or PowerPoint. Include striking photographs, symbols, depictions, and other visuals. Fill, move around, or remove text boxes as desired. Test out color palettes and font mixtures. Edit and save your work, or work with colleagues. Download Financial Kpi Dashboard To Measure Brand Performance Brand Value Estimation Guide Inspiration PDF and observe how to make your presentation outstanding. Give an impeccable presentation to your group and make your presentation unforgettable.
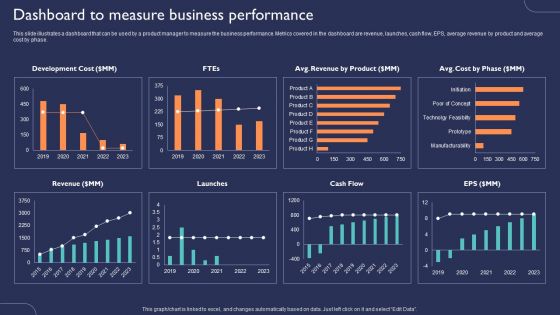
Introduction To New Product Portfolio Dashboard To Measure Business Performance Ppt Ideas Clipart Images PDF
This slide illustrates a dashboard that can be used by a product manager to measure the business performance. Metrics covered in the dashboard are revenue, launches, cash flow, EPS, average revenue by product and average cost by phase. Are you in need of a template that can accommodate all of your creative concepts. This one is crafted professionally and can be altered to fit any style. Use it with Google Slides or PowerPoint. Include striking photographs, symbols, depictions, and other visuals. Fill, move around, or remove text boxes as desired. Test out color palettes and font mixtures. Edit and save your work, or work with colleagues. Download Introduction To New Product Portfolio Dashboard To Measure Business Performance Ppt Ideas Clipart Images PDF and observe how to make your presentation outstanding. Give an impeccable presentation to your group and make your presentation unforgettable.

Improving Corporate Performance KPI Dashboard To Track Risk Events Sample PDF
This slide displays KPI dashboard that can be used by a firm to track multiple risk events. Metrics covered in the dashboard are residual risks by period and risk category by total risk rating. Are you in need of a template that can accommodate all of your creative concepts This one is crafted professionally and can be altered to fit any style. Use it with Google Slides or PowerPoint. Include striking photographs, symbols, depictions, and other visuals. Fill, move around, or remove text boxes as desired. Test out color palettes and font mixtures. Edit and save your work, or work with colleagues. Download Improving Corporate Performance KPI Dashboard To Track Risk Events Sample PDF and observe how to make your presentation outstanding. Give an impeccable presentation to your group and make your presentation unforgettable.

Strategic Guide For Positioning Expanded Brand KPI Dashboard To Measure Brand Marketing Performance Graphics PDF
Mentioned slide illustrates KPI dashboard that can be used by organizations to track the performance of their brand performance. Brand, advertising and purchase are the metrics covered in the dashboard. Are you in need of a template that can accommodate all of your creative concepts. This one is crafted professionally and can be altered to fit any style. Use it with Google Slides or PowerPoint. Include striking photographs, symbols, depictions, and other visuals. Fill, move around, or remove text boxes as desired. Test out color palettes and font mixtures. Edit and save your work, or work with colleagues. Download Strategic Guide For Positioning Expanded Brand KPI Dashboard To Measure Brand Marketing Performance Graphics PDF and observe how to make your presentation outstanding. Give an impeccable presentation to your group and make your presentation unforgettable.
Critical Initiatives To Deploy Staff Training Effectiveness Tracking Dashboard Rules PDF
This slide provides information regarding workforce training effectiveness monitoring dashboard. The dashboard includes details such as training cost, cost per participant, number of participants, hours of training, etc. Are you in need of a template that can accommodate all of your creative concepts This one is crafted professionally and can be altered to fit any style. Use it with Google Slides or PowerPoint. Include striking photographs, symbols, depictions, and other visuals. Fill, move around, or remove text boxes as desired. Test out color palettes and font mixtures. Edit and save your work, or work with colleagues. Download Critical Initiatives To Deploy Staff Training Effectiveness Tracking Dashboard Rules PDF and observe how to make your presentation outstanding. Give an impeccable presentation to your group and make your presentation unforgettable.
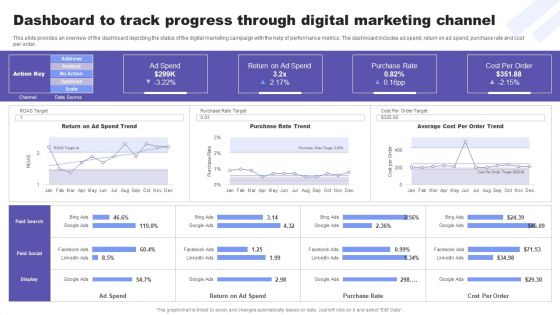
Direct Response Marketing Guide Ultimate Success Dashboard To Track Progress Diagrams PDF
This slide provides an overview of the dashboard depicting the status of the digital marketing campaign with the help of performance metrics. The dashboard includes ad spend, return on ad spend, purchase rate and cost per order. Are you in need of a template that can accommodate all of your creative concepts This one is crafted professionally and can be altered to fit any style. Use it with Google Slides or PowerPoint. Include striking photographs, symbols, depictions, and other visuals. Fill, move around, or remove text boxes as desired. Test out color palettes and font mixtures. Edit and save your work, or work with colleagues. Download Direct Response Marketing Guide Ultimate Success Dashboard To Track Progress Diagrams PDF and observe how to make your presentation outstanding. Give an impeccable presentation to your group and make your presentation unforgettable.
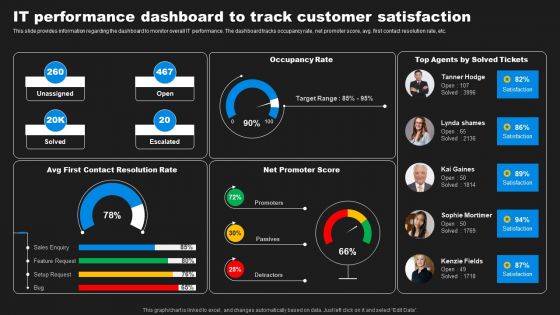
Enhancing Information Technology With Strategic IT Performance Dashboard To Track Microsoft PDF
This slide provides information regarding the dashboard to monitor overall IT performance. The dashboard tracks occupancy rate, net promoter score, avg. first contact resolution rate, etc. Are you in need of a template that can accommodate all of your creative concepts This one is crafted professionally and can be altered to fit any style. Use it with Google Slides or PowerPoint. Include striking photographs, symbols, depictions, and other visuals. Fill, move around, or remove text boxes as desired. Test out color palettes and font mixtures. Edit and save your work, or work with colleagues. Download Enhancing Information Technology With Strategic IT Performance Dashboard To Track Microsoft PDF and observe how to make your presentation outstanding. Give an impeccable presentation to your group and make your presentation unforgettable.
Online Customer Interaction Dashboard For Tracking Customer Service Team Performance Infographics PDF
This slide covers the KPI dashboard for analyzing the performance of client support department. It includes metrics such as first call resolution, unresolved calls, average response rate, the best day to call, average time to solve issues, etc. Deliver and pitch your topic in the best possible manner with this Online Customer Interaction Dashboard For Tracking Customer Service Team Performance Infographics PDF. Use them to share invaluable insights on Response Time, Issue Solving, Call Resolution and impress your audience. This template can be altered and modified as per your expectations. So, grab it now.
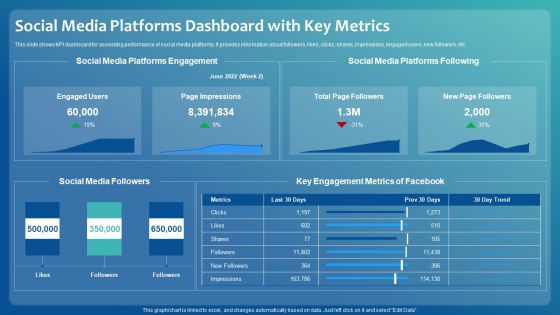
Improving Digital Community Engagement Strategy Social Media Platforms Dashboard With Key Metrics Professional PDF
This slide shows KPI dashboard for assessing performance of social media platforms. It provides information about followers, likes, clicks, shares, impressions, engaged users, new followers, etc. Deliver and pitch your topic in the best possible manner with this Improving Digital Community Engagement Strategy Social Media Platforms Dashboard With Key Metrics Professional PDF. Use them to share invaluable insights on Social Media Platforms Engagement, Key Engagement Metrics and impress your audience. This template can be altered and modified as per your expectations. So, grab it now.
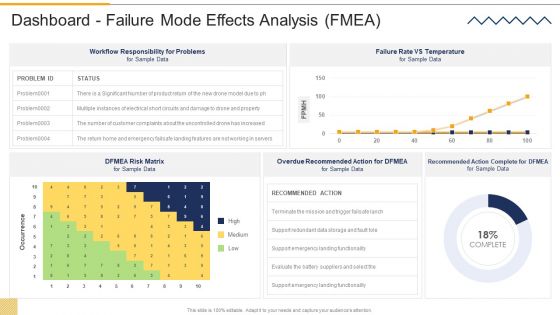
Dashboard Failure Mode Effects Analysis FMEA FMEA Techniques For Process Diagrams PDF
Deliver and pitch your topic in the best possible manner with this Dashboard Failure Mode Effects Analysis FMEA FMEA Techniques For Process Diagrams PDF. Use them to share invaluable insights on Multiple Instances, Support Redundant, Emergency Landing and impress your audience. This template can be altered and modified as per your expectations. So, grab it now.
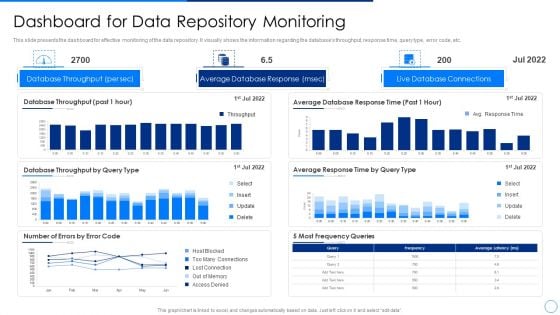
Scale Up Plan For Data Inventory Model Dashboard For Data Repository Monitoring Information PDF
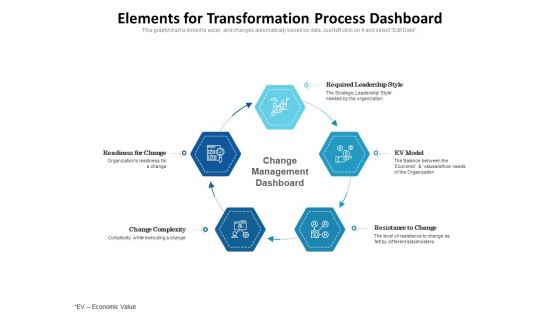
Elements For Transformation Process Dashboard Ppt PowerPoint Presentation Pictures Graphics PDF
Presenting this set of slides with name elements for transformation process dashboard ppt powerpoint presentation pictures graphics pdf. This is a five stage process. The stages in this process are required leadership style, ev model, resistance to change, change complexity, readiness change. This is a completely editable PowerPoint presentation and is available for immediate download. Download now and impress your audience.
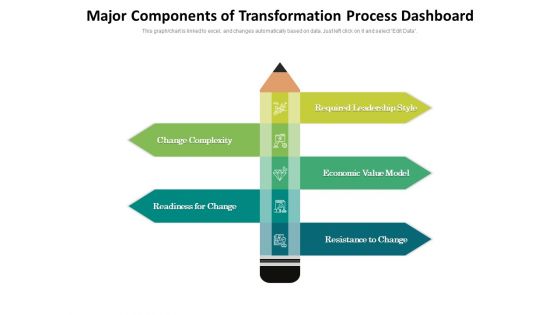
Major Components Of Transformation Process Dashboard Ppt PowerPoint Presentation Infographics Deck PDF
Presenting this set of slides with name major components of transformation process dashboard ppt powerpoint presentation infographics deck pdf. This is a five stage process. The stages in this process are required leadership style, economic value model, resistance to change, readiness for change, change complexity. This is a completely editable PowerPoint presentation and is available for immediate download. Download now and impress your audience.
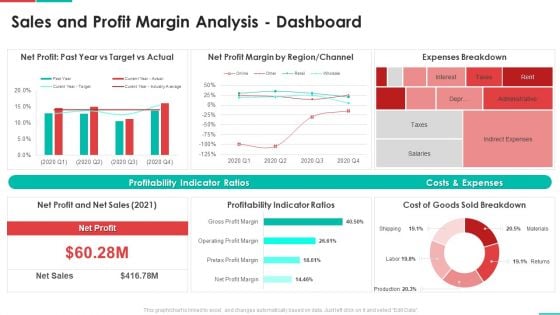
Roadmap For Financial Accounting Transformation Sales And Profit Margin Analysis Dashboard Pictures PDF
Deliver an awe inspiring pitch with this creative roadmap for financial accounting transformation sales and profit margin analysis dashboard pictures pdf bundle. Topics like profitability indicator ratios, costs and expenses, expenses breakdown can be discussed with this completely editable template. It is available for immediate download depending on the needs and requirements of the user.
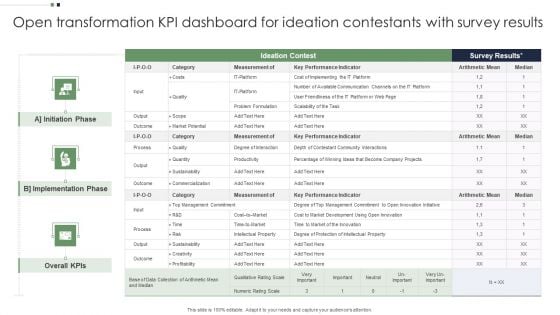
Open Transformation KPI Dashboard For Ideation Contestants With Survey Results Portrait PDF
Showcasing this set of slides titled Open Transformation KPI Dashboard For Ideation Contestants With Survey Results Portrait PDF. The topics addressed in these templates are Implementation, Management, Quantity. All the content presented in this PPT design is completely editable. Download it and make adjustments in color, background, font etc. as per your unique business setting.
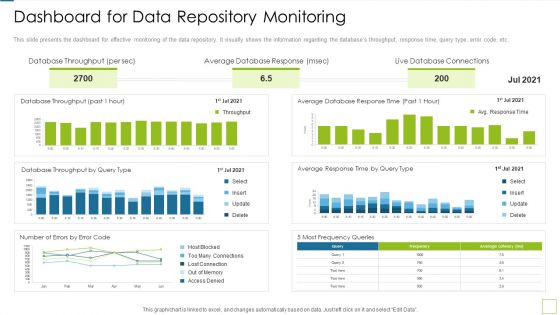
Database Expansion And Optimization Dashboard For Data Repository Monitoring Ppt Model Infographic Template
This slide presents the dashboard for effective monitoring of the data repository. It visually shows the information regarding the databases throughput, response time, query type, error code, etc. Deliver and pitch your topic in the best possible manner with this database expansion and optimization dashboard for data repository monitoring ppt model infographic template. Use them to share invaluable insights on database throughput, average database response, live database connections and impress your audience. This template can be altered and modified as per your expectations. So, grab it now.
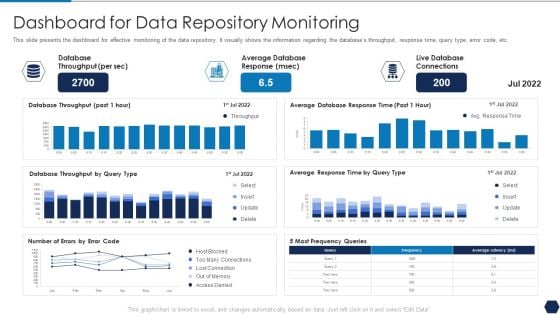
Tactical Plan For Upgrading DBMS Dashboard For Data Repository Monitoring Diagrams PDF
This slide presents the dashboard for effective monitoring of the data repository. It visually shows the information regarding the databases throughput, response time, query type, error code, etc. Deliver and pitch your topic in the best possible manner with this tactical plan for upgrading dbms dashboard for data repository monitoring diagrams pdf. Use them to share invaluable insights on database throughput, average database response, live database connections and impress your audience. This template can be altered and modified as per your expectations. So, grab it now.
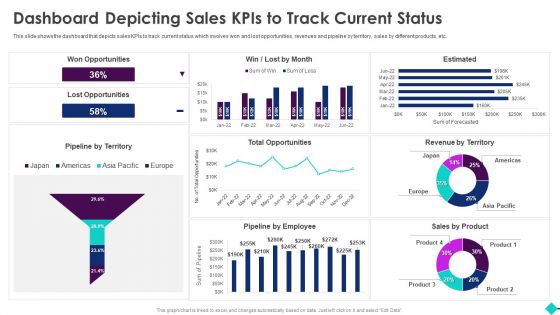
Sales Process Automation For Revenue Growth Dashboard Depicting Sales Kpis To Track Current Status Introduction PDF
This slide shows the dashboard that depicts sales KPIs to track current status which involves won and lost opportunities, revenues and pipeline by territory, sales by different products, etc.Deliver and pitch your topic in the best possible manner with this Sales Process Automation For Revenue Growth Dashboard Depicting Sales Kpis To Track Current Status Introduction PDF. Use them to share invaluable insights on Marketing Effectiveness, Forecast Accuracy, Pipeline Thickness and impress your audience. This template can be altered and modified as per your expectations. So, grab it now.
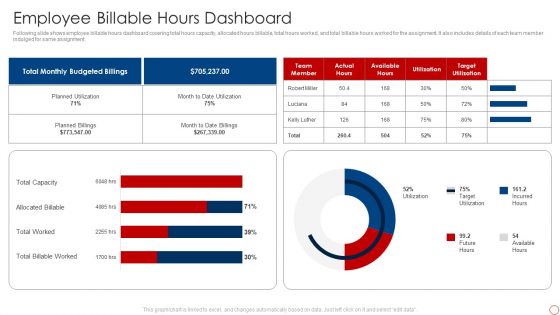
Kpis For Evaluating Business Sustainability Employee Billable Hours Dashboard Professional PDF
Following slide shows employee billable hours dashboard covering total hours capacity, allocated hours billable, total hours worked, and total billable hours worked for the assignment. It also includes details of each team member indulged for same assignment. Deliver and pitch your topic in the best possible manner with this Kpis For Evaluating Business Sustainability Employee Billable Hours Dashboard Professional PDF. Use them to share invaluable insights on Total Billable Worked, Total Worked, Allocated Billable, Total Capacity and impress your audience. This template can be altered and modified as per your expectations. So, grab it now.
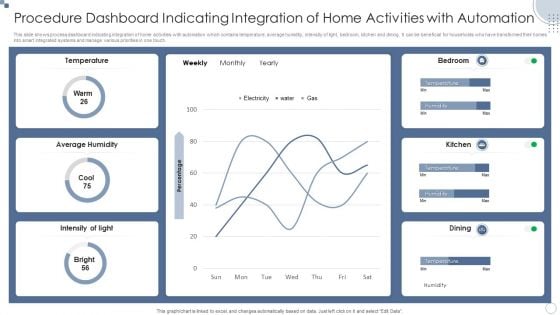
Procedure Dashboard Indicating Integration Of Home Activities With Automation Ppt PowerPoint Presentation File Files PDF
This slide shows process dashboard indicating integration of home activities with automation which contains temperature, average humidity, intensity of light, bedroom, kitchen and dining. It can be beneficial for households who have transformed their homes into smart integrated systems and manage various priorities in one touch.Showcasing this set of slides titled Procedure Dashboard Indicating Integration Of Home Activities With Automation Ppt PowerPoint Presentation File Files PDF. The topics addressed in these templates are Average Humidity, Temperature, Intensity Light. All the content presented in this PPT design is completely editable. Download it and make adjustments in color, background, font etc. as per your unique business setting.
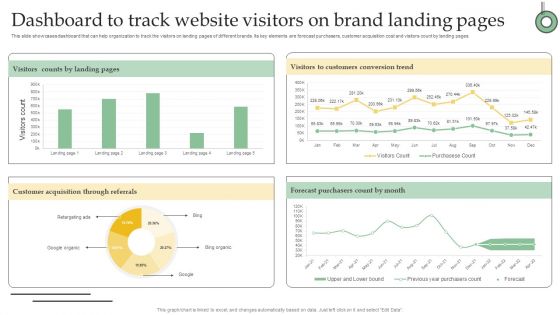
Dashboard To Track Website Visitors On Brand Landing Pages Ppt PowerPoint Presentation File Files PDF
This slide showcases dashboard that can help organization to track the visitors on landing pages of different brands. Its key elements are forecast purchasers, customer acquisition cost and visitors count by landing pages. This modern and well arranged Dashboard To Track Website Visitors On Brand Landing Pages Ppt PowerPoint Presentation File Files PDF provides lots of creative possibilities. It is very simple to customize and edit with the Powerpoint Software. Just drag and drop your pictures into the shapes. All facets of this template can be edited with Powerpoint no extra software is necessary. Add your own material, put your images in the places assigned for them, adjust the colors, and then you can show your slides to the world, with an animated slide included.
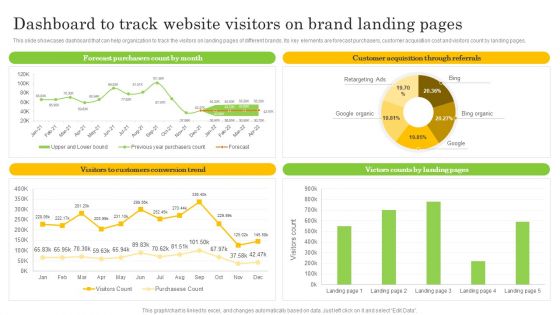
Dashboard To Track Website Visitors On Brand Landing Pages Sample PDF
This slide showcases dashboard that can help organization to track the visitors on landing pages of different brands. Its key elements are forecast purchasers, customer acquisition cost and visitors count by landing pages. This Dashboard To Track Website Visitors On Brand Landing Pages Sample PDF from Slidegeeks makes it easy to present information on your topic with precision. It provides customization options, so you can make changes to the colors, design, graphics, or any other component to create a unique layout. It is also available for immediate download, so you can begin using it right away. Slidegeeks has done good research to ensure that you have everything you need to make your presentation stand out. Make a name out there for a brilliant performance.
Warehouse Automation Deployment Dashboard For Tracking Impact Of Warehouse House Infographics PDF
This slide covers the dashboard with after automation warehouse overview. It include KPIs such as autonomous robots status, robotic arms status, battery level, performance, time to return, etc. Deliver and pitch your topic in the best possible manner with this Warehouse Automation Deployment Dashboard For Tracking Impact Of Warehouse House Infographics PDF. Use them to share invaluable insights on Autonomous Robot, Systems Engineer, Warehouse Manager and impress your audience. This template can be altered and modified as per your expectations. So, grab it now.
Dashboard For Tracking Website Performance Consumer Contact Point Guide Brochure PDF
This slide covers the KPI dashboard for analyzing the company website. It includes metrics such as conversions, conversion rate, sessions, stickiness, bounce rate, engagement, etc. Slidegeeks has constructed Dashboard For Tracking Website Performance Consumer Contact Point Guide Brochure PDF after conducting extensive research and examination. These presentation templates are constantly being generated and modified based on user preferences and critiques from editors. Here, you will find the most attractive templates for a range of purposes while taking into account ratings and remarks from users regarding the content. This is an excellent jumping-off point to explore our content and will give new users an insight into our top-notch PowerPoint Templates.
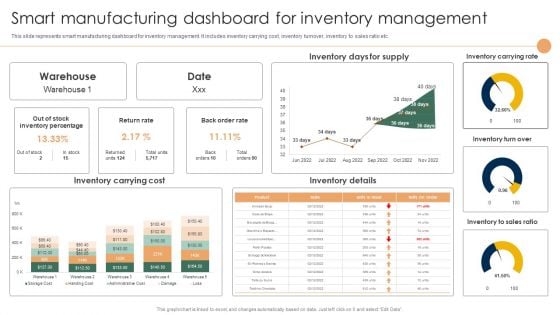
Smart Manufacturing Deployment Improve Production Procedures Smart Manufacturing Dashboard Summary PDF
This slide represents smart manufacturing dashboard for inventory management. It includes inventory carrying cost, inventory turnover, inventory to sales ratio etc.Slidegeeks has constructed Smart Manufacturing Deployment Improve Production Procedures Smart Manufacturing Dashboard Summary PDF after conducting extensive research and examination. These presentation templates are constantly being generated and modified based on user preferences and critiques from editors. Here, you will find the most attractive templates for a range of purposes while taking into account ratings and remarks from users regarding the content. This is an excellent jumping-off point to explore our content and will give new users an insight into our top-notch PowerPoint Templates.
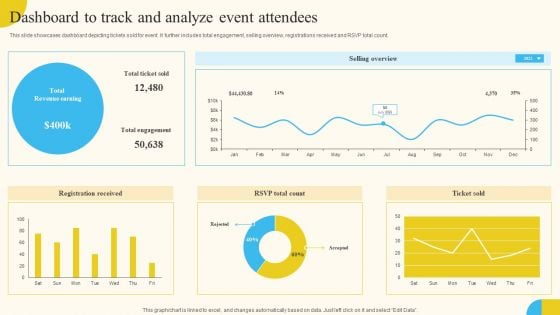
Dashboard To Track And Analyze Event Attendees Activities For Successful Launch Event Slides PDF
This slide showcases dashboard depicting tickets sold for event. It further includes total engagement, selling overview, registrations received and RSVP total count. Slidegeeks has constructed Dashboard To Track And Analyze Event Attendees Activities For Successful Launch Event Slides PDF after conducting extensive research and examination. These presentation templates are constantly being generated and modified based on user preferences and critiques from editors. Here, you will find the most attractive templates for a range of purposes while taking into account ratings and remarks from users regarding the content. This is an excellent jumping-off point to explore our content and will give new users an insight into our top-notch PowerPoint Templates.
Strategies For Effective Product Product Development And Management Dashboard Icons PDF
This slide represents product development and management dashboard. It covers project hours, hours spent on project tasks, to do list etc. Slidegeeks has constructed Strategies For Effective Product Product Development And Management Dashboard Icons PDF after conducting extensive research and examination. These presentation templates are constantly being generated and modified based on user preferences and critiques from editors. Here, you will find the most attractive templates for a range of purposes while taking into account ratings and remarks from users regarding the content. This is an excellent jumping-off point to explore our content and will give new users an insight into our top-notch PowerPoint Templates.
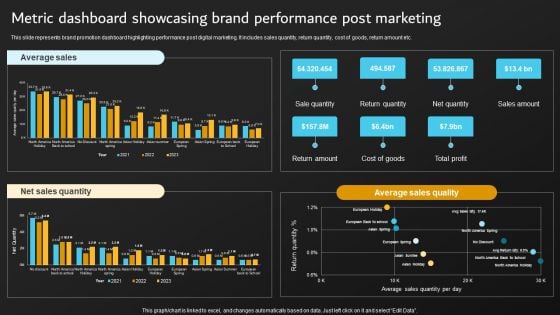
Implementation Of Digital Marketing Metric Dashboard Showcasing Brand Performance Diagrams PDF
This slide represents brand promotion dashboard highlighting performance post digital marketing. It includes sales quantity, return quantity, cost of goods, return amount etc. Slidegeeks has constructed Implementation Of Digital Marketing Metric Dashboard Showcasing Brand Performance Diagrams PDF after conducting extensive research and examination. These presentation templates are constantly being generated and modified based on user preferences and critiques from editors. Here, you will find the most attractive templates for a range of purposes while taking into account ratings and remarks from users regarding the content. This is an excellent jumping-off point to explore our content and will give new users an insight into our top-notch PowerPoint Templates.
Maximizing Business Impact Through ML Digital Media Tracking Dashboard Professional PDF
This slide covers the digital marketing dashboard along with the lead breakdown, google analytics traffic, and social media channels. Slidegeeks has constructed Maximizing Business Impact Through ML Digital Media Tracking Dashboard Professional PDF after conducting extensive research and examination. These presentation templates are constantly being generated and modified based on user preferences and critiques from editors. Here, you will find the most attractive templates for a range of purposes while taking into account ratings and remarks from users regarding the content. This is an excellent jumping-off point to explore our content and will give new users an insight into our top-notch PowerPoint Templates.
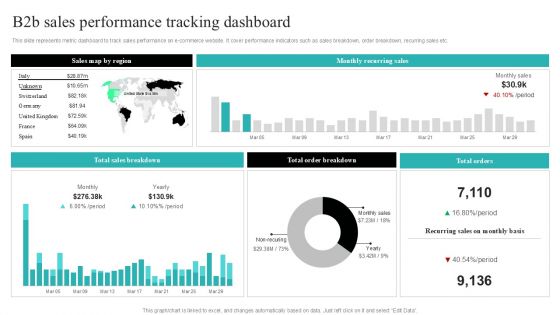
Strategic Ecommerce Plan For B2B Enterprises B2b Sales Performance Tracking Dashboard Demonstration PDF
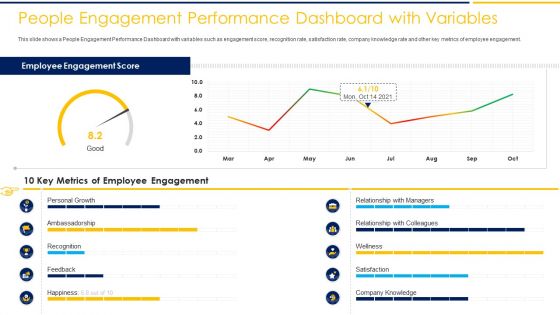
People Engagement Performance Dashboard With Variables Growth Ppt Summary Example PDF
This slide shows a People Engagement Performance Dashboard with variables such as engagement score, recognition rate, satisfaction rate, company knowledge rate and other key metrics of employee engagement. Deliver and pitch your topic in the best possible manner with this people engagement performance dashboard with variables growth ppt summary example pdf. Use them to share invaluable insights on 10 key metrics of employee engagement, employee engagement score and impress your audience. This template can be altered and modified as per your expectations. So, grab it now.
Actively Influencing Customers Dashboard For Tracking Marketing Activities At Social Guidelines PDF
This slide covers information regarding the dashboard for tracking essential marketing activities at social media platform in terms of social traffic and conversion, referral traffic by site, key social media metrics. Deliver and pitch your topic in the best possible manner with this Actively Influencing Customers Dashboard For Tracking Marketing Activities At Social Guidelines PDF. Use them to share invaluable insights on Social Events, Social Traffic And Conversion, Referral Traffic By Site, Key Social Metrics and impress your audience. This template can be altered and modified as per your expectations. So, grab it now.
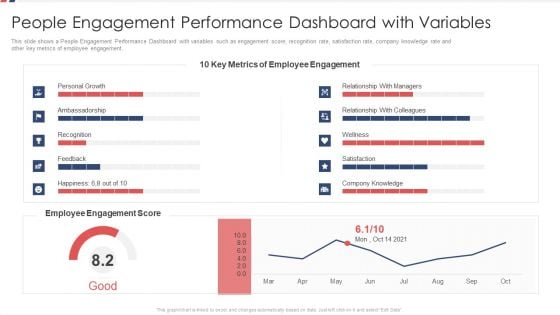
People Engagement Performance Dashboard With Variables Ppt Gallery Example File PDF
This slide shows a People Engagement Performance Dashboard with variables such as engagement score, recognition rate, satisfaction rate, company knowledge rate and other key metrics of employee engagement. Deliver and pitch your topic in the best possible manner with this people engagement performance dashboard with variables ppt gallery example file pdf. Use them to share invaluable insights on personal growth, employee engagement score, employee engagement metrics and impress your audience. This template can be altered and modified as per your expectations. So, grab it now.
AI Playbook For Business KPI Dashboard For Tracking Business Performance Demonstration PDF
Mentioned slide portrays KPI dashboard that can be used by organizations to measure their business performance post AI introduction. KPIS covered here are progress, before versus after AI implementation, risks and issues. Deliver and pitch your topic in the best possible manner with this AI Playbook For Business KPI Dashboard For Tracking Business Performance Demonstration PDF. Use them to share invaluable insights on Performance KPIs, Progress, Risk And Issues and impress your audience. This template can be altered and modified as per your expectations. So, grab it now.
Positive Marketing For Corporate Dashboard For Tracking Marketing Activities At Social Topics PDF
This slide covers information regarding the dashboard for tracking essential marketing activities at social media platform in terms of social traffic and conversion, referral traffic by site, key social media metrics. Deliver and pitch your topic in the best possible manner with this positive marketing for corporate dashboard for tracking marketing activities at social topics pdf. Use them to share invaluable insights on social events, social traffic and conversion and impress your audience. This template can be altered and modified as per your expectations. So, grab it now.
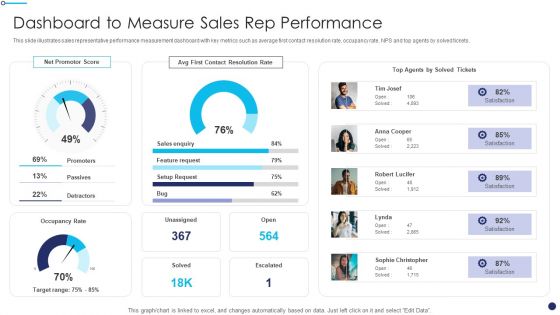
Effective Sales Technique For New Product Launch Dashboard To Measure Sales Rep Performance Themes PDF
This slide illustrates sales representative performance measurement dashboard with key metrics such as average first contact resolution rate, occupancy rate, NPS and top agents by solved tickets.Deliver and pitch your topic in the best possible manner with this Effective Sales Technique For New Product Launch Dashboard To Measure Sales Rep Performance Themes PDF Use them to share invaluable insights on Contact Resolution, Feature Request, Promoters and impress your audience. This template can be altered and modified as per your expectations. So, grab it now.
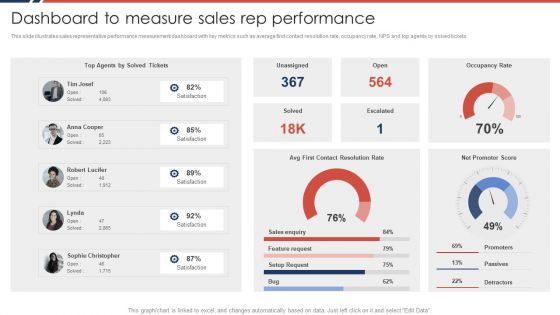
Effective Sales Plan For New Product Introduction In Market Dashboard To Measure Sales Download PDF
This slide illustrates sales representative performance measurement dashboard with key metrics such as average first contact resolution rate, occupancy rate, NPS and top agents by solved tickets.Deliver and pitch your topic in the best possible manner with this Effective Sales Plan For New Product Introduction In Market Dashboard To Measure Sales Download PDF Use them to share invaluable insights on Sales Enquiry, Feature Request, Setup Request and impress your audience. This template can be altered and modified as per your expectations. So, grab it now.
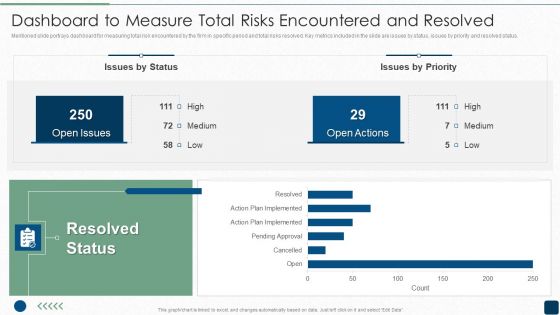
ISO 27001 Certification Procedure Dashboard To Measure Total Risks Encountered And Resolved Topics PDF
Mentioned slide portrays dashboard for measuring total risk encountered by the firm in specific period and total risks resolved. Key metrics included in the slide are issues by status, issues by priority and resolved status.Deliver and pitch your topic in the best possible manner with this ISO 27001 Certification Procedure Dashboard To Measure Total Risks Encountered And Resolved Topics PDF. Use them to share invaluable insights on Resolved Status, Open Issues, Open Actions and impress your audience. This template can be altered and modified as per your expectations. So, grab it now.

Sales Optimization Best Practices To Close More Deals Sales KPI Dashboard Accumulated Topics PDF
The sales dashboard is an effective tool that helps in monitoring various sales KPIs in order to aid sales teams in reaching sales goals by analyzing the sales performance. Deliver and pitch your topic in the best possible manner with this sales optimization best practices to close more deals sales kpi dashboard accumulated topics pdf. Use them to share invaluable insights on incremental sales, sales revenue, cost breakdown, accumulated revenue and impress your audience. This template can be altered and modified as per your expectations. So, grab it now.
Sales Department Strategies Increase Revenues Sales KPI Dashboard Ppt Icon Visual Aids PDF
The sales dashboard is an effective tool that helps in monitoring various sales KPIs in order to aid sales teams in reaching sales goals by analyzing the sales performance. Deliver and pitch your topic in the best possible manner with this sales department strategies increase revenues sales kpi dashboard ppt icon visual aids pdf. Use them to share invaluable insights on average revenue, customer lifetime value, customer acquisition cost and impress your audience. This template can be altered and modified as per your expectations. So, grab it now.
Forecasting And Managing Consumer Attrition For Business Advantage Dashboard Customer Purchase Tracking Repeat Structure PDF
The firm is looking forward to track customer experience by tracking various touchpoints in order to handle issues such customer churn. KPIs mentioned in the dashboard are measured regularly across the organization. Deliver and pitch your topic in the best possible manner with this forecasting and managing consumer attrition for business advantage dashboard customer purchase tracking repeat structure pdf. Use them to share invaluable insights on total repeat sales after coupon, total repeat sales after reward, total cart value per month and impress your audience. This template can be altered and modified as per your expectations. So, grab it now.


 Continue with Email

 Home
Home


