Records Management

Expected Return And Variance Chart Powerpoint Slide Deck Template
This is a expected return and variance chart powerpoint slide deck template. This is a one stage process. The stages in this process are investment reward, reward matrix, high, med, low.
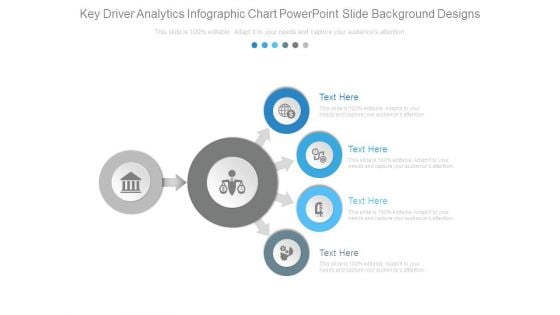
Key Driver Analytics Infographic Chart Powerpoint Slide Background Designs
This is a key driver analytics infographic chart powerpoint slide background designs. This is a four stage process. The stages in this process are business, marketing, arrows, icons, strategy.

Key Skills Chart For Evaluation Example Of Ppt Presentation
This is a key skills chart for evaluation example of ppt presentation. This is a five stage process. The stages in this process are communicating, questioning, researching, analyzing, evaluating, key skills.
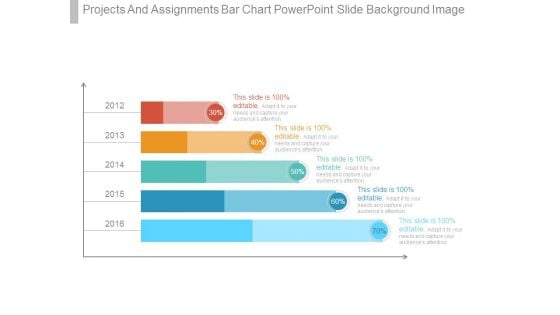
Projects And Assignments Bar Chart Powerpoint Slide Background Image
This is a projects and assignments bar chart powerpoint slide background image. This is a five stage process. The stages in this process are finance, presentation, business, strategy, marketing.
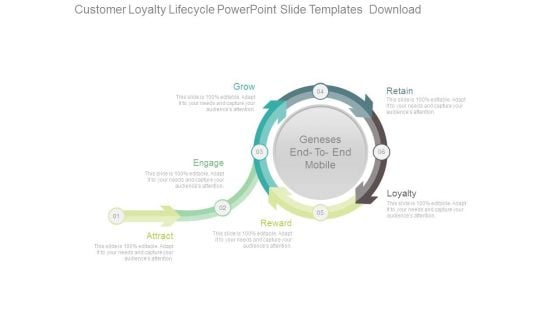
Customer Loyalty Circle Chart Powerpoint Slide Templates Download
This is a customer loyalty circle chart powerpoint slide templates download. This is a six stage process. The stages in this process are grow, engage, attract, reward, retain, loyalty.
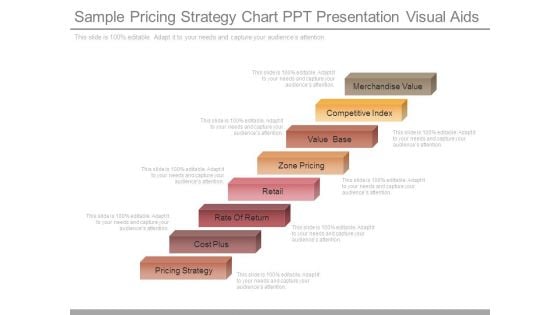
Sample Pricing Strategy Chart Ppt Presentation Visual Aids
This is a sample pricing strategy chart ppt presentation visual aids. This is a eight stage process. The stages in this process are merchandise value, competitive index, value base, zone pricing, retail, rate of return, cost plus, pricing strategy.
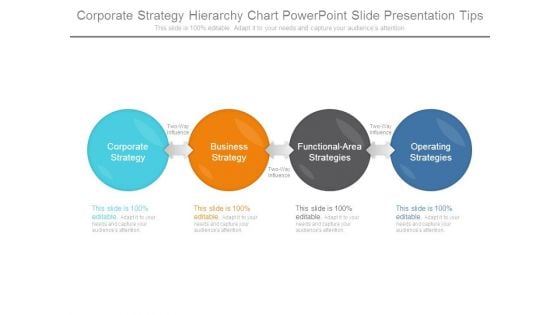
Corporate Strategy Hierarchy Chart Powerpoint Slide Presentation Tips
This is a corporate strategy hierarchy chart powerpoint slide presentation tips. This is a four stage process. The stages in this process are corporate strategy, business strategy, functional area strategies, operating strategies.
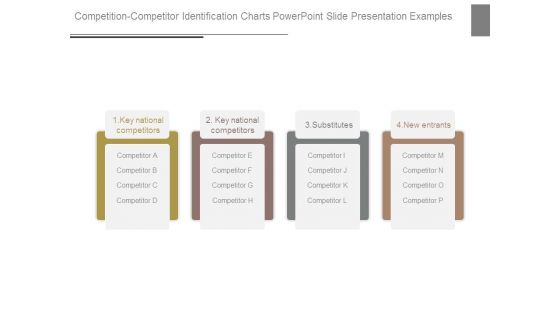
Competition Competitor Identification Charts Powerpoint Slide Presentation Examples
This is a competition competitor identification charts powerpoint slide presentation examples. This is a four stage process. The stages in this process are key national competitors, substitutes, new entrants, competitor.
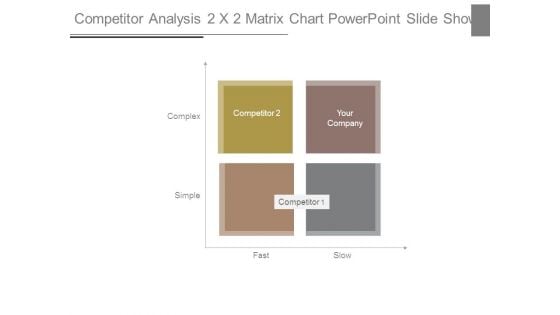
Competitor Analysis 2 X 2 Matrix Chart Powerpoint Slide Show
This is a competitor analysis 2 x 2 matrix chart powerpoint slide show. This is a four stage process. The stages in this process are competitor, your company, competitor, complex, simple, fast, slow.
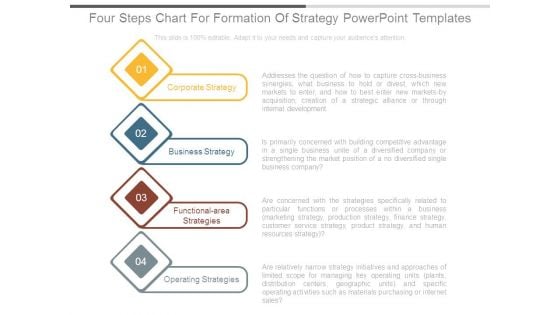
Four Steps Chart For Formation Of Strategy Powerpoint Templates
This is a four steps chart for formation of strategy powerpoint templates. This is a four stage process. The stages in this process are corporate strategy, business strategy, functional area strategies, operating strategies.
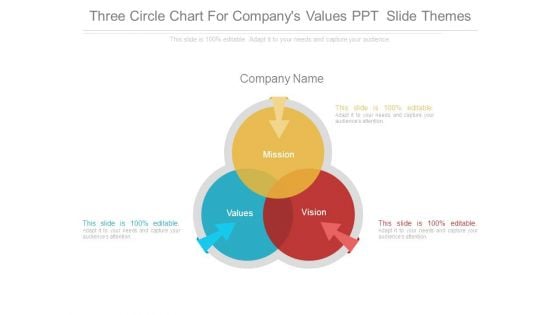
Three Circle Chart For Companys Values Ppt Slide Themes
This is a three circle chart for companys values ppt slide themes. This is a three stage process. The stages in this process are mission, company name, values, vision.
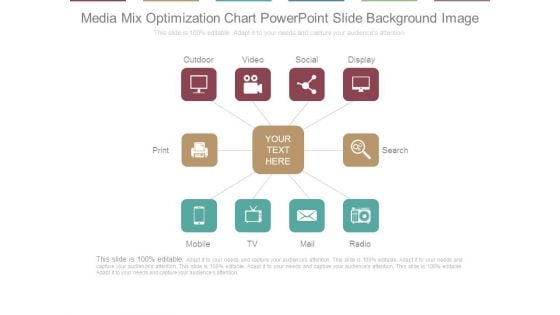
Media Mix Optimization Chart Powerpoint Slide Background Image
This is a media mix optimization chart powerpoint slide background image. This is a ten stage process. The stages in this process are outdoor, video, social, display, search, radio, mail, tv, mobile, print.

Curve Chart For Product Life Cycle Presentation Outline
This is a curve chart for product life cycle presentation outline. This is a five stage process. The stages in this process are sales over time, product extension, introduction, growth, maturity, decline, time.
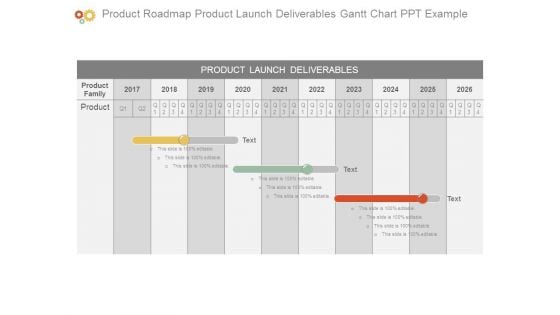
Product Roadmap Product Launch Deliverables Gantt Chart Ppt Example
This is a product roadmap product launch deliverables gantt chart ppt example. This is a three stage process. The stages in this process are product launch deliverables, product family, product.
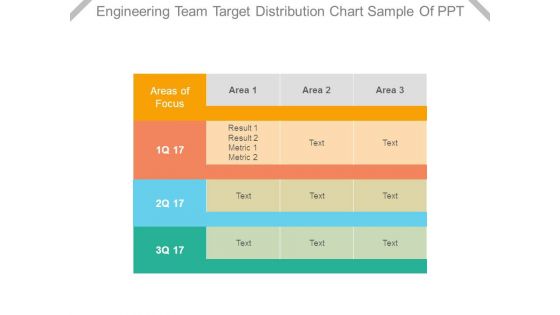
Engineering Team Target Distribution Chart Sample Of Ppt
This is a engineering team target distribution chart sample of ppt. This is a three stage process. The stages in this process are areas of focus, area, result, metric.
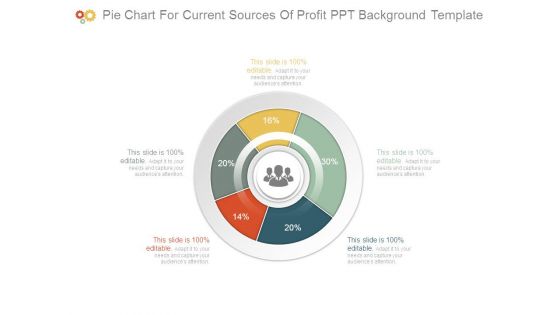
Pie Chart For Current Sources Of Profit Ppt Background Template
This is a pie chart for current sources of profit ppt background template. This is a five stage process. The stages in this process are finance, success, business, marketing, percentage, donut.
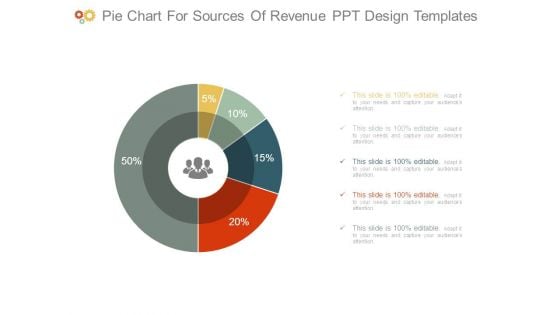
Pie Chart For Sources Of Revenue Ppt Design Templates
This is a pie chart for sources of revenue ppt design templates. This is a five stage process. The stages in this process are finance, success, business, marketing, percentage, donut.
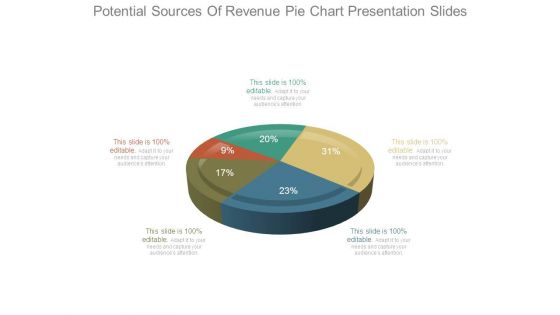
Potential Sources Of Revenue Pie Chart Presentation Slides
This is a potential sources of revenue pie chart presentation slides. This is a five stage process. The stages in this process are finance, success, business, marketing, percentage, pie.
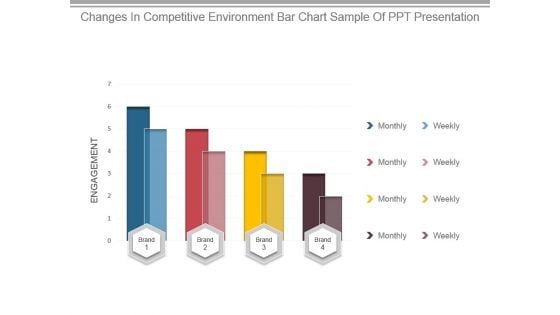
Changes In Competitive Environment Bar Chart Sample Of Ppt Presentation
This is a changes in competitive environment bar chart sample of ppt presentation. This is a four stage process. The stages in this process are engagement, brand, monthly, weekly.
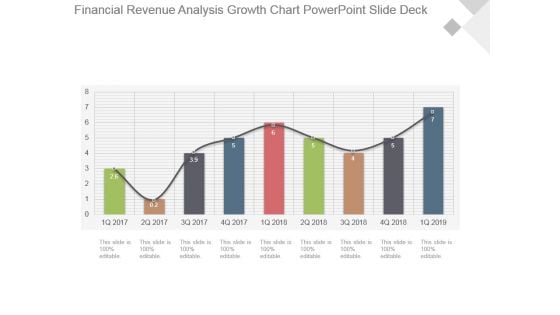
Financial Revenue Analysis Growth Chart Powerpoint Slide Deck
This is a financial revenue analysis growth chart powerpoint slide deck. This is a nine stage process. The stages in this process are growth, success, business, marketing, bar graph.
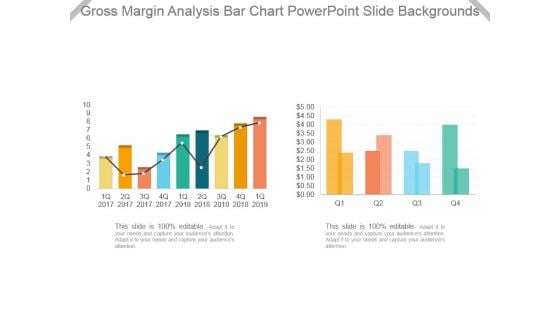
Gross Margin Analysis Bar Chart Powerpoint Slide Backgrounds
This is a gross margin analysis bar chart powerpoint slide backgrounds. This is a two stage process. The stages in this process are bar graph, business, marketing, growth, success.
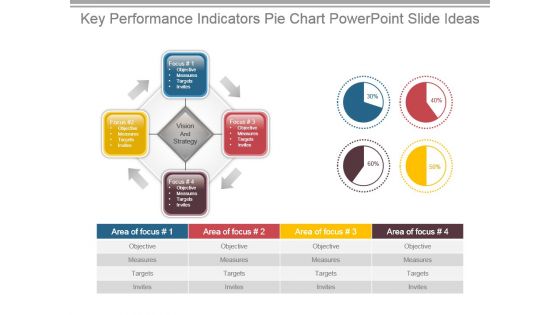
Key Performance Indicators Pie Chart Powerpoint Slide Ideas
This is a key performance indicators pie chart powerpoint slide ideas. This is a four stage process. The stages in this process are focus, objectives, measures, targets, invites, vision and strategy, area of focus.
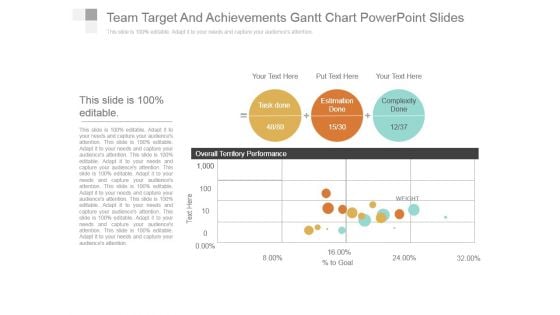
Team Target And Achievements Gantt Chart Powerpoint Slides
This is a team target and achievements gantt chart powerpoint slides. This is a three stage process. The stages in this process are task done, estimation done, complexity done, overall territory performance.

Profit After Tax Pat Growth Chart Powerpoint Slide Designs Download
This is a profit after tax pat growth chart powerpoint slide designs download. This is a five stage process. The stages in this process are growth, success, business, strategy, marketing.
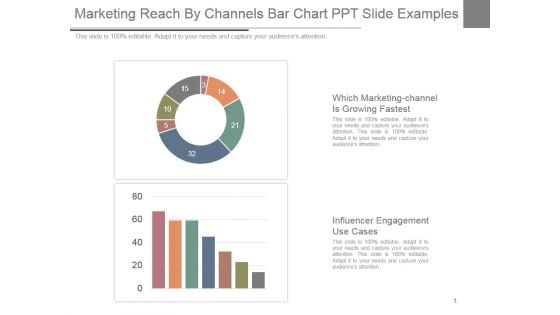
Marketing Reach By Channels Bar Chart Ppt Slide Examples
This is a marketing reach by channels bar chart ppt slide examples. This is a two stage process. The stages in this process are which marketing-channel is growing fastest, influencer engagement use cases.
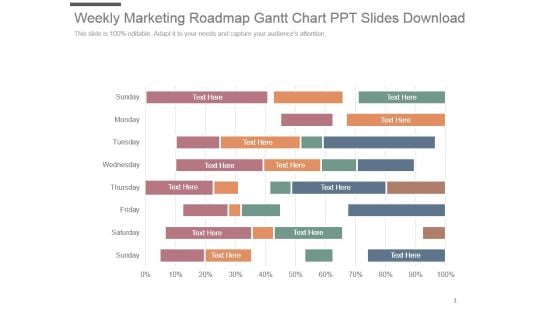
Weekly Marketing Roadmap Gantt Chart Ppt Slides Download
This is a weekly marketing roadmap gantt chart ppt slides download. This is a eight stage process. The stages in this process are sunday, monday, tuesday, wednesday, thursday, friday, saturday, Sunday.
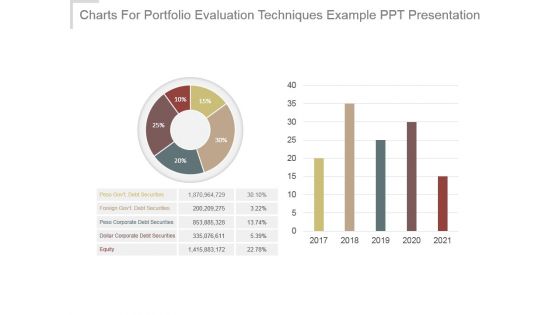
Charts For Portfolio Evaluation Techniques Example Ppt Presentation
This is a charts for portfolio evaluation techniques example ppt presentation. This is a five stage process. The stages in this process are peso govt debt securities, foreign govt debt securities, peso corporate debt securities, dollar corporate debt securities, equity.
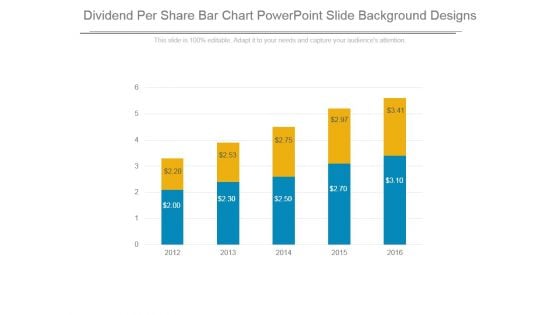
Dividend Per Share Bar Chart Powerpoint Slide Background Designs
This is a dividend per share bar chart powerpoint slide background designs. This is a five stage process. The stages in this process are business, marketing, success, growth, bar graph.
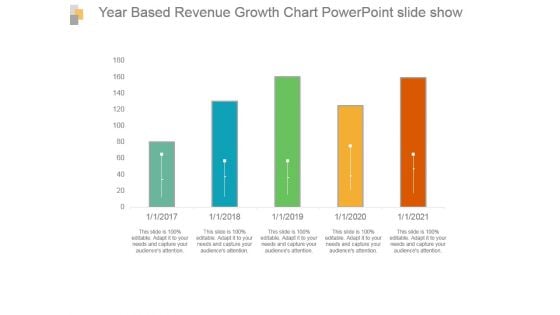
Year Based Revenue Growth Chart Powerpoint Slide Show
This is a year based revenue growth chart powerpoint slide show. This is a five stage process. The stages in this process are bar graph, growth, revenue, year, success.
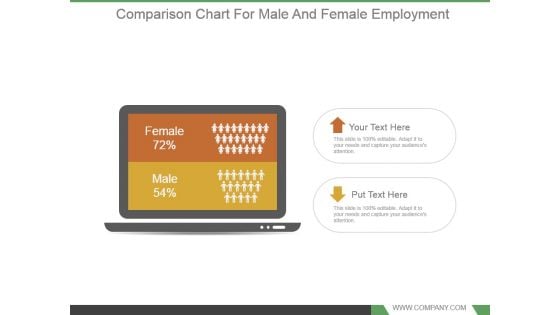
Comparison Chart For Male And Female Employment Powerpoint Shapes
This is a comparison chart for male and female employment powerpoint shapes. This is a two stage process. The stages in this process are female 72 percent, male 54 percent.
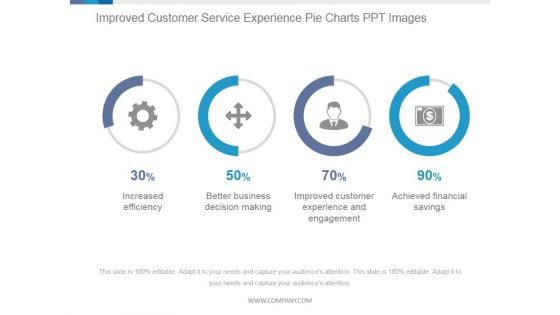
Improved Customer Service Experience Pie Charts Ppt PowerPoint Presentation Templates
This is a improved customer service experience pie charts ppt powerpoint presentation templates. This is a four stage process. The stages in this process are increased efficiency, better business decision making, improved customer experience and engagement, achieved financial savings.

Xbar And R Chart Ppt PowerPoint Presentation Example 2015
This is a xbar and r chart ppt powerpoint presentation example 2015. This is a two stage process. The stages in this process are business, strategy, marketing, success, growth strategy.
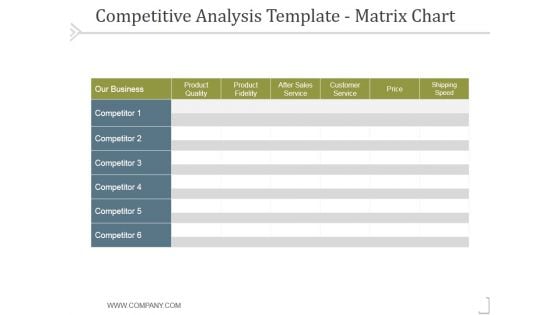
Competitive Analysis Matrix Chart Template 1 Ppt PowerPoint Presentation Deck
This is a competitive analysis matrix chart template 1 ppt powerpoint presentation deck. This is a six stage process. The stages in this process are product quality, product fidelity, after sales service, customer service, shipping speed.
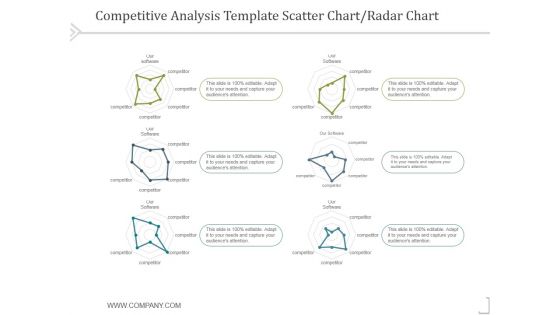
Competitive Analysis Scatter Chart Template 1 Ppt PowerPoint Presentation Themes
This is a competitive analysis scatter chart template 1 ppt powerpoint presentation themes. This is a six stage process. The stages in this process are business, strategy, marketing, success, analysis.
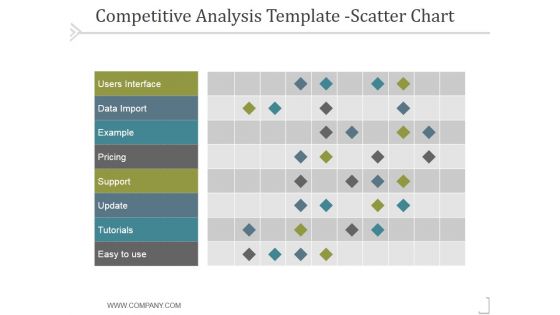
Competitive Analysis Scatter Chart Template 2 Ppt PowerPoint Presentation Files
This is a competitive analysis scatter chart template 2 ppt powerpoint presentation files. This is a nine stage process. The stages in this process are users interface, data import, example, pricing, support, update.
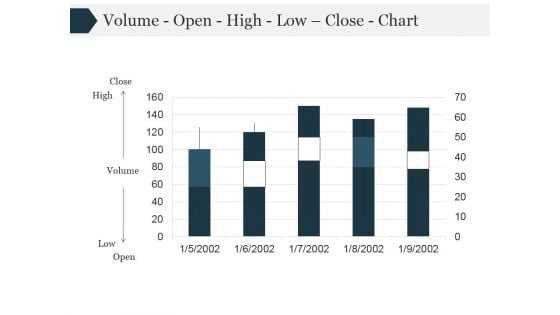
Volume Open High Low Close Chart Ppt PowerPoint Presentation Themes
This is a volume open high low close chart ppt powerpoint presentation themes. This is a five stage process. The stages in this process are high, volume, close, low.
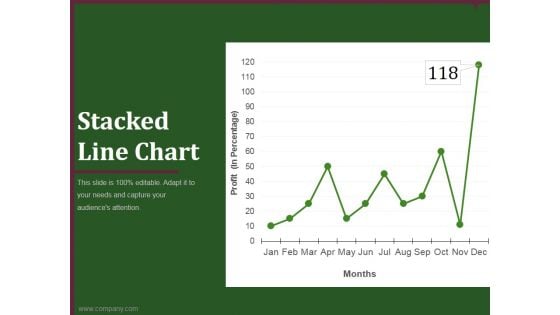
Stacked Line Chart Ppt PowerPoint Presentation Background Image
This is a stacked line chart ppt powerpoint presentation background image. This is a twelve stage process. The stages in this process are business, marketing, analysis, finance, growth strategy.
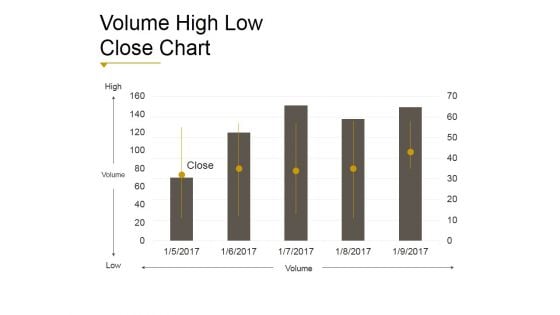
Volume High Low Close Chart Ppt PowerPoint Presentation Shapes
This is a volume high low close chart ppt powerpoint presentation shapes. This is a five stage process. The stages in this process are business, strategy, analysis, marketing, finance, growth.
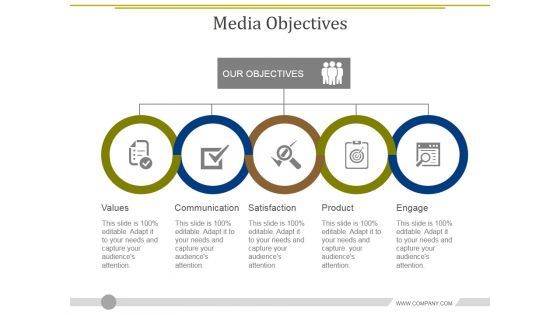
Media Objectives Template 2 Ppt PowerPoint Presentation Diagram Graph Charts
This is a media objectives template 2 ppt powerpoint presentation diagram graph charts. This is a five stage process. The stages in this process are values, communication, satisfaction, product, engage.
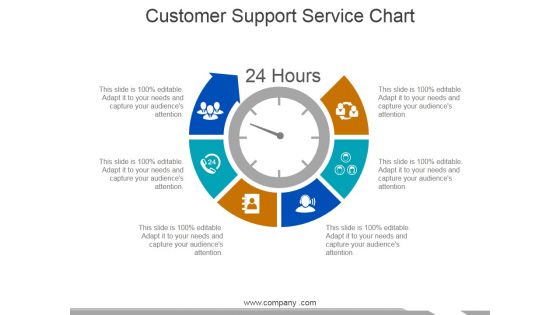
Customer Support Service Chart Ppt PowerPoint Presentation Infographic Template Graphics
This is a customer support service chart ppt powerpoint presentation infographic template graphics. This is a six stage process. The stages in this process are business, icons, strategy, marketing.
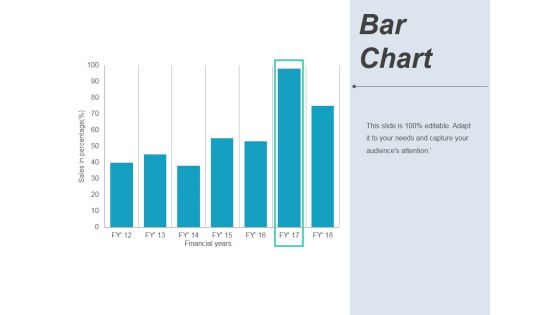
Bar Chart Ppt PowerPoint Presentation Pictures Background Image
This is a bar chart ppt powerpoint presentation pictures background image. This is a seven stage process. The stages in this process are financial years, sales in percentage, graph, business.
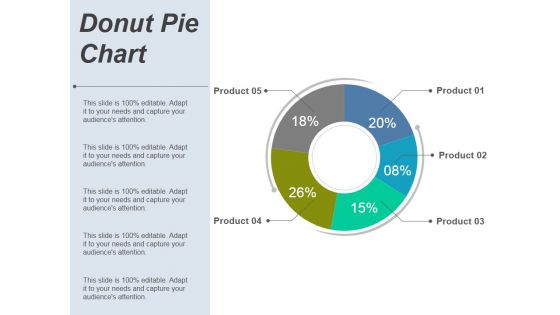
Donut Pie Chart Ppt PowerPoint Presentation Infographic Template Layout Ideas
This is a donut pie chart ppt powerpoint presentation infographic template layout ideas. This is a five stage process. The stages in this process are product, business, finance, marketing.
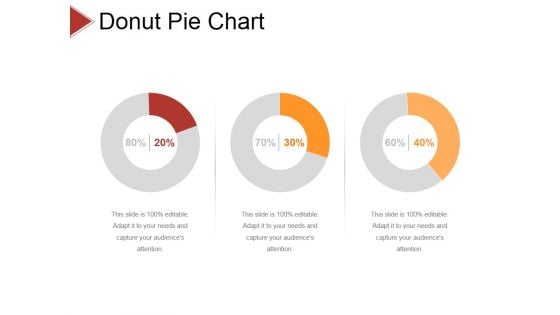
Donut Pie Chart Ppt PowerPoint Presentation Infographic Template Diagrams
This is a donut pie chart ppt powerpoint presentation infographic template diagrams. This is a three stage process. The stages in this process are business, strategy, analysis, pretention, comparison.
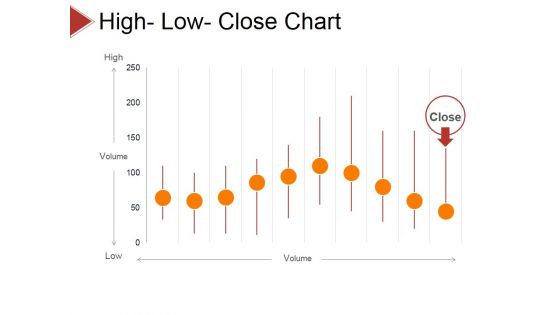
High Low Close Chart Ppt PowerPoint Presentation Layouts Visual Aids
This is a high low close chart ppt powerpoint presentation layouts visual aids. This is a ten stage process. The stages in this process are volume, high, low, close.
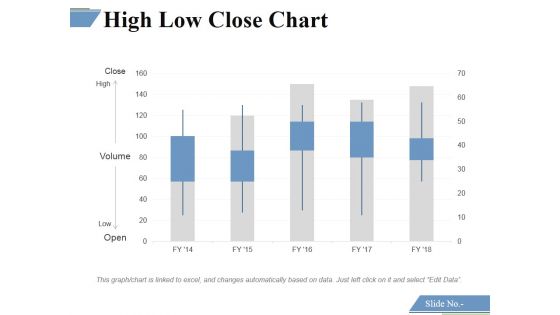
High Low Close Chart Ppt PowerPoint Presentation Professional Background Images
This is a high low close chart ppt powerpoint presentation professional background images. This is a five stage process. The stages in this process are close, high, volume, low, open.
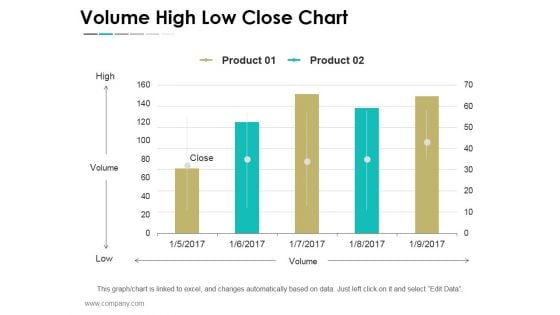
Volume High Low Close Chart Ppt PowerPoint Presentation Show Outfit
This is a volume high low close chart ppt powerpoint presentation show outfit. This is a five stage process. The stages in this process are business, strategy, marketing, success, finance, growth.
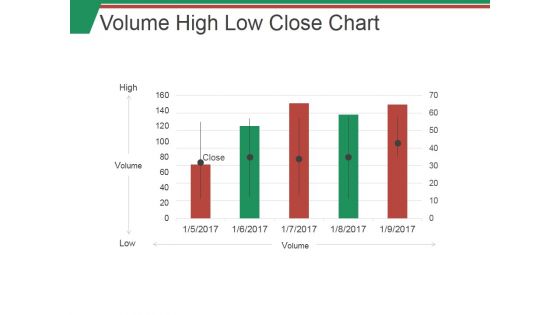
Volume High Low Close Chart Ppt PowerPoint Presentation Outline Examples
This is a volume high low close chart ppt powerpoint presentation outline examples. This is a five stage process. The stages in this process are high, low, volume, graph, business.
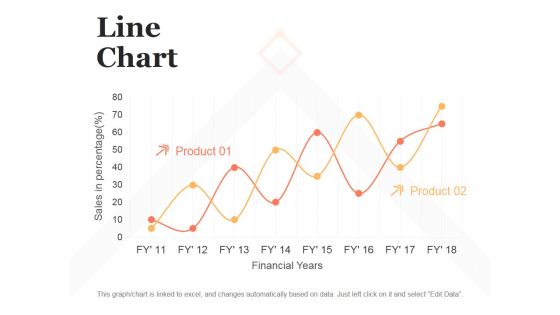
Line Chart Ppt PowerPoint Presentation Model Design Templates
This is a line chart ppt powerpoint presentation model design templates. This is a two stage process. The stages in this process are sales in percentage, financial years, product.
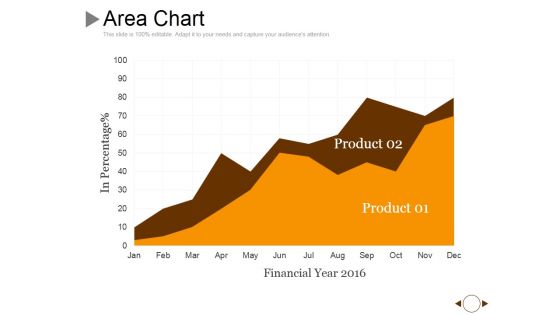
Area Chart Ppt PowerPoint Presentation Show Layout Ideas
This is a area chart ppt powerpoint presentation show layout ideas. This is a two stage process. The stages in this process are product, in percentage, financial year, growth.
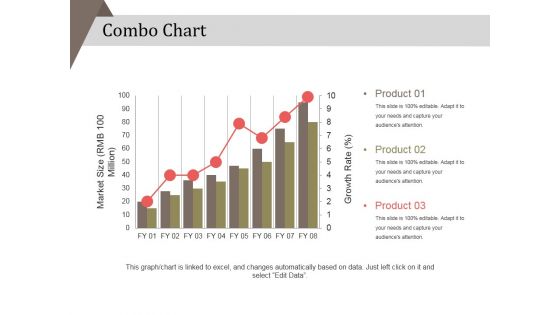
Combo Chart Ppt PowerPoint Presentation Infographic Template Brochure
This is a combo chart ppt powerpoint presentation infographic template brochure. This is a eight stage process. The stages in this process are product, market size, strategy, business, marketing.
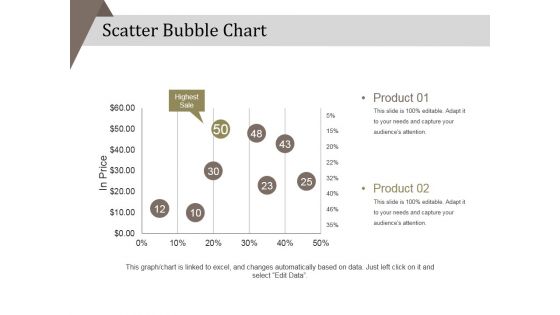
Scatter Bubble Chart Ppt PowerPoint Presentation Diagram Ppt
This is a scatter bubble chart ppt powerpoint presentation diagram ppt. This is a two stage process. The stages in this process are product, in price, highest sale, percentage, business, marketing.

Scatter Bubble Chart Ppt PowerPoint Presentation Infographics Backgrounds
This is a scatter bubble chart ppt powerpoint presentation infographics backgrounds. This is a five stage process. The stages in this process are highest sale, in price, growth, success, business.
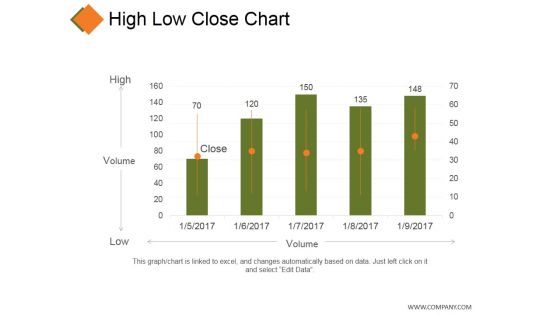
High Low Close Chart Ppt PowerPoint Presentation Model Grid
This is a high low close chart ppt powerpoint presentation model grid. This is a five stage process. The stages in this process are business, high, volume, low, marketing.
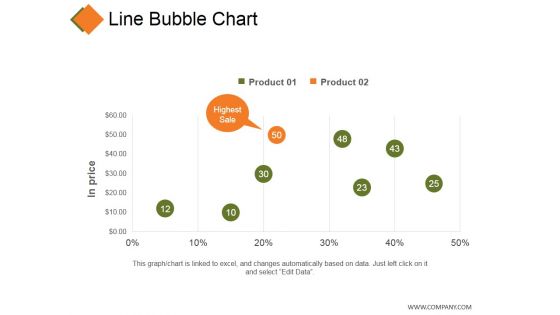
Line Bubble Chart Ppt PowerPoint Presentation Professional Infographic Template
This is a line bubble chart ppt powerpoint presentation professional infographic template. This is a five stage process. The stages in this process are product, in price, highest sale, business, finance.
Donut Pie Chart Ppt PowerPoint Presentation Icon Slide Portrait
This is a donut pie chart ppt powerpoint presentation icon slide portrait. This is a five stage process. The stages in this process are product, percentage, finance, donut, business.
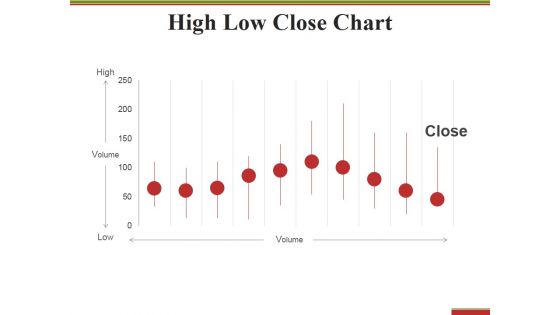
High Low Close Chart Ppt PowerPoint Presentation Styles Display
This is a high low close chart ppt powerpoint presentation styles display. This is a ten stage process. The stages in this process are high, volume, low, close, finance.
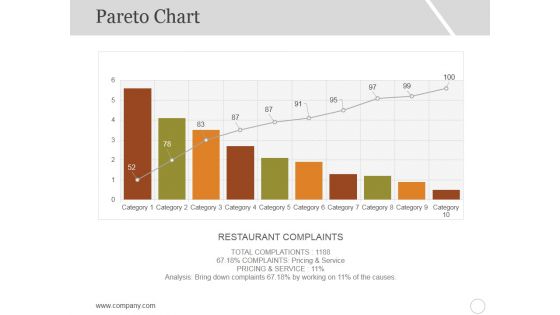
Pareto Chart Template 1 Ppt PowerPoint Presentation Ideas Graphics
This is a pareto chart template 1 ppt powerpoint presentation ideas graphics. This is a ten stage process. The stages in this process are restaurant complaints, category, business, graph.
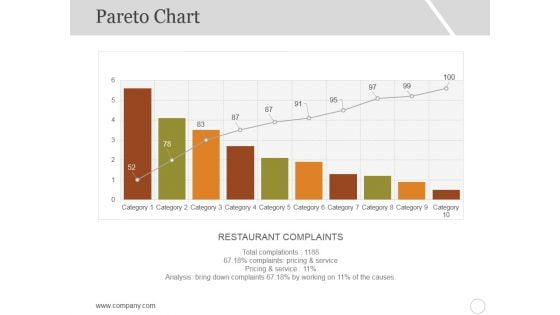
Pareto Chart Template 2 Ppt PowerPoint Presentation Portfolio Gallery
This is a pareto chart template 2 ppt powerpoint presentation portfolio gallery. This is a ten stage process. The stages in this process are restaurant complaints, category, business, graph.

Xbar And R Chart Ppt PowerPoint Presentation Inspiration Styles
This is a xbar and r chart ppt powerpoint presentation inspiration styles. This is a two stage process. The stages in this process are subtitle, lcl, ucl, growth, graph.

Column Chart Ppt PowerPoint Presentation Styles Graphic Tips
This is a column chart ppt powerpoint presentation styles graphic tips. This is a six stage process. The stages in this process are slide bar, business, marketing, strategy, finance.


 Continue with Email

 Home
Home


