Records Management
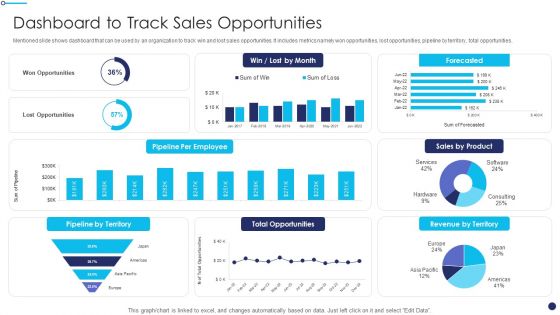
Effective Sales Technique For New Product Launch Dashboard To Track Sales Opportunities Introduction PDF
Mentioned slide shows dashboard that can be used by an organization to track win and lost sales opportunities. It includes metrics namely won opportunities, lost opportunities, pipeline by territory, total opportunities.Deliver an awe inspiring pitch with this creative Effective Sales Technique For New Product Launch Dashboard To Track Sales Opportunities Introduction PDF bundle. Topics like Lost Opportunities, Total Opportunities, Revenue Territory can be discussed with this completely editable template. It is available for immediate download depending on the needs and requirements of the user.
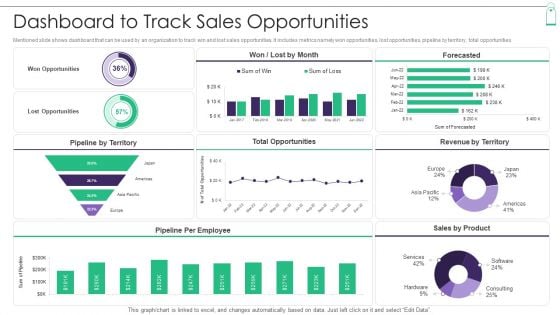
New Product Sales Strategy And Marketing Dashboard To Track Sales Opportunities Rules PDF
Mentioned slide shows dashboard that can be used by an organization to track win and lost sales opportunities. It includes metrics namely won opportunities, lost opportunities, pipeline by territory, total opportunities. Deliver and pitch your topic in the best possible manner with this New Product Sales Strategy And Marketing Dashboard To Track Sales Opportunities Rules PDF. Use them to share invaluable insights on Won Opportunities, Lost Opportunities, Revenue and impress your audience. This template can be altered and modified as per your expectations. So, grab it now.
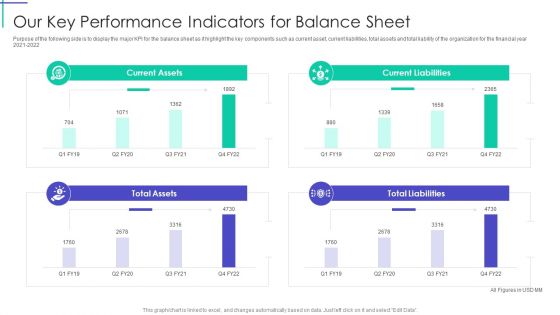
Mortgage Recovery Strategy For Finance Companies Our Key Performance Indicators For Balance Sheet Inspiration PDF
Purpose of the following side is to display the major KPI for the balance sheet as it highlight the key components such as current asset, current liabilities, total assets and total liability of the organization for the financial year 2021 to 2022. Deliver an awe inspiring pitch with this creative Mortgage Recovery Strategy For Finance Companies Our Key Performance Indicators For Balance Sheet Inspiration PDF bundle. Topics like Current Assets, Current Liabilities, Total Liabilities can be discussed with this completely editable template. It is available for immediate download depending on the needs and requirements of the user.
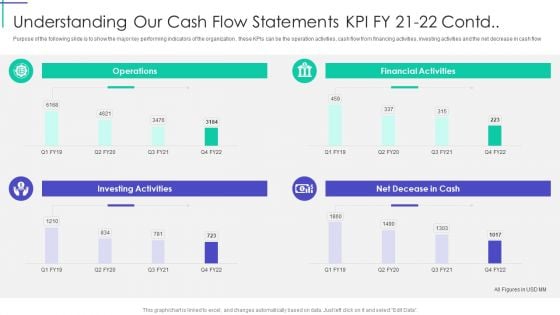
Understanding Our Cash Flow Statements KPI Fy 21 To 22 Contd Themes PDF
Purpose of the following slide is to show the major key performing indicators of the organization , these KPIs can be the operation activities, cash flow from financing activities, investing activities and the net decrease in cash flow Deliver and pitch your topic in the best possible manner with this Understanding Our Cash Flow Statements KPI Fy 21 To 22 Contd Themes PDF. Use them to share invaluable insights on Investing Activities, Financial Activities, Operations and impress your audience. This template can be altered and modified as per your expectations. So, grab it now.
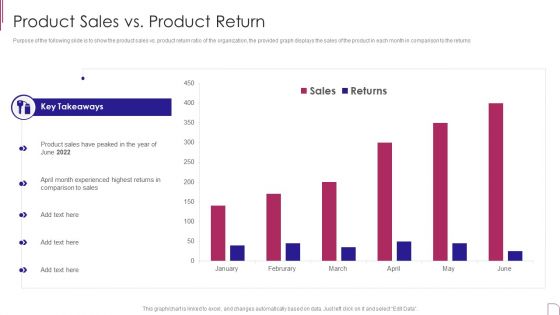
Yearly Product Performance Assessment Repor Product Sales Vs Product Return Information PDF
Purpose of the following slide is to show the product sales vs. product return ratio of the organization, the provided graph displays the sales of the product in each month in comparison to the returns.Deliver an awe inspiring pitch with this creative Yearly Product Performance Assessment Repor Product Sales Vs Product Return Information PDF bundle. Topics like Key Takeaways, Experienced Highest, Comparison Sales can be discussed with this completely editable template. It is available for immediate download depending on the needs and requirements of the user.
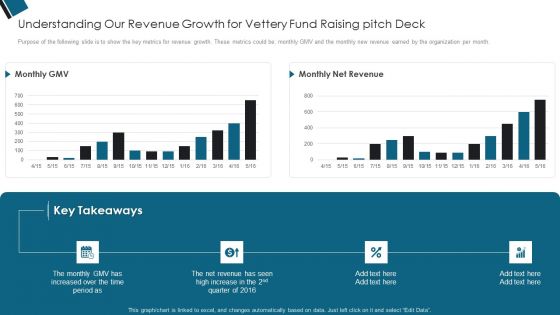
Understanding Our Revenue Growth For Vettery Fund Raising Pitch Deck Ppt PowerPoint Presentation Layouts Brochure PDF
Purpose of the following slide is to show the key metrics for revenue growth. These metrics could be monthly GMV and the monthly new revenue earned by the organization per month.Deliver and pitch your topic in the best possible manner with this Understanding Our Revenue Growth For Vettery Fund Raising Pitch Deck Ppt PowerPoint Presentation Layouts Brochure PDF Use them to share invaluable insights on Key Takeaways, Time Period, Increased Over and impress your audience. This template can be altered and modified as per your expectations. So, grab it now.
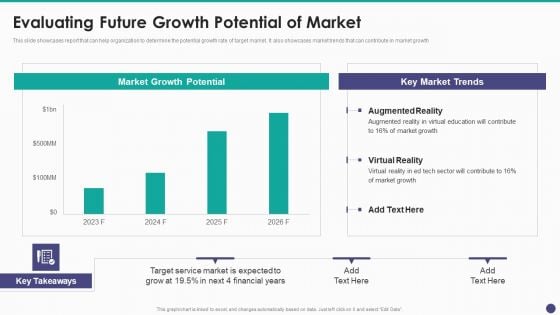
New Service Launch And Development Strategy To Gain Market Share Evaluating Future Growth Potential Of Market Clipart PDF
This slide showcases report that can help organization to determine the potential growth rate of target market. It also showcases market trends that can contribute in market growth.Deliver an awe inspiring pitch with this creative New Service Launch And Development Strategy To Gain Market Share Evaluating Future Growth Potential Of Market Clipart PDF bundle. Topics like Growth Potential, Market Trends, Augmented Reality can be discussed with this completely editable template. It is available for immediate download depending on the needs and requirements of the user.
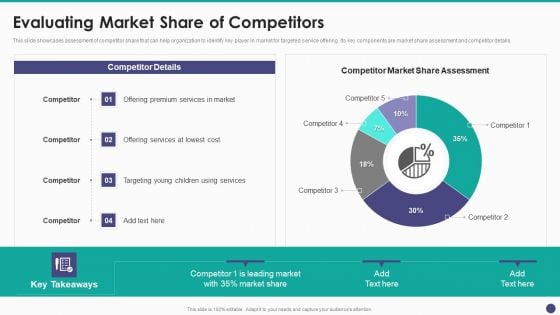
New Service Launch And Development Strategy To Gain Market Share Evaluating Market Share Of Competitors Information PDF
This slide showcases assessment of competitor share that can help organization to identify key player in market for targeted service offering. Its key components are market share assessment and competitor details.Deliver and pitch your topic in the best possible manner with this New Service Launch And Development Strategy To Gain Market Share Evaluating Market Share Of Competitors Information PDF Use them to share invaluable insights on Competitor Details, Competitor Market, Premium Services and impress your audience. This template can be altered and modified as per your expectations. So, grab it now.
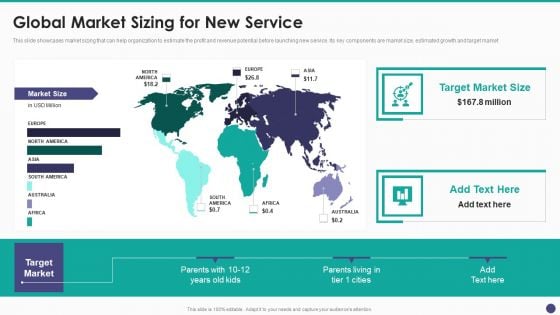
New Service Launch And Development Strategy To Gain Market Share Global Market Sizing For New Service Diagrams PDF
This slide showcases market sizing that can help organization to estimate the profit and revenue potential before launching new service. Its key components are market size, estimated growth and target market.Deliver and pitch your topic in the best possible manner with this New Service Launch And Development Strategy To Gain Market Share Global Market Sizing For New Service Diagrams PDF Use them to share invaluable insights on Global Market, Sizing, New Service and impress your audience. This template can be altered and modified as per your expectations. So, grab it now.
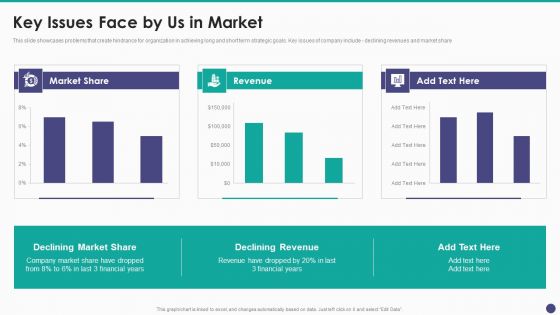
New Service Launch And Development Strategy To Gain Market Share Key Issues Face By Us In Market Formats PDF
This slide showcases problems that create hindrance for organization in achieving long and short term strategic goals. Key issues of company include - declining revenues and market share.Deliver and pitch your topic in the best possible manner with this New Service Launch And Development Strategy To Gain Market Share Key Issues Face By Us In Market Formats PDF Use them to share invaluable insights on Market Share, Revenue, Declining Revenue and impress your audience. This template can be altered and modified as per your expectations. So, grab it now.
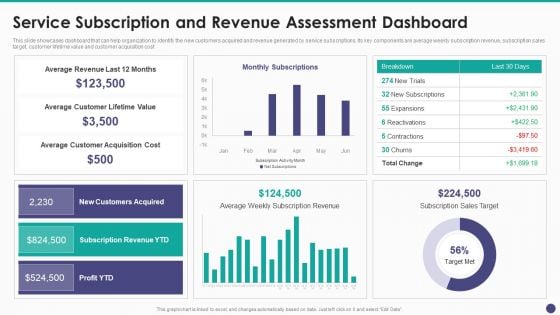
New Service Launch And Development Strategy To Gain Market Share Service Subscription And Revenue Demonstration PDF
This slide showcases dashboard that can help organization to identify the new customers acquired and revenue generated by service subscriptions. Its key components are average weekly subscription revenue, subscription sales target, customer lifetime value and customer acquisition cost.Deliver an awe inspiring pitch with this creative New Service Launch And Development Strategy To Gain Market Share Service Subscription And Revenue Demonstration PDF bundle. Topics like Average Revenue, Average Customer, Customer Acquisition can be discussed with this completely editable template. It is available for immediate download depending on the needs and requirements of the user.
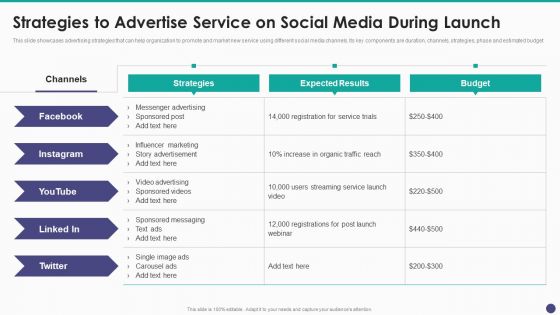
New Service Launch And Development Strategy To Gain Market Share Strategies To Advertise Service On Social Summary PDF
This slide showcases advertising strategies that can help organization to promote and market new service using different social media channels. Its key components are duration, channels, strategies, phase and estimated budget.Deliver and pitch your topic in the best possible manner with this New Service Launch And Development Strategy To Gain Market Share Strategies To Advertise Service On Social Summary PDF Use them to share invaluable insights on Influencer Marketing, Influencer Marketing, Expected Results and impress your audience. This template can be altered and modified as per your expectations. So, grab it now.
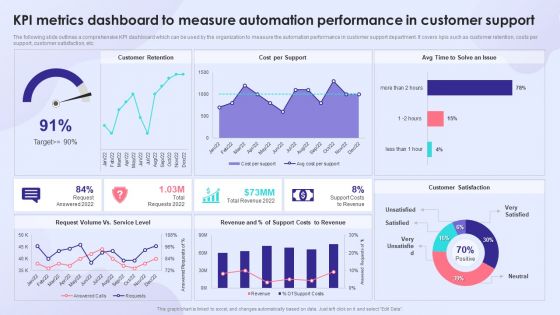
KPI Metrics Dashboard To Measure Automation Performance In Customer Support Professional PDF
The following slide outlines a comprehensive KPI dashboard which can be used by the organization to measure the automation performance in customer support department. It covers kpis such as customer retention, costs per support, customer satisfaction, etc. Deliver and pitch your topic in the best possible manner with this KPI Metrics Dashboard To Measure Automation Performance In Customer Support Professional PDF. Use them to share invaluable insights on Customer Retention, Cost Per Support, Support Costs To Revenue and impress your audience. This template can be altered and modified as per your expectations. So, grab it now.
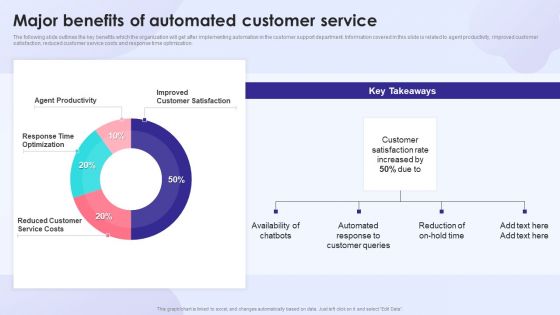
Major Benefits Of Automated Customer Service Brochure PDF
The following slide outlines the key benefits which the organization will get after implementing automation in the customer support department. Information covered in this slide is related to agent productivity, improved customer satisfaction, reduced customer service costs and response time optimization. Deliver an awe inspiring pitch with this creative Major Benefits Of Automated Customer Service Brochure PDF bundle. Topics like Improved Customer Satisfaction, Agent Productivity, Response Time Optimization can be discussed with this completely editable template. It is available for immediate download depending on the needs and requirements of the user.
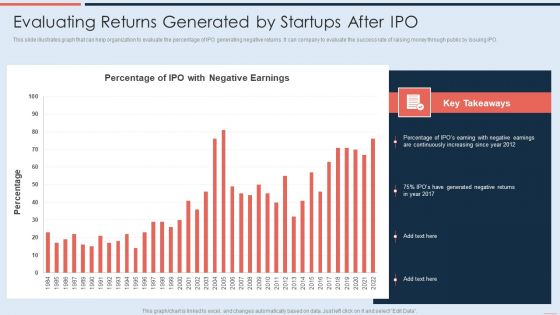
Evaluating Returns Generated By Startups After IPO Brochure PDF
This slide illustrates graph that can help organization to evaluate the percentage of IPO generating negative returns. It can company to evaluate the success rate of raising money through public by issuing IPO. Deliver and pitch your topic in the best possible manner with this Evaluating Returns Generated By Startups After IPO Brochure PDF. Use them to share invaluable insights on Percentage, Continuously Increasing, Generated Negative Returns and impress your audience. This template can be altered and modified as per your expectations. So, grab it now.
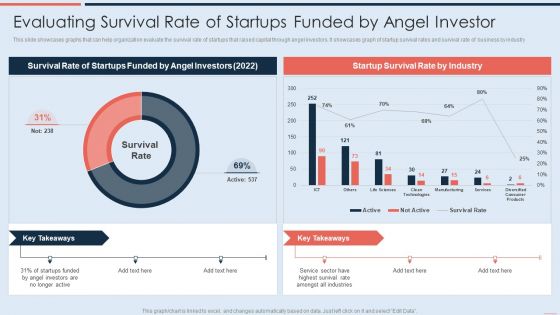
Evaluating Survival Rate Of Startups Funded By Angel Investor Mockup PDF
This slide showcases graphs that can help organization evaluate the survival rate of startups that raised capital through angel investors. It showcases graph of startup survival rates and survival rate of business by industry Deliver and pitch your topic in the best possible manner with this Evaluating Survival Rate Of Startups Funded By Angel Investor Mockup PDF. Use them to share invaluable insights on Survival Rate, Service, Angel Investors and impress your audience. This template can be altered and modified as per your expectations. So, grab it now.
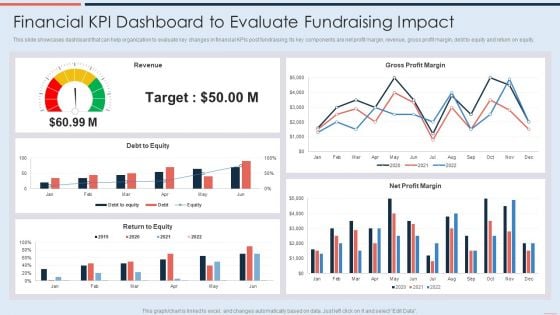
Financial Kpi Dashboard To Evaluate Fundraising Impact Demonstration PDF
This slide showcases dashboard that can help organization to evaluate key changes in financial KPIs post fundraising. Its key components are net profit margin, revenue, gross profit margin, debt to equity and return on equity. Deliver and pitch your topic in the best possible manner with this Financial Kpi Dashboard To Evaluate Fundraising Impact Demonstration PDF. Use them to share invaluable insights on Debt To Equity, Revenue, Gross Profit Margin and impress your audience. This template can be altered and modified as per your expectations. So, grab it now.
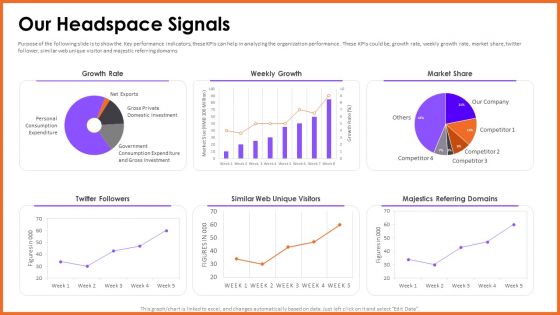
Headspace Fund Raising Pitch Deck Our Headspace Signals Microsoft PDF
Purpose of the following slide is to show the Key performance indicators, these KPIs can help in analyzing the organization performance . These KPIs could be growth rate, weekly growth rate, market share, twitter follower, similar web unique visitor and majestic referring domains.Deliver and pitch your topic in the best possible manner with this Headspace Fund Raising Pitch Deck Our Headspace Signals Microsoft PDF. Use them to share invaluable insights on Growth Rate, Weekly Growth, Referring Domains and impress your audience. This template can be altered and modified as per your expectations. So, grab it now.
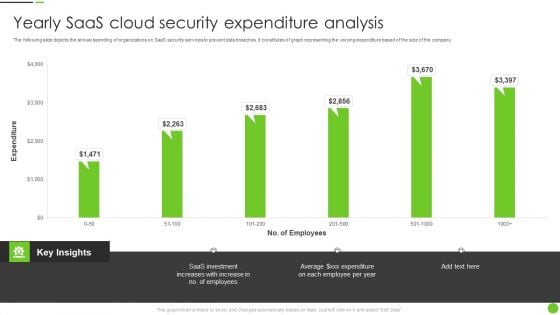
Yearly Saas Cloud Security Expenditure Analysis Ppt PowerPoint Presentation File Deck PDF
The following slide depicts the annual spending of organizations on SaaS security services to prevent data breaches. It constitutes of graph representing the varying expenditure based of the size of the company. Pitch your topic with ease and precision using this Yearly Saas Cloud Security Expenditure Analysis Ppt PowerPoint Presentation File Deck PDF. This layout presents information on Saas Investment, Employees. It is also available for immediate download and adjustment. So, changes can be made in the color, design, graphics or any other component to create a unique layout.
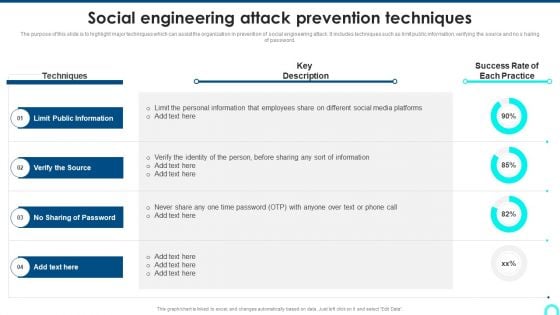
Social Engineering Attack Prevention Techniques Template PDF
The purpose of this slide is to highlight major techniques which can assist the organization in prevention of social engineering attack. It includes techniques such as limit public information, verifying the source and no s haring of password. Deliver an awe inspiring pitch with this creative Social Engineering Attack Prevention Techniques Template PDF bundle. Topics like Public Information, Sharing Of Password, Personal Information can be discussed with this completely editable template. It is available for immediate download depending on the needs and requirements of the user.
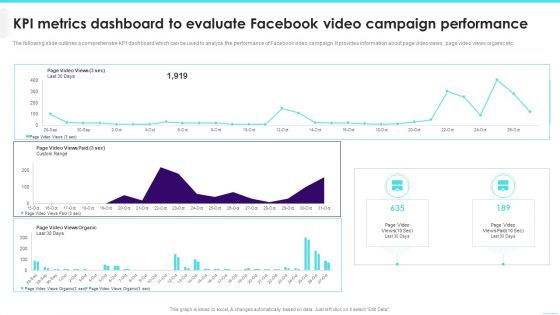
KPI Metrics Dashboard To Evaluate Facebook Video Campaign Performance Elements PDF
The following slide outlines a comprehensive KPI dashboard which can be used to analyze the performance of Facebook video campaign. It provides information about page video views, page video views organic etc.Deliver and pitch your topic in the best possible manner with this KPI Metrics Dashboard To Evaluate Facebook Video Campaign Performance Elements PDF. Use them to share invaluable insights on Custom Range, Page Video, Views Paid and impress your audience. This template can be altered and modified as per your expectations. So, grab it now.
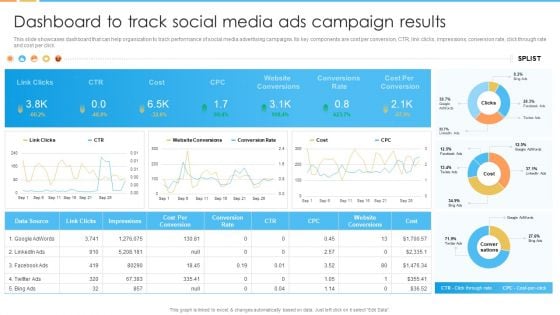
Digital Marketing Guide For B2B Firms Dashboard To Track Social Media Ads Campaign Results Topics PDF
This slide showcases dashboard that can help organization to track performance of social media advertising campaigns. Its key components are cost per conversion, CTR, link clicks, impressions, conversion rate, click through rate and cost per click.Deliver and pitch your topic in the best possible manner with this Digital Marketing Guide For B2B Firms Dashboard To Track Social Media Ads Campaign Results Topics PDF. Use them to share invaluable insights on Website Conversions, Conversions Rate, Cost Per Conversion and impress your audience. This template can be altered and modified as per your expectations. So, grab it now.
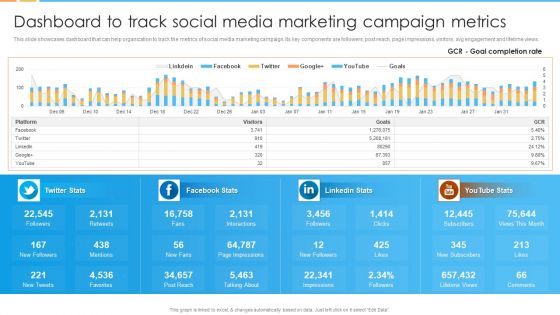
Digital Marketing Guide For B2B Firms Dashboard To Track Social Media Marketing Campaign Metrics Demonstration PDF
This slide showcases dashboard that can help organization to track the metrics of social media marketing campaign. Its key components are followers, post reach, page impressions, visitors, avg engagement and lifetime views.Deliver an awe inspiring pitch with this creative Digital Marketing Guide For B2B Firms Dashboard To Track Social Media Marketing Campaign Metrics Demonstration PDF bundle. Topics like Page Impressions, New Followers, Talking About can be discussed with this completely editable template. It is available for immediate download depending on the needs and requirements of the user.
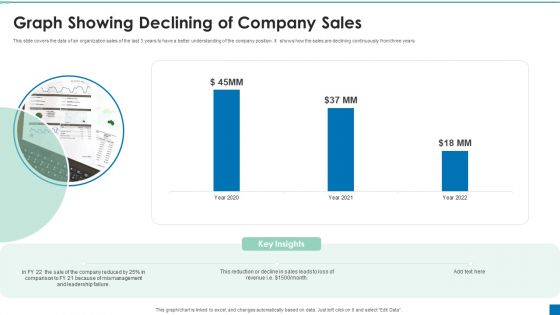
Graph Showing Declining Of Company Sales Ppt PowerPoint Presentation Portfolio Graphics Example PDF
This slide covers the data of an organization sales of the last 3 years to have a better understanding of the company position. It shows how the sales are declining continuously from three years.Pitch your topic with ease and precision using this Graph Showing Declining Of Company Sales Ppt PowerPoint Presentation Portfolio Graphics Example PDF. This layout presents information on Reduction Decline, Comparison, Mismanagement. It is also available for immediate download and adjustment. So, changes can be made in the color, design, graphics or any other component to create a unique layout.
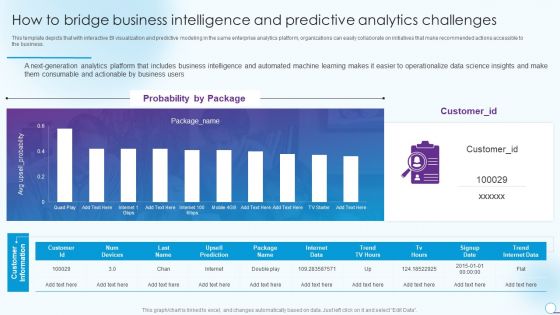
How To Bridge Business Intelligence And Predictive Analytics Challenges Microsoft PDF
This template depicts that with interactive BI visualization and predictive modeling in the same enterprise analytics platform, organizations can easily collaborate on initiatives that make recommended actions accessible to the business. Deliver an awe inspiring pitch with this creative How To Bridge Business Intelligence And Predictive Analytics Challenges Microsoft PDF bundle. Topics like Business Intelligence, Operationalize Data Science, Probability By Package can be discussed with this completely editable template. It is available for immediate download depending on the needs and requirements of the user.
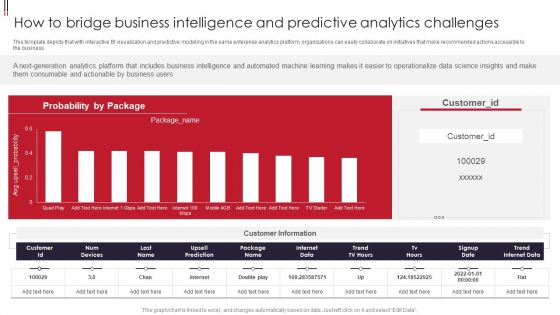
Information Visualizations Playbook How To Bridge Business Intelligence And Predictive Analytics Challenges Themes PDF
This template depicts that with interactive BI visualization and predictive modeling in the same enterprise analytics platform, organizations can easily collaborate on initiatives that make recommended actions accessible to the business. Deliver and pitch your topic in the best possible manner with this Information Visualizations Playbook How To Bridge Business Intelligence And Predictive Analytics Challenges Themes PDF. Use them to share invaluable insights on Business Users, Operationalize Data Science, Num Devices and impress your audience. This template can be altered and modified as per your expectations. So, grab it now.
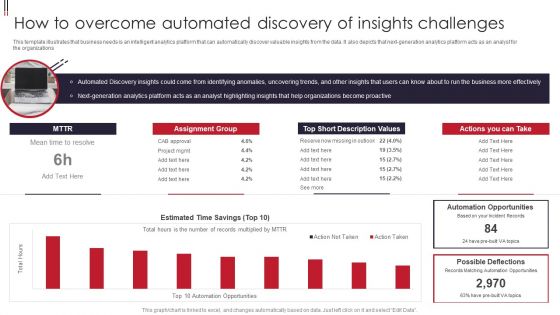
Information Visualizations Playbook How To Overcome Automated Discovery Of Insights Challenges Designs PDF
This template illustrates that business needs is an intelligent analytics platform that can automatically discover valuable insights from the data. It also depicts that next-generation analytics platform acts as an analyst for the organizations. Deliver and pitch your topic in the best possible manner with this Information Visualizations Playbook How To Overcome Automated Discovery Of Insights Challenges Designs PDF. Use them to share invaluable insights on Short Description Values, Automation Opportunities, Short Description Values, Analytics Platform and impress your audience. This template can be altered and modified as per your expectations. So, grab it now.
Gross Profit Margin Dashboard With Revenue Vs Expenses Icons PDF
This slide showcases dashboard that can help organization to evaluate the revenue generated and expenses incurred in conducting operations. It also showcases gross profit and margin of last financial year. Pitch your topic with ease and precision using this Gross Profit Margin Dashboard With Revenue Vs Expenses Icons PDF. This layout presents information on Gross Profit Margin, EBITDA Margin, Net Profit Margin. It is also available for immediate download and adjustment. So, changes can be made in the color, design, graphics or any other component to create a unique layout.
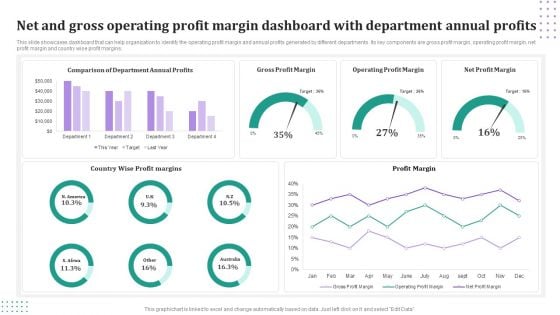
Net And Gross Operating Profit Margin Dashboard With Department Annual Profits Mockup PDF
This slide showcases dashboard that can help organization to identify the operating profit margin and annual profits generated by different departments. Its key components are gross profit margin, operating profit margin, net profit margin and country wise profit margins. Pitch your topic with ease and precision using this Net And Gross Operating Profit Margin Dashboard With Department Annual Profits Mockup PDF. This layout presents information on Gross Profit Margin, Operating Profit Margin, Net Profit Margin. It is also available for immediate download and adjustment. So, changes can be made in the color, design, graphics or any other component to create a unique layout.
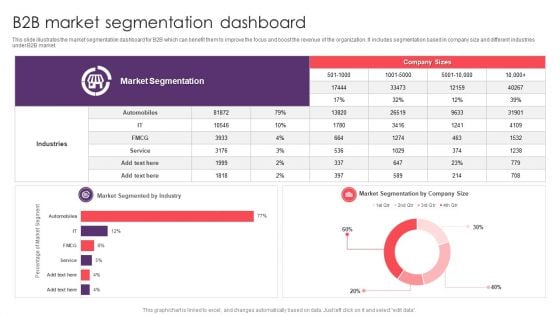
B2B Market Segmentation Dashboard Microsoft PDF
This slide illustrates the market segmentation dashboard for B2B which can benefit them to improve the focus and boost the revenue of the organization. It includes segmentation based in company size and different industries under B2B market. Pitch your topic with ease and precision using this B2B Market Segmentation Dashboard Microsoft PDF. This layout presents information on Industries, Market Segmentation, Service. It is also available for immediate download and adjustment. So, changes can be made in the color, design, graphics or any other component to create a unique layout.
Evaluating Hedge Funds For Greater ROI Hedge Fund Performance Over Time Icons PDF
This slide highlights the hedge fund performance which includes the HFRI equity hedge, event driven hedge, relative value hedge, HFRI macro and US crop fixed income with return rate. Deliver and pitch your topic in the best possible manner with this Evaluating Hedge Funds For Greater ROI Hedge Fund Performance Over Time Icons PDF. Use them to share invaluable insights on Different Funds Performance, Hedge Funds, Goals, Organization and impress your audience. This template can be altered and modified as per your expectations. So, grab it now.
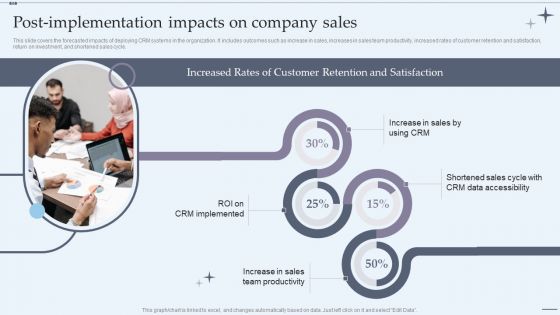
CRM System Implementation Stages Postimplementation Impacts On Company Sales Graphics PDF
This slide covers the forecasted impacts of deploying CRM systems in the organization. It includes outcomes such as increase in sales, increases in sales team productivity, increased rates of customer retention and satisfaction, return on investment, and shortened sales cycle. Deliver an awe inspiring pitch with this creative CRM System Implementation Stages Postimplementation Impacts On Company Sales Graphics PDF bundle. Topics like Data Accessibility, Team Productivity, Increase In Sales can be discussed with this completely editable template. It is available for immediate download depending on the needs and requirements of the user.
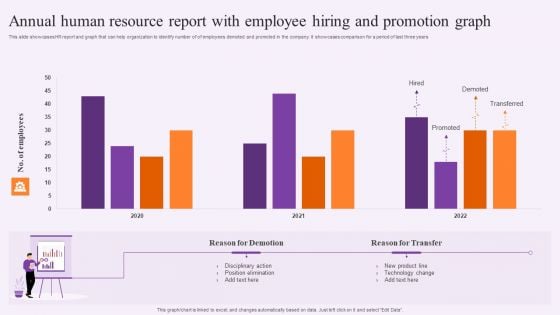
Annual Human Resource Report With Employee Hiring And Promotion Graph Mockup PDF
This slide showcases HR report and graph that can help organization to identify number of of employees demoted and promoted in the company. It showcases comparison for a period of last three years. Pitch your topic with ease and precision using this Annual Human Resource Report With Employee Hiring And Promotion Graph Mockup PDF. This layout presents information on Technology, Product, Employees. It is also available for immediate download and adjustment. So, changes can be made in the color, design, graphics or any other component to create a unique layout.
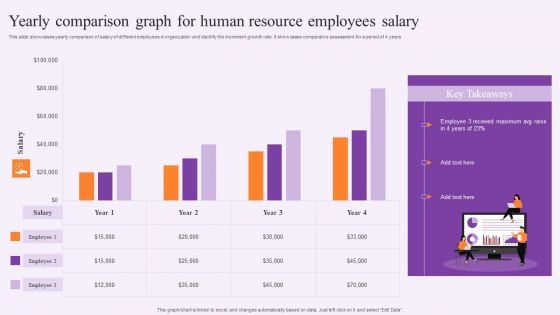
Yearly Comparison Graph For Human Resource Employees Salary Template PDF
This slide showcases yearly comparison of salary of different employees in organization and identify the increment growth rate. It showcases comparative assessment for a period of 4 years. Pitch your topic with ease and precision using this Yearly Comparison Graph For Human Resource Employees Salary Template PDF. This layout presents information on Human Resource, Employees Salary. It is also available for immediate download and adjustment. So, changes can be made in the color, design, graphics or any other component to create a unique layout.

Critical Statistics Of Blockchain And Distributed Ledger Technology Market Structure PDF
Mentioned slide highlights various insights of blockchain technology market. This slide shows key statistics about blockchain market outlook, blockchain spenders worldwide and by country. Organization can decide if embracing the technology is the right move for company using these statistics. Pitch your topic with ease and precision using this Critical Statistics Of Blockchain And Distributed Ledger Technology Market Structure PDF. This layout presents information on USA Contribution, Projected Blockchain, Market Value. It is also available for immediate download and adjustment. So, changes can be made in the color, design, graphics or any other component to create a unique layout.
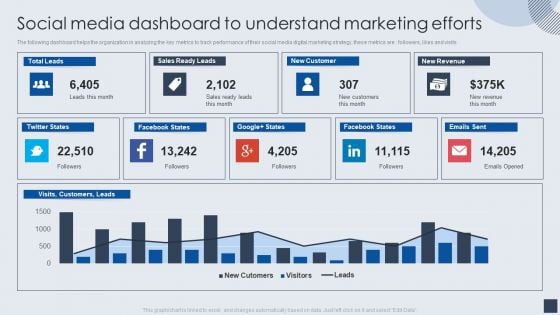
Implementing Marketing Mix Strategy To Enhance Overall Performance Social Media Dashboard To Understand Marketing Efforts Guidelines PDF
The following dashboard helps the organization in analyzing the key metrics to track performance of their social media digital marketing strategy, these metrics are followers, likes and visits. Deliver and pitch your topic in the best possible manner with this Implementing Marketing Mix Strategy To Enhance Overall Performance Social Media Dashboard To Understand Marketing Efforts Guidelines PDF. Use them to share invaluable insights on Sales, New Customer, New Revenue and impress your audience. This template can be altered and modified as per your expectations. So, grab it now.
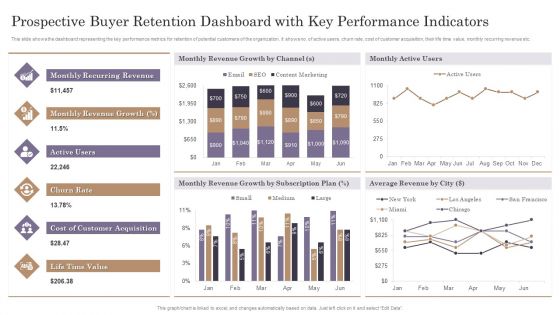
Prospective Buyer Retention Dashboard With Key Performance Indicators Themes PDF
This slide shows the dashboard representing the key performance metrics for retention of potential customers of the organization. It shows no. of active users, churn rate, cost of customer acquisition, their life time value, monthly recurring revenue etc.Pitch your topic with ease and precision using this Prospective Buyer Retention Dashboard With Key Performance Indicators Themes PDF. This layout presents information on Recurring Revenue, Revenue Growth, Customer Acquisition. It is also available for immediate download and adjustment. So, changes can be made in the color, design, graphics or any other component to create a unique layout.
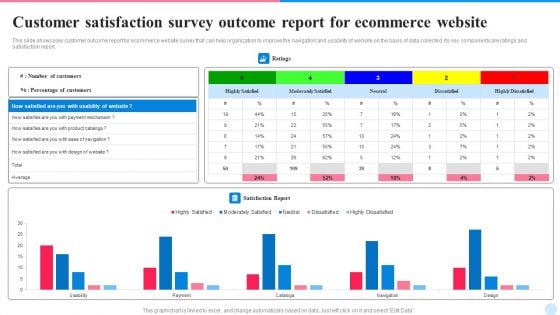
Customer Satisfaction Survey Outcome Report For Ecommerce Website Themes PDF
This slide showcases customer outcome report for ecommerce website survey that can help organization to improve the navigation and usability of website on the basis of data collected. Its key components are ratings and satisfaction report. Pitch your topic with ease and precision using this Customer Satisfaction Survey Outcome Report For Ecommerce Website Themes PDF. This layout presents information on Customer Satisfaction, Survey Outcome Report, Ecommerce Website. It is also available for immediate download and adjustment. So, changes can be made in the color, design, graphics or any other component to create a unique layout.
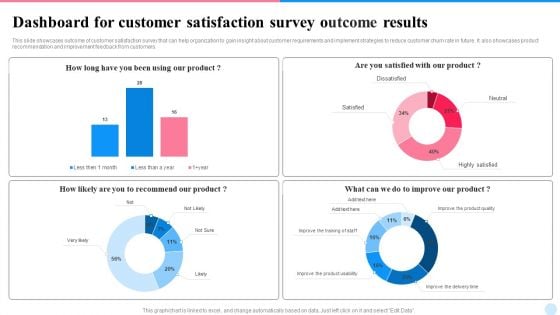
Dashboard For Customer Satisfaction Survey Outcome Results Topics PDF
This slide showcases outcome of customer satisfaction survey that can help organization to gain insight about customer requirements and implement strategies to reduce customer churn rate in future. It also showcases product recommendation and improvement feedback from customers. Pitch your topic with ease and precision using this Dashboard For Customer Satisfaction Survey Outcome Results Topics PDF. This layout presents information on Dashboard, Customer Satisfaction, Survey Outcome Results. It is also available for immediate download and adjustment. So, changes can be made in the color, design, graphics or any other component to create a unique layout.
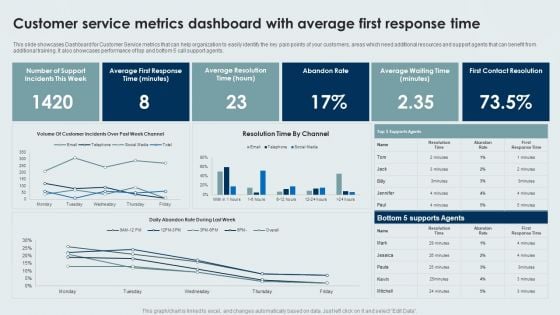
Customer Service Metrics Dashboard With Average First Response Time Background PDF
This slide showcases Dashboard for Customer Service metrics that can help organization to easily identify the key pain points of your customers, areas which need additional resources and support agents that can benefit from additional training. It also showcases performance of top and bottom 5 call support agents. Pitch your topic with ease and precision using this Customer Service Metrics Dashboard With Average First Response Time Background PDF. This layout presents information on Average, Abandon Rate, Contact Resolution. It is also available for immediate download and adjustment. So, changes can be made in the color, design, graphics or any other component to create a unique layout.
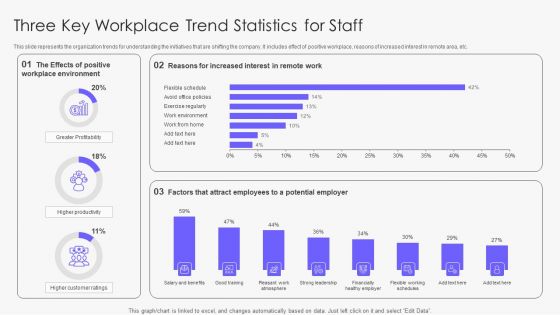
Three Key Workplace Trend Statistics For Staff Slides PDF
This slide represents the organization trends for understanding the initiatives that are shifting the company. It includes effect of positive workplace, reasons of increased interest in remote area, etc. Pitch your topic with ease and precision using this Three Key Workplace Trend Statistics For Staff Slides PDF. This layout presents information on Workplace Environment, Greater Profitability, Customer. It is also available for immediate download and adjustment. So, changes can be made in the color, design, graphics or any other component to create a unique layout.
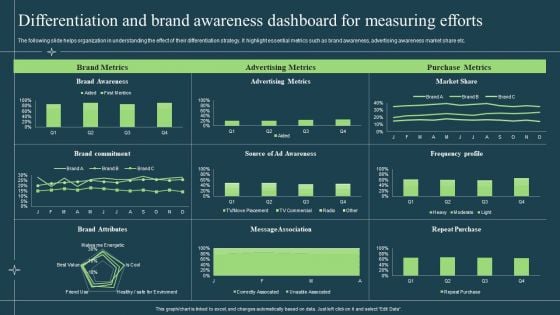
Differentiation Techniques Ways To Surpass Competitors Differentiation And Brand Awareness Dashboard For Measuring Efforts Template PDF
The following slide helps organization in understanding the effect of their differentiation strategy. It highlight essential metrics such as brand awareness, advertising awareness market share etc. Deliver and pitch your topic in the best possible manner with this Differentiation Techniques Ways To Surpass Competitors Differentiation And Brand Awareness Dashboard For Measuring Efforts Template PDF. Use them to share invaluable insights on Brand Awareness, Brand Metrics, Advertising Metrics and impress your audience. This template can be altered and modified as per your expectations. So, grab it now.
AI Playbook For Business KPI Dashboard For Tracking Business Performance Demonstration PDF
Mentioned slide portrays KPI dashboard that can be used by organizations to measure their business performance post AI introduction. KPIS covered here are progress, before versus after AI implementation, risks and issues. Deliver and pitch your topic in the best possible manner with this AI Playbook For Business KPI Dashboard For Tracking Business Performance Demonstration PDF. Use them to share invaluable insights on Performance KPIs, Progress, Risk And Issues and impress your audience. This template can be altered and modified as per your expectations. So, grab it now.
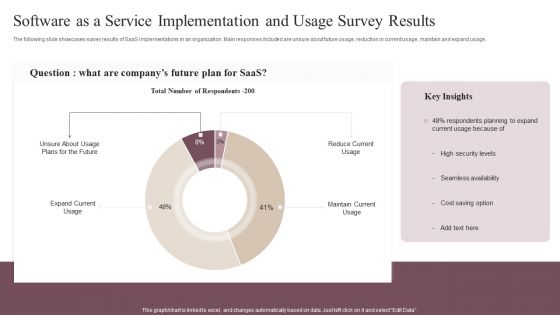
Software As A Service Implementation And Usage Survey Results Clipart PDF
The following slide showcases survey results of SaaS implementations in an organization. Main responses included are unsure about future usage, reduction in current usage, maintain and expand usage. Pitch your topic with ease and precision using this Software As A Service Implementation And Usage Survey Results Clipart PDF. This layout presents information on Reduce Current Usage, Maintain Current Usage, Expand Current Usage . It is also available for immediate download and adjustment. So, changes can be made in the color, design, graphics or any other component to create a unique layout.
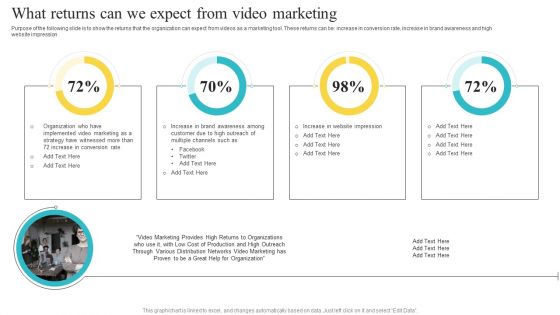
What Returns Can We Expect From Video Marketing Playbook For Social Media Platform Video Marketing Designs PDF
Purpose of the following slide is to show the returns that the organization can expect from videos as a marketing tool. These returns can be increase in conversion rate, increase in brand awareness and high website impression.Deliver and pitch your topic in the best possible manner with this What Returns Can We Expect From Video Marketing Playbook For Social Media Platform Video Marketing Designs PDF. Use them to share invaluable insights on Conversion Rate, Awareness Among, Multiple Channels and impress your audience. This template can be altered and modified as per your expectations. So, grab it now.
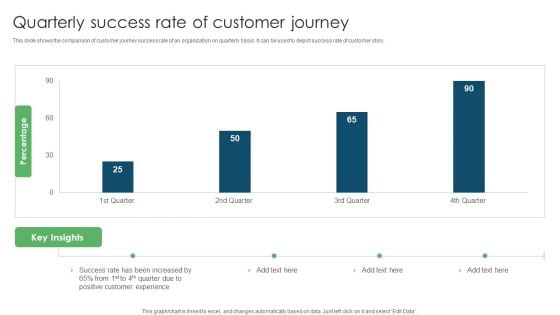
Quarterly Success Rate Of Customer Journey Ppt PowerPoint Presentation Outline Mockup PDF
This slide shows the comparison of customer journey success rate of an organization on quarterly basis. It can be used to depict success rate of customer story. Pitch your topic with ease and precision using this Quarterly Success Rate Of Customer Journey Ppt PowerPoint Presentation Outline Mockup PDF. This layout presents information on Success Rate, Increased Positive, Customer Experience. It is also available for immediate download and adjustment. So, changes can be made in the color, design, graphics or any other component to create a unique layout.
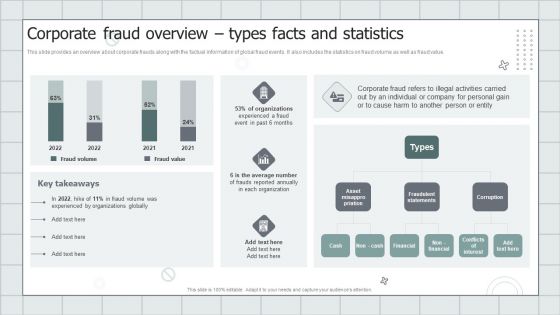
Fraud Avoidance Playbook Corporate Fraud Overview Types Facts And Statistics Introduction PDF
This slide provides an overview about corporate frauds along with the factual information of global fraud events. It also includes the statistics on fraud volume as well as fraud value. Deliver and pitch your topic in the best possible manner with this Fraud Avoidance Playbook Corporate Fraud Overview Types Facts And Statistics Introduction PDF. Use them to share invaluable insights on Organizations, Average, Fraudulent Statements and impress your audience. This template can be altered and modified as per your expectations. So, grab it now.
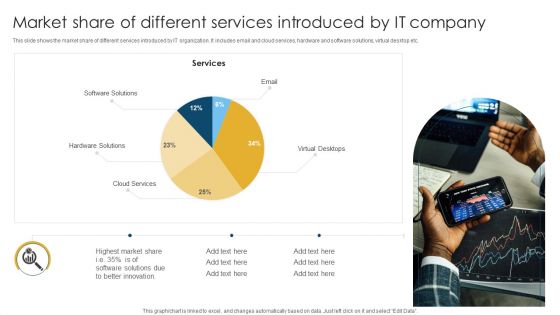
Market Share Of Different Services Introduced By IT Company Download PDF
This slide shows the market share of different services introduced by IT organization. It includes email and cloud services, hardware and software solutions, virtual desktop etc. Pitch your topic with ease and precision using this Market Share Of Different Services Introduced By IT Company Download PDF. This layout presents information on Software Solutions, Hardware Solutions, Highest Market. It is also available for immediate download and adjustment. So, changes can be made in the color, design, graphics or any other component to create a unique layout.
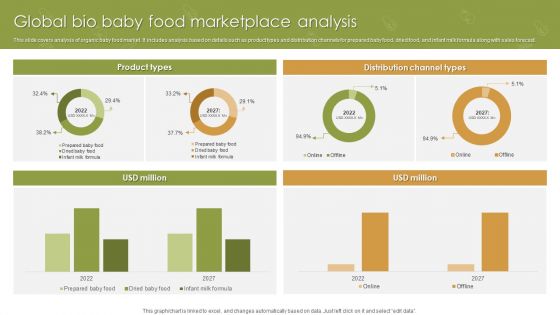
Global Bio Baby Food Marketplace Analysis Ppt Ideas Gallery PDF
This slide covers analysis of organic baby food market. It includes analysis based on details such as product types and distribution channels for prepared baby food, dried food, and infant milk formula along with sales forecast. Pitch your topic with ease and precision using this Global Bio Baby Food Marketplace Analysis Ppt Ideas Gallery PDF. This layout presents information on Product Types, Distribution Channel Types, USD Million. It is also available for immediate download and adjustment. So, changes can be made in the color, design, graphics or any other component to create a unique layout.
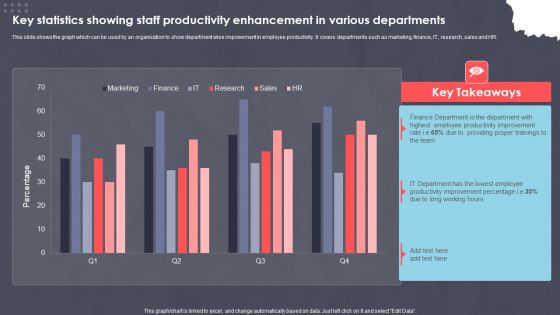
Key Statistics Showing Staff Productivity Enhancement In Various Departments Ppt PowerPoint Presentation Slides Portrait PDF
This slide shows the graph which can be used by an organization to show department wise improvement in employee productivity. It covers departments such as marketing, finance, IT, research, sales and HR. Pitch your topic with ease and precision using this Key Statistics Showing Staff Productivity Enhancement In Various Departments Ppt PowerPoint Presentation Slides Portrait PDF. This layout presents information on XXXXXXXXXXXXXXXXXXXXXXXXX. It is also available for immediate download and adjustment. So, changes can be made in the color, design, graphics or any other component to create a unique layout.
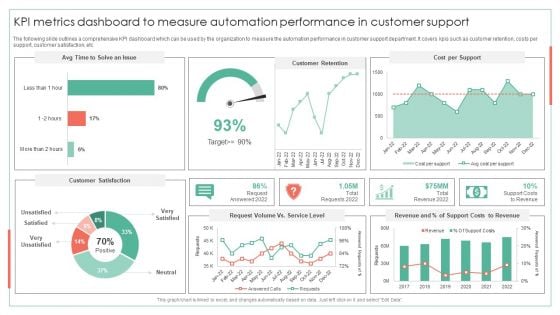
KPI Metrics Dashboard To Measure Automation Performance Achieving Operational Efficiency Guidelines PDF
The following slide outlines a comprehensive KPI dashboard which can be used by the organization to measure the automation performance in customer support department. It covers kpis such as customer retention, costs per support, customer satisfaction, etcDeliver and pitch your topic in the best possible manner with this KPI Metrics Dashboard To Measure Automation Performance Achieving Operational Efficiency Guidelines PDF. Use them to share invaluable insights on Customer Retention, Cost Per Support, Request Volume and impress your audience. This template can be altered and modified as per your expectations. So, grab it now.
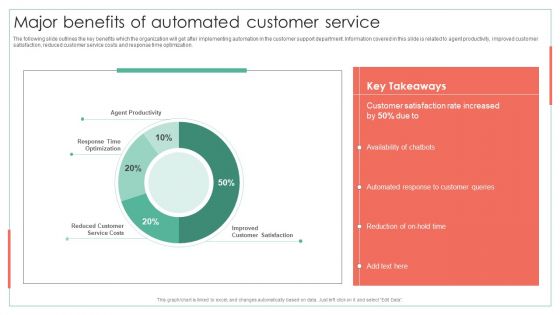
Major Benefits Of Automated Customer Service Achieving Operational Efficiency Graphics PDF
The following slide outlines the key benefits which the organization will get after implementing automation in the customer support department. Information covered in this slide is related to agent productivity, improved customer satisfaction, reduced customer service costs and response time optimization. Deliver an awe inspiring pitch with this creative Major Benefits Of Automated Customer Service Achieving Operational Efficiency Graphics PDF bundle. Topics like Customer Satisfaction, Automated Response, Customer Queries can be discussed with this completely editable template. It is available for immediate download depending on the needs and requirements of the user.

Positive Impact Post Successful Implementation Of Social Media Engagement Strategy Microsoft PDF
This slide shows major impact post implementing social media strategy for improved engagement. It provides information about organic reach, lead generation, average share per post, new page likes and followers, etc. Deliver and pitch your topic in the best possible manner with this Positive Impact Post Successful Implementation Of Social Media Engagement Strategy Microsoft PDF. Use them to share invaluable insights on Successful Implementation, Social Media Engagement Strategy and impress your audience. This template can be altered and modified as per your expectations. So, grab it now.
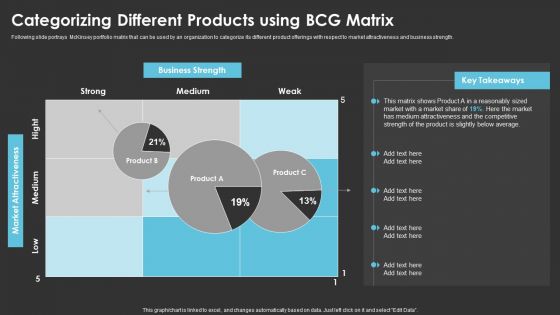
Method To Introduce New Product Offerings In The Industry Categorizing Different Products Using BCG Matrix Structure PDF
Following slide portrays McKinsey portfolio matrix that can be used by an organization to categorize its different product offerings with respect to market attractiveness and business strength. Deliver and pitch your topic in the best possible manner with this Method To Introduce New Product Offerings In The Industry Categorizing Different Products Using BCG Matrix Structure PDF. Use them to share invaluable insights on Categorizing Different Products, Matrix and impress your audience. This template can be altered and modified as per your expectations. So, grab it now.
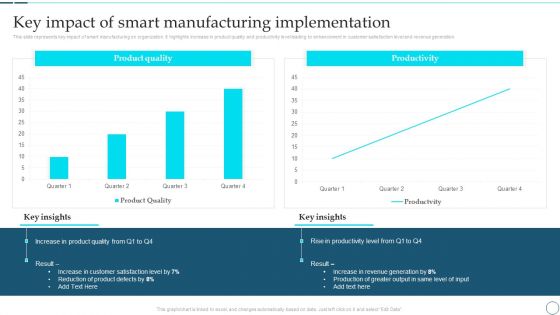
Deployment Of Smart Factory Solutions Key Impact Of Smart Manufacturing Implementation Download PDF
This slide represents key impact of smart manufacturing on organization. It highlights increase in product quality and productivity level leading to enhancement in customer satisfaction level and revenue generation. Deliver and pitch your topic in the best possible manner with this Deployment Of Smart Factory Solutions Key Impact Of Smart Manufacturing Implementation Download PDF. Use them to share invaluable insights on Product Quality, Customer Satisfaction, Product Defects, Revenue and impress your audience. This template can be altered and modified as per your expectations. So, grab it now.
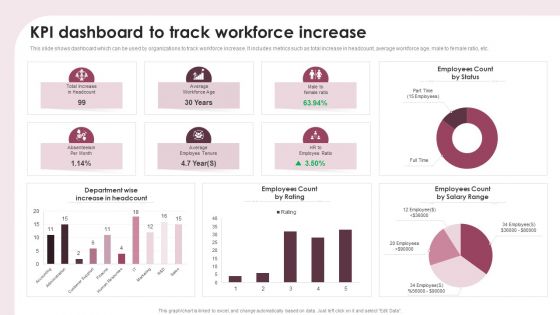
KPI Dashboard To Track Workforce Increase Ppt Show Portfolio PDF
This slide shows dashboard which can be used by organizations to track workforce increase. It includes metrics such as total increase in headcount, average workforce age, male to female ratio, etc. Pitch your topic with ease and precision using this KPI Dashboard To Track Workforce Increase Ppt Show Portfolio PDF. This layout presents information on Department Wise, Increase Headcount, Employees Count Rating. It is also available for immediate download and adjustment. So, changes can be made in the color, design, graphics or any other component to create a unique layout.
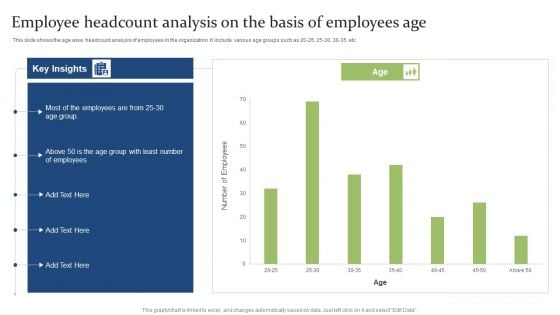
Employee Headcount Analysis On The Basis Of Employees Age Ppt PowerPoint Presentation Model Ideas PDF
This slide shows the age wise headcount analysis of employees in the organization. It include various age groups such as 20 25, 25 30, 30 35, etc.Pitch your topic with ease and precision using this Employee Headcount Analysis On The Basis Of Employees Age Ppt PowerPoint Presentation Model Ideas PDF. This layout presents information on Employee Headcount, Analysis Basis, Employees Age. It is also available for immediate download and adjustment. So, changes can be made in the color, design, graphics or any other component to create a unique layout.
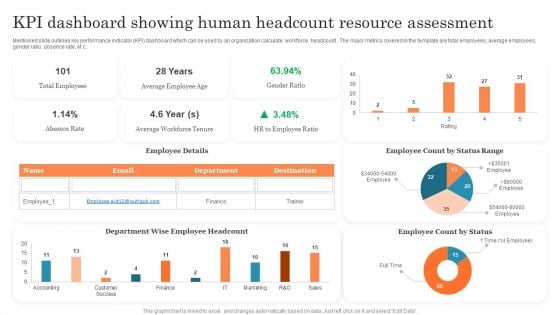
KPI Dashboard Showing Human Headcount Resource Assessment Ppt PowerPoint Presentation Outline PDF
Mentioned slide outlines key performance indicator KPI dashboard which can be used by an organization calculate workforce headcount . The major metrics covered in the template are total employees, average employees, gender ratio, absence rate, etc. Pitch your topic with ease and precision using this KPI Dashboard Showing Human Headcount Resource Assessment Ppt PowerPoint Presentation Outline PDF. This layout presents information on Total Employees, Average Employee, Employee Count. It is also available for immediate download and adjustment. So, changes can be made in the color, design, graphics or any other component to create a unique layout.
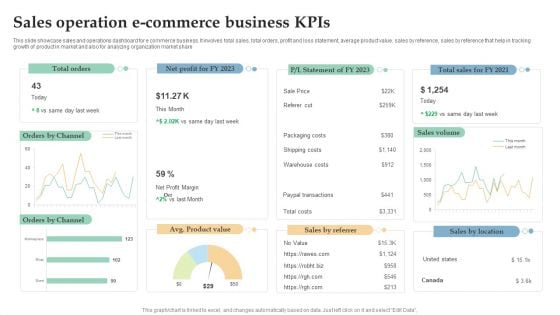
Sales Operation E Commerce Business Kpis Ppt Infographics Design Templates PDF
This slide showcase sales and operations dashboard for e commerce business. It involves total sales, total orders, profit and loss statement, average product value, sales by reference, sales by reference that help in tracking growth of product in market and also for analyzing organization market share. Pitch your topic with ease and precision using this Sales Operation E Commerce Business Kpis Ppt Infographics Design Templates PDF. This layout presents information on Total Orders, Sales Volume, Orders Channel. It is also available for immediate download and adjustment. So, changes can be made in the color, design, graphics or any other component to create a unique layout.
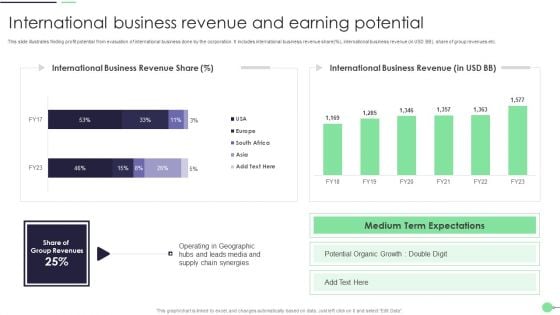
International Business Revenue And Earning Potential Guidelines PDF
This slide illustrates finding profit potential from evaluation of international business done by the corporation. It includes international business revenue share percent, international business revenue in USD BB, share of group revenues etc. Pitch your topic with ease and precision using this International Business Revenue And Earning Potential Guidelines PDF. This layout presents information on Potential Organic Growth, Supply Chain. It is also available for immediate download and adjustment. So, changes can be made in the color, design, graphics or any other component to create a unique layout.


 Continue with Email

 Home
Home


