Report Icon
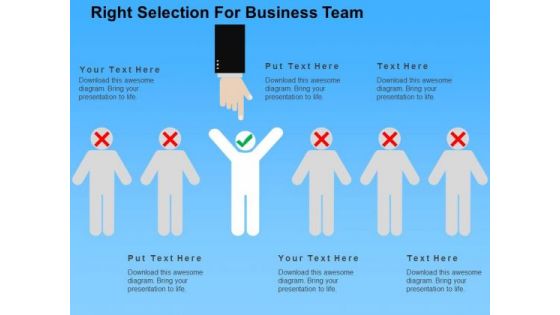
Right Selection For Business Team PowerPoint Template
This business diagram has been designed with team icons with tick and cross marks. It may use to display team selection procedure. Prove the viability of your ideas to help your organization to achieve the quality and success required.

Illustration Of Team Communication PowerPoint Template
This business diagram has been team icons with communication text. It may use to display concept of team communication. Prove the viability of your ideas to help your organization to achieve the quality and success required.

Competition Leadership PowerPoint Templates And PowerPoint Backgrounds 0611
Microsoft PowerPoint Template and Background with athelte icons running competition Achieve contemporary management style with our Competition Leadership PowerPoint Templates And PowerPoint Backgrounds 0611. They will make you look good.
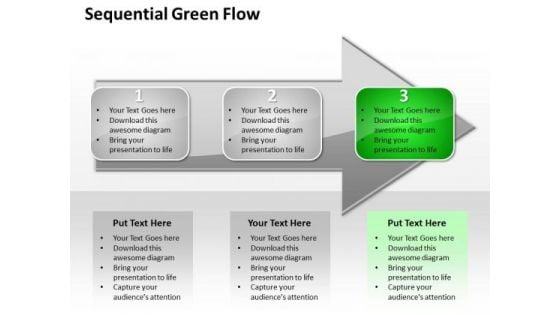
Ppt Sequential Representation Of 3 Issues An Arrow PowerPoint Templates
PPT sequential representation of 3 issues an arrow PowerPoint Templates-This PowerPoint Diagram shows you the Sequential representation of three concepts on the Arrow. It shows the successive concepts used in a procedure. You can change color, size and orientation of any icon to your liking.-PPT sequential representation of 3 issues an arrow PowerPoint Templates-Achieve, Achieving, Action, Advertising, Ambition, Approach, Arrow, Background, Better, Business, Career, Challenge, Commercial, Communication, Competition, Competitive, Competitor, Concept, Conceptual, Contract, Customer, Determined, Effective, Efficiency, Efficient, First, Goal, Isolated, Marketing, Movement, Objective, Opportunity, Order, Performance, Positive, Reaching, Red, Result, Succeed, Success, Symbol, Target, Trade, White, Win, Winner Motivate teams with our Ppt Sequential Representation Of 3 Issues An Arrow PowerPoint Templates. Download without worries with our money back guaranteee.
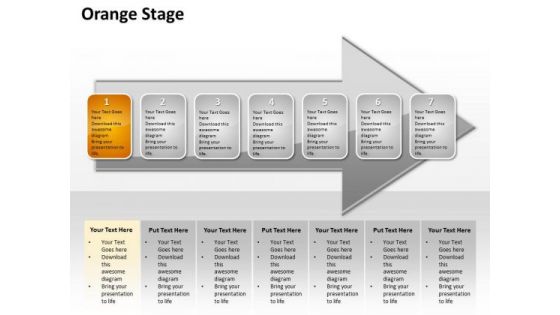
Ppt Constant Representation Of Yellow Stage Arrow PowerPoint Templates
PPT constant representation of yellow stage arrow PowerPoint Templates-This PowerPoint Diagram shows you the Successive Representation of seven approaches on the Arrow. It shows the successive concepts used in a procedure. You can change color, size and orientation of any icon to your liking.-PPT constant representation of yellow stage arrow PowerPoint Templates-Achieve, Achieving, Action, Advertising, Ambition, Approach, Arrow, Background, Better, Business, Career, Challenge, Commercial, Communication, Competition, Competitive, Competitor, Concept, Conceptual, Contract, Customer, Determined, Effective, Efficiency, Efficient, First, Goal, Isolated, Marketing, Movement, Objective, Opportunity, Order, Performance, Positive, Reaching, Red, Result, Succeed, Success, Symbol, Target, Trade, White, Win, Winner The audience will erupt in applause. Touch their hearts with our Ppt Constant Representation Of Yellow Stage Arrow PowerPoint Templates.
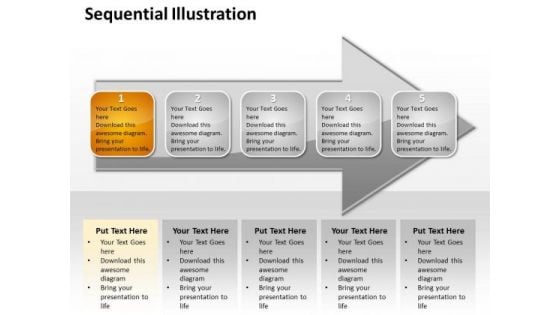
Ppt Continuous Illustration Of Orange Approach Arrow PowerPoint Templates
PPT continuous illustration of orange approach arrow PowerPoint Templates-This PowerPoint Diagram shows you the Continuous Illustration of seven approaches on the Arrow. It shows the successive concepts used in a procedure. You can change color, size and orientation of any icon to your liking.-PPT continuous illustration of orange approach arrow PowerPoint Templates-Achieve, Achieving, Action, Advertising, Ambition, Approach, Arrow, Background, Better, Business, Career, Challenge, Commercial, Communication, Competition, Competitive, Competitor, Concept, Conceptual, Contract, Customer, Determined, Effective, Efficiency, Efficient, First, Goal, Isolated, Marketing, Movement, Objective, Opportunity, Order, Performance, Positive, Reaching, Red, Result, Succeed, Success, Symbol, Target, Trade, White, Win, Winner Conquer fatigue with our Ppt Continuous Illustration Of Orange Approach Arrow PowerPoint Templates. They are like a deep breath.
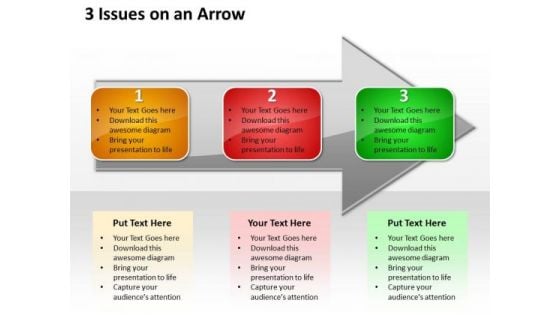
Ppt Horizontal Representation Of 3 Issues An Arrow PowerPoint Templates
PPT horizontal representation of 3 issues an arrow PowerPoint Templates-This PowerPoint Diagram shows you the Sequential representation of three concepts on the Arrow. It shows the successive concepts used in a procedure. You can change color, size and orientation of any icon to your liking.-PPT horizontal representation of 3 issues an arrow PowerPoint Templates-Achieve, Achieving, Action, Advertising, Ambition, Approach, Arrow, Background, Better, Business, Career, Challenge, Commercial, Communication, Competition, Competitive, Competitor, Concept, Conceptual, Contract, Customer, Determined, Effective, Efficiency, Efficient, First, Goal, Isolated, Marketing, Movement, Objective, Opportunity, Order, Performance, Positive, Reaching, Red, Result, Succeed, Success, Symbol, Target, Trade, White, Win, Winner Force an outcome with our Ppt Horizontal Representation Of 3 Issues An Arrow PowerPoint Templates. Try us out and see what a difference our templates make.
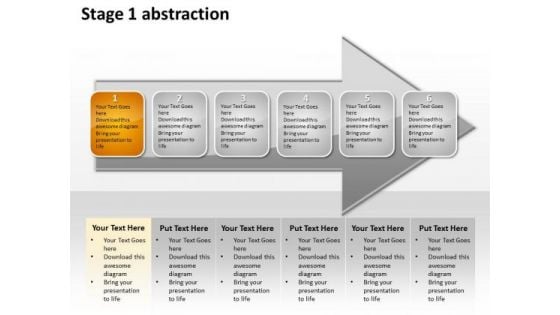
Ppt Linear Abstraction Of Orange Business Layouts Arrow PowerPoint Templates
PPT linear abstraction of orange business layouts arrow PowerPoint Templates-This PowerPoint Diagram shows you the Linear Illustration of six concepts on the Arrow. It shows the sequential concepts used in a procedure. You can change color, size and orientation of any icon to your liking.-PPT linear abstraction of orange business layouts arrow PowerPoint Templates-Achieve, Achieving, Action, Advertising, Ambition, Approach, Arrow, Background, Better, Business, Career, Challenge, Commercial, Communication, Competition, Competitive, Competitor, Concept, Conceptual, Contract, Customer, Determined, Effective, Efficiency, Efficient, First, Goal, Isolated, Marketing, Movement, Objective, Opportunity, Order, Performance, Positive, Reaching, Red, Result, Succeed, Success, Symbol, Target, Trade, White, Win, Winner Our Ppt Linear Abstraction Of Orange Business Layouts Arrow PowerPoint Templates are far from fictional. They are ardent admirers of actual facts.
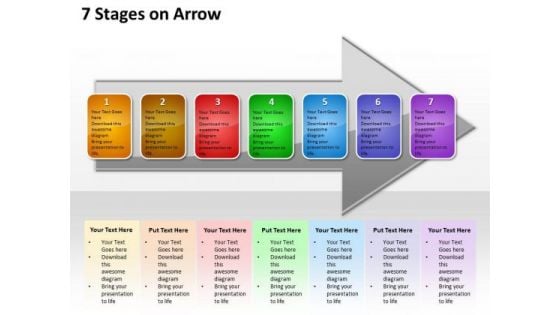
Ppt Successive Explanation Of 7 Stages Arrow PowerPoint Templates
PPT successive explanation of 7 stages arrow PowerPoint Templates-This PowerPoint Diagram shows you the Successive Explanation of seven concepts on the Arrow. It shows the successive concepts used in a procedure. You can change color, size and orientation of any icon to your liking.-PPT successive explanation of 7 stages arrow PowerPoint Templates-Achieve, Achieving, Action, Advertising, Ambition, Approach, Arrow, Background, Better, Business, Career, Challenge, Commercial, Communication, Competition, Competitive, Competitor, Concept, Conceptual, Contract, Customer, Determined, Effective, Efficiency, Efficient, First, Goal, Isolated, Marketing, Movement, Objective, Opportunity, Order, Performance, Positive, Reaching, Red, Result, Succeed, Success, Symbol, Target, Trade, White, Win, Winner Hit exceptional ratings with our Ppt Successive Explanation Of 7 Stages Arrow PowerPoint Templates. Astound the audience with your display.
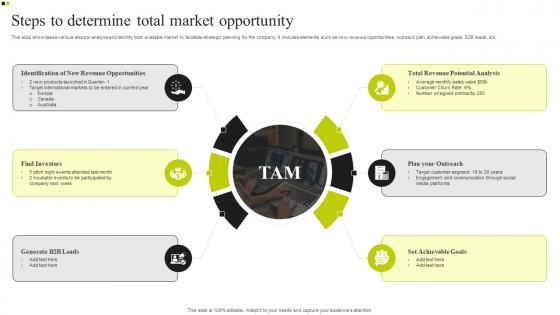
Steps To Determine Total Market Opportunity Guidelines Pdf
This slide showcases various steps to analyze and identify total available market to facilitate strategic planning for the company. It includes elements such as new revenue opportunities, outreach plan, achievable goals, B2B leads, etc. Pitch your topic with ease and precision using this Steps To Determine Total Market Opportunity Guidelines Pdf. This layout presents information on Icon Showcasing, Total Addressable Market Share. It is also available for immediate download and adjustment. So, changes can be made in the color, design, graphics or any other component to create a unique layout. This slide showcases various steps to analyze and identify total available market to facilitate strategic planning for the company. It includes elements such as new revenue opportunities, outreach plan, achievable goals, B2B leads, etc.
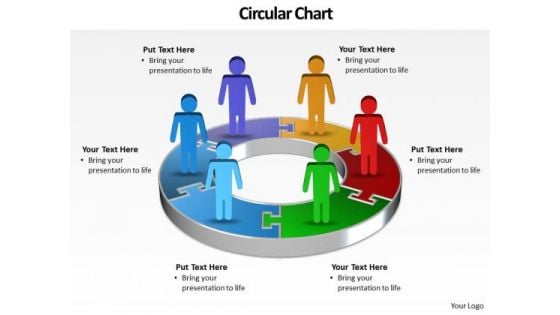
Ppt Illustration Of 3d Pie Org Chart PowerPoint 2010 With Standing Busines Men Templates
PPT illustration of 3d pie org chart powerpoint 2010 with standing busines men Templates-This 3D Business PowerPoint Diagram consists of group of people standing on Circle representing the percentage of Business perspective of individual field. You can change color, size and orientation of any icon to your liking.-PPT illustration of 3d pie org chart powerpoint 2010 with standing busines men Templates-Achievement, Actualization, Basic, Belonging, Blue, Chart, Confidence, Diagram, Elements, Essential, Fundamental, Glossy, Goals, Gradient, Health, Hierarchical, Hierarchy, Human, Illustration, Isolated, Layer, Level, Love, Morality, Motivation, Needs, Person, Psychological, Psychology, Pyramid Curb assumptions with our Ppt Illustration Of 3d Pie Org Chart PowerPoint 2010 With Standing Busines Men Templates. Face up to them with the facts.
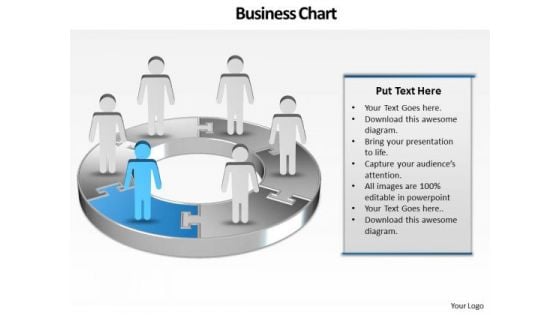
Ppt Demonstration Of 3d Pie Chart With Standing Busines Men PowerPoint Templates
PPT demonstration of 3d pie chart with standing busines men PowerPoint Templates-In case you need to graphically display circular processes you could use these 3D Arrows sequential steps PPT Slide. It will be helpful for presentations on stages of business processes, business plan from start to the achievement, etc. An excellent graphic to attract the attention of your audience to improve earnings. You can change color, size and orientation of any icon to your liking.-PPT demonstration of 3d pie chart with standing busines men PowerPoint Templates-Adult, Art, Background, Business, Career, Chart, Communication, Concept, Conference, Corporate, Creative, Design, Economy, Executive, Finance, Group, Growth, Idea, Illustration, Leadership, Meeting, New, Occupation, Office, People, Person, Progress, Silhouette, Space, Speaking, Standing, Success Our Ppt Demonstration Of 3d Pie Chart With Standing Busines Men PowerPoint Templates are destined to meet your standards. They conform to your exacting demands.
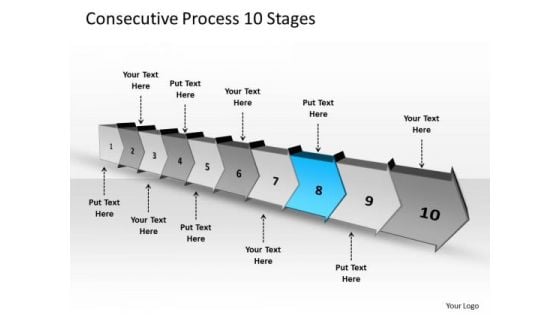
Consecutive Process 10 Stages Flowchart PowerPoint Freeware Slides
We present our consecutive process 10 stages flowchart PowerPoint freeware Slides. Use our Arrows PowerPoint Templates because, have always been a source of inspiration for us all. Use our Business PowerPoint Templates because, are the triggers of our growth. Use our Shapes PowerPoint Templates because, be the cynosure of all eyes with our template depicting. Use our Finance PowerPoint Templates because, to achieve sure shot success they need to come together at the right time, place and manner. Use our Process and Flows PowerPoint Templates because, Business Template: - There is a vision, a need you can meet. Use these PowerPoint slides for presentations relating to abstract arrow blank business chart circular circulation concept conceptual consecutive design diagram executive flow icon idea illustration management model numbers organization procedure process. The prominent colors used in the PowerPoint template are Blue, Gray, and Black Manage expectations with our Consecutive Process 10 Stages Flowchart PowerPoint Freeware Slides. You will be at the top of your game.
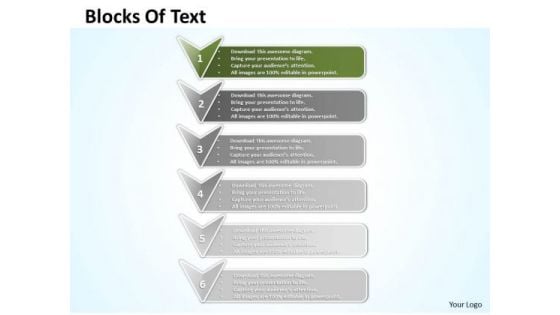
Ppt Vertical Blocks PowerPoint Template Using Shapes Arrows Templates
PPT vertical blocks powerpoint template using shapes arrows Templates-In case you need to graphically display vertical processes you could use these 3D Arrows sequential steps PPT Slide. It will be helpful for presentations on stages of business processes, business plan from start to the achievement, etc. An excellent graphic to attract the attention of your audience to improve earnings. You can change color, size and orientation of any icon to your liking.-PPT vertical blocks powerpoint template using shapes arrows Templates-abstract, arrows, art, banner, block, blue, box, bright, business, color, concept, conceptual, connection, creative, cube, design, different, graphic, group, idea, message, puzzle, shape, solution, special, speech, square, strategy, symbol, template, text, vector Synthesize presentations with our Ppt Vertical Blocks PowerPoint Template Using Shapes Arrows Templates. Download without worries with our money back guaranteee.
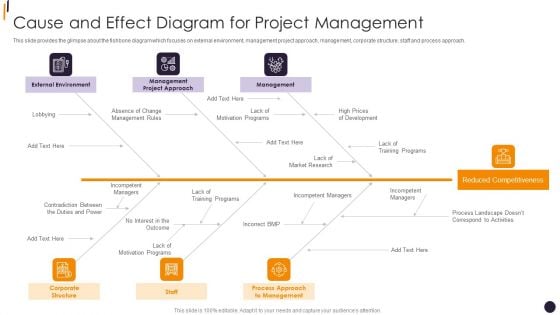
PMP Tools Cause And Effect Diagram For Project Management Introduction PDF
This slide provides the glimpse about the fishbone diagram which focuses on external environment, management project approach, management, corporate structure, staff and process approach.Introducing our well designed PMP Tools Cause And Effect Diagram For Project Management Introduction PDF set of slides. The slide displays editable icons to enhance your visual presentation. The icons can be edited easily. So customize according to your business to achieve a creative edge. Download and share it with your audience.
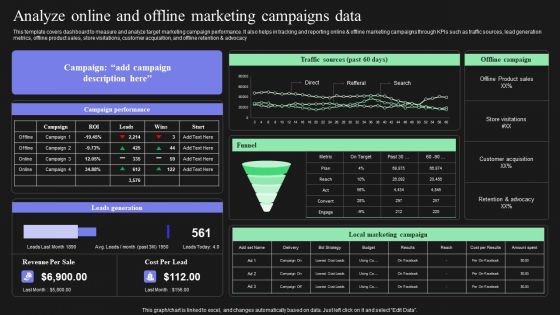
Effective Target Marketing Strategies To Acquire Customers Analyze Online And Offline Marketing Campaigns Guidelines PDF
This template covers dashboard to measure and analyze target marketing campaign performance. It also helps in tracking and reporting online and offline marketing campaigns through KPIs such as traffic sources, lead generation metrics, offline product sales, store visitations, customer acquisition, and offline retention and advocacy If you are looking for a format to display your unique thoughts, then the professionally designed Effective Target Marketing Strategies To Acquire Customers Analyze Online And Offline Marketing Campaigns Guidelines PDF is the one for you. You can use it as a Google Slides template or a PowerPoint template. Incorporate impressive visuals, symbols, images, and other charts. Modify or reorganize the text boxes as you desire. Experiment with shade schemes and font pairings. Alter, share or cooperate with other people on your work. Download Effective Target Marketing Strategies To Acquire Customers Analyze Online And Offline Marketing Campaigns Guidelines PDF and find out how to give a successful presentation. Present a perfect display to your team and make your presentation unforgettable.
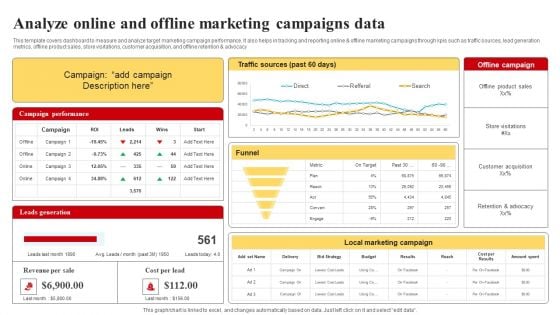
Selecting And Developing An Effective Target Market Strategy Analyze Online And Offline Marketing Campaigns Data Template PDF
This template covers dashboard to measure and analyze target marketing campaign performance. It also helps in tracking and reporting online and offline marketing campaigns through kpis such as traffic sources, lead generation metrics, offline product sales, store visitations, customer acquisition, and offline retention and advocacy If you are looking for a format to display your unique thoughts, then the professionally designed Selecting And Developing An Effective Target Market Strategy Analyze Online And Offline Marketing Campaigns Data Template PDF is the one for you. You can use it as a Google Slides template or a PowerPoint template. Incorporate impressive visuals, symbols, images, and other charts. Modify or reorganize the text boxes as you desire. Experiment with shade schemes and font pairings. Alter, share or cooperate with other people on your work. Download Selecting And Developing An Effective Target Market Strategy Analyze Online And Offline Marketing Campaigns Data Template PDF and find out how to give a successful presentation. Present a perfect display to your team and make your presentation unforgettable.
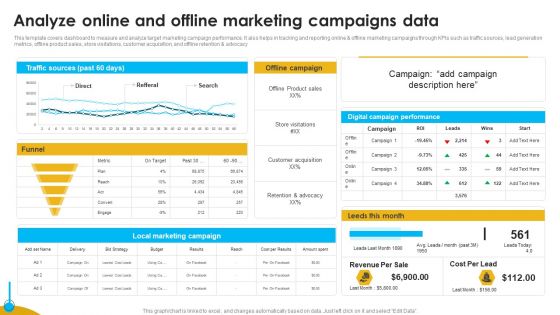
Approaches To Targeting New Customers In Various Markets Analyze Online And Offline Topics PDF
This template covers dashboard to measure and analyze target marketing campaign performance. It also helps in tracking and reporting online and offline marketing campaigns through KPIs such as traffic sources, lead generation metrics, offline product sales, store visitations, customer acquisition, and offline retention and advocacy. Presenting this PowerPoint presentation, titled Approaches To Targeting New Customers In Various Markets Analyze Online And Offline Topics PDF, with topics curated by our researchers after extensive research. This editable presentation is available for immediate download and provides attractive features when used. Download now and captivate your audience. Presenting this Approaches To Targeting New Customers In Various Markets Analyze Online And Offline Topics PDF. Our researchers have carefully researched and created these slides with all aspects taken into consideration. This is a completely customizable Approaches To Targeting New Customers In Various Markets Analyze Online And Offline Topics PDF that is available for immediate downloading. Download now and make an impact on your audience. Highlight the attractive features available with our PPTs.
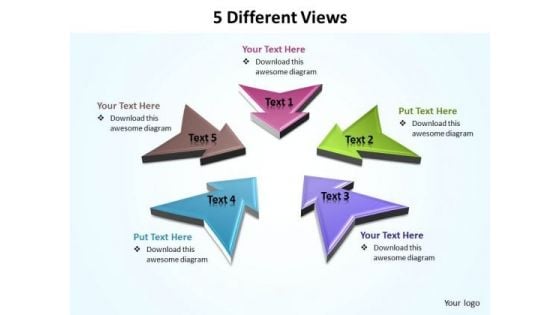
Ppt 5 Colorful PowerPoint Background Concepts Arrow Pointing Inwards Templates
PPT 5 colorful powerpoint background concepts arrow Pointing inwards Templates-Deliver amazing Presentations with our above Diagram Representing five Colorful steps arranged in downward manner. You can portray specific models like Analyze, Plan, Implement and Review model, Waterfall model or any other customized processes.-PPT 5 colorful powerpoint background concepts arrow Pointing inwards Templates-Different, Abstract, Background, Communication, Concept, Conceptual, Design, Diagram, Direction, Elements, Exchange, Flow, Flowchart, Graph, Graphic, Icon, Pointing, Process, Sign, Symbol, Icons Our Ppt 5 Colorful PowerPoint Background Concepts Arrow Pointing Inwards Templates combine to create an exciting ensemble. Each one has a distinct character.
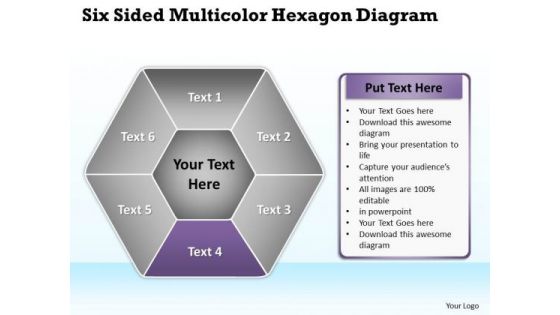
Business Process Diagram Chart Six Sided Multicolor Hexagon PowerPoint Slides
We present our business process diagram chart six sided multicolor hexagon PowerPoint Slides.Use our Circle Charts PowerPoint Templates because You have gained great respect for your brilliant ideas. Use our PowerPoint Templates and Slides to strengthen and enhance your reputation. Use our Ring Charts PowerPoint Templates because You can Raise a toast with our PowerPoint Templates and Slides. Spread good cheer amongst your audience. Present our Flow Charts PowerPoint Templates because Our PowerPoint Templates and Slides team portray an attitude of elegance. Personify this quality by using them regularly. Present our Process and Flows PowerPoint Templates because It can Leverage your style with our PowerPoint Templates and Slides. Charm your audience with your ability. Download our Marketing PowerPoint Templates because Watching this your Audience will Grab their eyeballs, they wont even blink.Use these PowerPoint slides for presentations relating to Business, color, colorful, cycle, executive, icon, illustration, management, model, numbers, organization, procedure, red, resource, sequence, sequential, seven, strategy, symbol, process, process and flows, circle process, circle, process, steps. The prominent colors used in the PowerPoint template are Purple, Gray, White. People tell us our business process diagram chart six sided multicolor hexagon PowerPoint Slides will help you be quick off the draw. Just enter your specific text and see your points hit home. PowerPoint presentation experts tell us our executive PowerPoint templates and PPT Slides help you meet deadlines which are an element of today's workplace. Just browse and pick the slides that appeal to your intuitive senses. Presenters tell us our business process diagram chart six sided multicolor hexagon PowerPoint Slides are the best it can get when it comes to presenting. Use our icon PowerPoint templates and PPT Slides are visually appealing. Customers tell us our business process diagram chart six sided multicolor hexagon PowerPoint Slides are specially created by a professional team with vast experience. They diligently strive to come up with the right vehicle for your brilliant Ideas. People tell us our management PowerPoint templates and PPT Slides are specially created by a professional team with vast experience. They diligently strive to come up with the right vehicle for your brilliant Ideas. Review your plans with our Business Process Diagram Chart Six Sided Multicolor Hexagon PowerPoint Slides. Download without worries with our money back guaranteee.

Sales Team Accomplishment Evaluation Ppt PowerPoint Presentation Complete Deck With Slides
This complete deck acts as a great communication tool. It helps you in conveying your business message with personalized sets of graphics, icons etc. Comprising a set of thriteen slides, this complete deck can help you persuade your audience. It also induces strategic thinking as it has been thoroughly researched and put together by our experts. Not only is it easily downloadable but also editable. The color, graphics, theme any component can be altered to fit your individual needs. So grab it now.
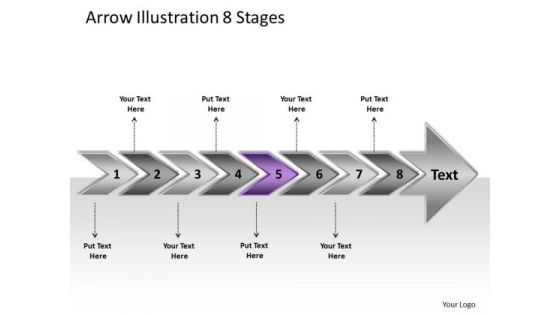
Arrow Illustration 8 Stages Process Flow Charts Examples PowerPoint Slides
We present our arrow illustration 8 stages process flow charts examples PowerPoint Slides. Use our Arrows PowerPoint Templates because, the plans are in your head, stage by stage, year by year. Use our Business PowerPoint Templates because, Marketing Strategy Business Template: - Maximizing sales of your product is the intended destination. Use our Shapes PowerPoint Templates because; explain the contribution of each of the elements and how they provide impetus to the next phase. Use our Finance PowerPoint Templates because, Bullet-point your thoughts and ideas to profitably accomplish every step of every stage along the way. Use our Process and Flows PowerPoint Templates because, Put them down and present them using our innovative templates. Use these PowerPoint slides for presentations relating to 3d arrow background bullet business chart checkmark chevron diagram drop eps10 financial five glass graphic gray icon illustration management point process project reflection set shadow stage text transparency vector white. The prominent colors used in the PowerPoint template are Purple, Gray, and Black Our Arrow Illustration 8 Stages Process Flow Charts Examples PowerPoint Slides are a complete customer delight. They deliver on every account.
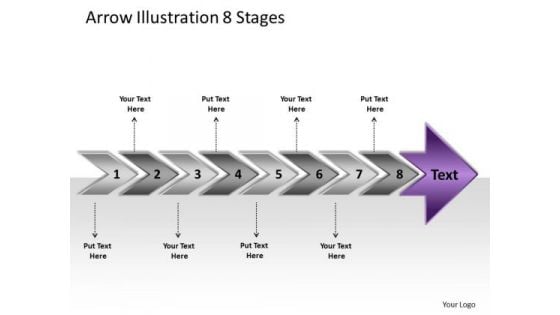
Arrow Illustration 8 Stages Make Flowchart PowerPoint Slides
We present our arrow illustration 8 stages make flowchart PowerPoint Slides. Use our Arrows PowerPoint Templates because, we provide the means to project your views. Use our Business PowerPoint Templates because, Marketing Strategy Business Template: - Maximizing sales of your product is the intended destination. Use our Shapes PowerPoint Templates because, they highlight the depth of your thought process. Use our Finance PowerPoint Templates because, Bullet-point your thoughts and ideas to profitably accomplish every step of every stage along the way. Use our Process and Flows PowerPoint Templates because, you understand the illness and its causes. Use these PowerPoint slides for presentations relating to 3d arrow background bullet business chart checkmark chevron diagram drop eps10 financial five glass graphic gray icon illustration management point process project reflection set shadow stage text transparency vector white. The prominent colors used in the PowerPoint template are Purple, Gray, and Black Arouse a committee with our Arrow Illustration 8 Stages Make Flowchart PowerPoint Slides. Just download, type and present.
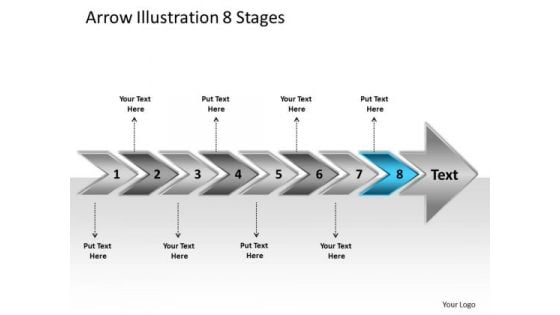
Arrow Illustration 8 Stages Online Flowchart PowerPoint Templates
We present our arrow illustration 8 stages online flowchart PowerPoint templates. Use our Arrows PowerPoint Templates because; Break it all down to Key Result Areas. Use our Business PowerPoint Templates because, you have what it takes to grow. Use our Shapes PowerPoint Templates because, Expound on how you plan to gain their confidence and assure them of continued and consistent excellence in quality of service. Use our Finance PowerPoint Templates because, Bullet-point your thoughts and ideas to profitably accomplish every step of every stage along the way. Use our Process and Flows PowerPoint Templates because, Activities which in themselves have many inherent business opportunities. Use these PowerPoint slides for presentations relating to 3d arrow background bullet business chart checkmark chevron diagram drop eps10 financial five glass graphic gray icon illustration management point process project reflection set shadow stage text transparency vector white. The prominent colors used in the PowerPoint template are Blue, Gray, and Black There are no mixed feelings about our Arrow Illustration 8 Stages Online Flowchart PowerPoint Templates. They are a definite asset for all.

Enhancing Workload Efficiency Through Cloud Architecture Review Complete Deck
Create a proper and aligned organizational framework that meets your business expectations. Deploy this ready to use Enhancing Workload Efficiency Through Cloud Architecture Review Complete Deck and use it to design a structure for your company that showcases the quality of your management,and more. Use this sixty eight Slide complete deck to showcase essential components of your organizational framework. Present this PPT Design to your stakeholders to draw an organizational framework that supports your vision and goals. Find relevant icons as well on a download,as this this presentation is completely editable and 100 percent customizable. Get it now. Our Enhancing Workload Efficiency Through Cloud Architecture Review Complete Deck are topically designed to provide an attractive backdrop to any subject. Use them to look like a presentation pro.
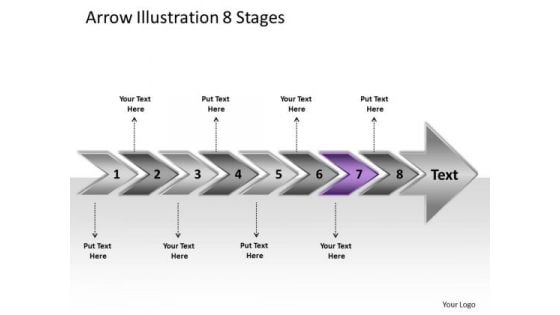
Arrow Illustration 8 Stages Ppt Flow Charting PowerPoint Slides
We present our arrow illustration 8 stages ppt flow charting PowerPoint Slides. Use our Arrows PowerPoint Templates because, to achieve sure shot success they need to come together at the right time, place and manner. Use our Business PowerPoint Templates because, Marketing Strategy Business Template: - Maximizing sales of your product is the intended destination. Use our Shapes PowerPoint Templates because; educate your team and the attention you have paid. Use our Finance PowerPoint Templates because, you understand the illness and its causes. Use our Process and Flows PowerPoint Templates because, Our PowerPoint templates give this step by step process to achieved the aim. Use these PowerPoint slides for presentations relating to 3d arrow background bullet business chart checkmark chevron diagram drop eps10 financial five glass graphic gray icon illustration management point process project reflection set shadow stage text transparency vector white. The prominent colors used in the PowerPoint template are Purple, Gray, and Black Tackle the issue in it's entirety. Put up the overall picture with our Arrow Illustration 8 Stages Ppt Flow Charting PowerPoint Slides.
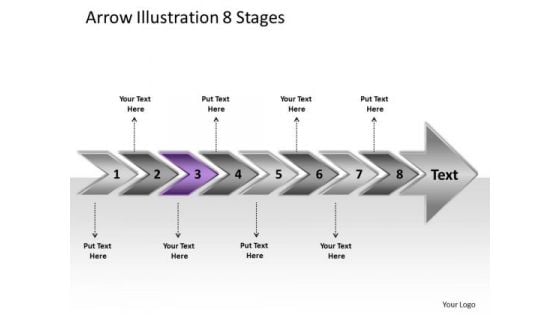
Arrow Illustration 8 Stages Open Source Flowchart PowerPoint Slides
We present our arrow illustration 8 stages open source flowchart PowerPoint Slides. Use our Arrows PowerPoint Templates because, coincidentally it always points to the top. Use our Business PowerPoint Templates because; now funnel your marketing strategies down the cone, stage by stage, refining as you go along. Use our Shapes PowerPoint Templates because, Amplify on your plans to have dedicated sub groups working on related but distinct tasks. Use our Finance PowerPoint Templates because, There are different paths to gain the necessary knowledge to achieved it. Use our Process and Flows PowerPoint Templates because; Take your team along by explaining your plans. Use these PowerPoint slides for presentations relating to 3d arrow background bullet business chart checkmark chevron diagram drop eps10 financial five glass graphic gray icon illustration management point process project reflection set shadow stage text transparency vector white. The prominent colors used in the PowerPoint template are Purple, Gray, and Black Get on a accelerated career track with our Arrow Illustration 8 Stages Open Source Flowchart PowerPoint Slides. They will make you look good.

Achieving Business Authority In Sustainable And Reliable Power Sector Case Competition Ppt PowerPoint Presentation Complete Deck With Slides
This complete deck acts as a great communication tool. It helps you in conveying your business message with personalized sets of graphics, icons etc. Comprising a set of fourtysix slides, this complete deck can help you persuade your audience. It also induces strategic thinking as it has been thoroughly researched and put together by our experts. Not only is it easily downloadable but also editable. The color, graphics, theme any component can be altered to fit your individual needs. So grab it now.
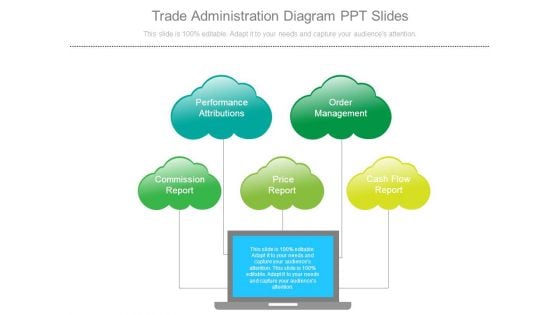
Trade Administration Diagram Ppt Slides
This is a trade administration diagram ppt slides. This is a five stage process. The stages in this process are performance attributions, commission report, price report, order management, cash flow report.
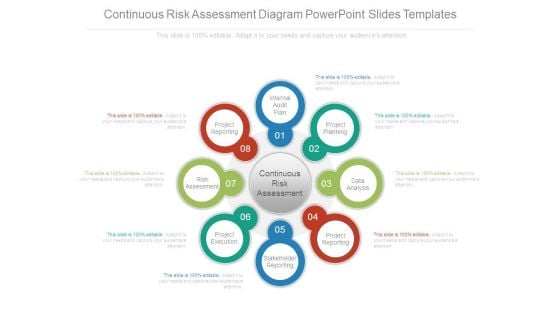
Continuous Risk Assessment Diagram Powerpoint Slides Templates
This is a continuous risk assessment diagram powerpoint slides templates. This is a eight stage process. The stages in this process are internal audit plan, project planning, data analysis, project reporting, stakeholder reporting, project execution, risk assessment, project reporting.
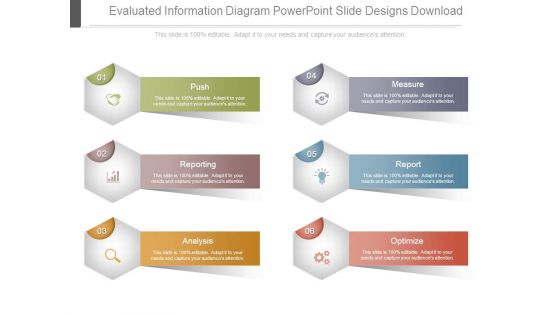
Evaluated Information Diagram Powerpoint Slide Designs Download
This is a evaluated information diagram powerpoint slide designs download. This is a six stage process. The stages in this process are push, measure, reporting, report, analysis, optimize.
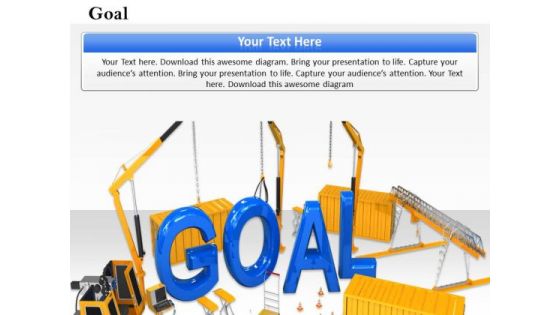
Stock Photo Goal Word On Construction Site PowerPoint Slide
This image slide displays construction site and goal word. This image slide depicts strategy for goal achievement. You can change size, color and orientation of icons to your liking. Use this image slide, in your presentations to express views on leadership, teamwork, management and constructions. This image slide may also be used in presentations to exhibit different business strategies. This image slide will enhance the quality of your presentations.

Approaches To Modify Humanitarian Aid And Achieve Entity Goals Ppt PowerPoint Presentation Complete Deck With Slides
This complete deck acts as a great communication tool. It helps you in conveying your business message with personalized sets of graphics, icons etc. Comprising a set of fourty six slides, this complete deck can help you persuade your audience. It also induces strategic thinking as it has been thoroughly researched and put together by our experts. Not only is it easily downloadable but also editable. The color, graphics, theme any component can be altered to fit your individual needs. So grab it now.

Writing A List Of Specific Project Objective For Project Review Ppt PowerPoint Presentation Complete Deck With Slides
This complete deck acts as a great communication tool. It helps you in conveying your business message with personalized sets of graphics, icons etc. Comprising a set of fourty nine slides, this complete deck can help you persuade your audience. It also induces strategic thinking as it has been thoroughly researched and put together by our experts. Not only is it easily downloadable but also editable. The color, graphics, theme any component can be altered to fit your individual needs. So grab it now.
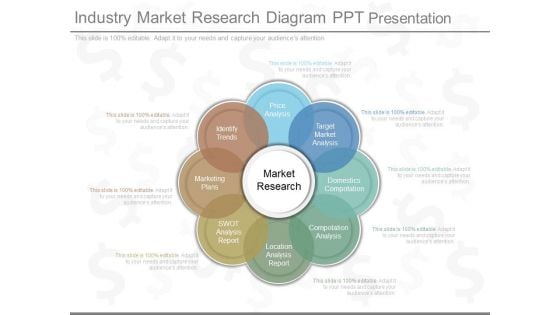
Industry Market Research Diagram Ppt Presentation
This is a industry market research diagram ppt presentation. This is a eight stage process. The stages in this process are market research, price analysis, identify trends, marketing plans, swot analysis report, location analysis report, compotation analysis, target market analysis.\n\n\n\n\n\n\n\n
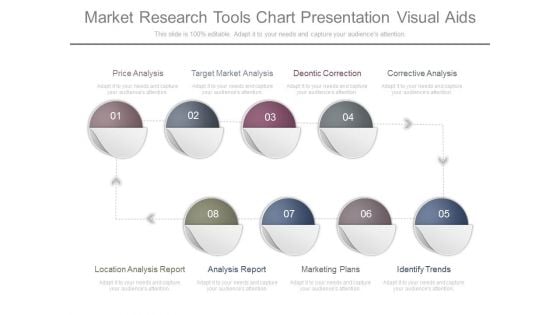
Market Research Tools Chart Presentation Visual Aids
This is a market research tools chart presentation visual aids. This is a eight stage process. The stages in this process are price analysis, target market analysis, deontic correction, corrective analysis, location analysis report, analysis report, marketing plans, identify trends.
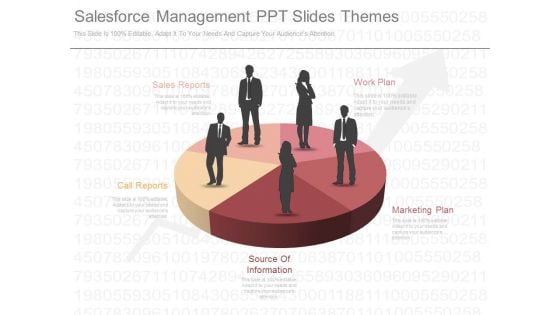
Salesforce Management Ppt Slides Themes
This is a salesforce management ppt slides themes. This is a five stage process. The stages in this process are sales reports, work plan, marketing plan, source of information, call reports.
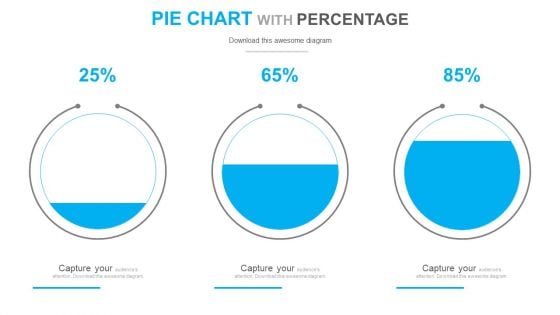
Circle Chart With Increasing Percentage Values PowerPoint Slides
Circle Chart with Increasing Percentage Values power point Slides: - Show your achievements and targets with the ideal background. Above is the diagram to display how your business has been growing or your achievements. The slide is of the three circles having water at different levels in them. Therefore it becomes easy to show that in the first circle, the growth is at this much percent, then the second one and in the last circle, completed 85% of the targets. This PowerPoint template is easy to use to show the progress, and comparisons. All icons are editable. Choose them as per your need.
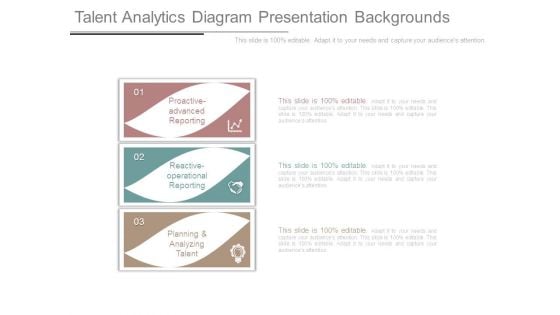
Talent Analytics Diagram Presentation Backgrounds
This is a talent analytics diagram presentation backgrounds. This is a three stage process. The stages in this process are proactive advanced reporting, reactive operational reporting, planning and analyzing talent.
Hr Advisory Services Brochure With Service Pricing Plans
This slide illustrates human resource advisory brochure with service charges plan. It provides information about templates, modules, profile audit, review meetings, coaching, stakeholder engagement, etc. Persuade your audience using this hr advisory services brochure with service pricing plans icons pdf. This PPT design covers three stages, thus making it a great tool to use. It also caters to a variety of topics including hr advisory services brochure with service pricing plans. Download this PPT design now to present a convincing pitch that not only emphasizes the topic but also showcases your presentation skills.
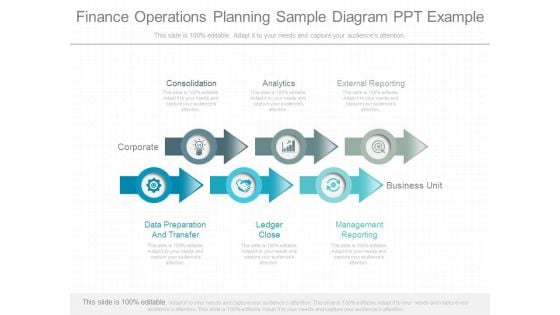
Finance Operations Planning Sample Diagram Ppt Example
This is a finance operations planning sample diagram ppt example. This is a six stage process. The stages in this process are consolidation, analytics, corporate, external reporting, business unit, data preparation and transfer, ledger close, management reporting.\n\n\n\n\n\n\n\n\n \n
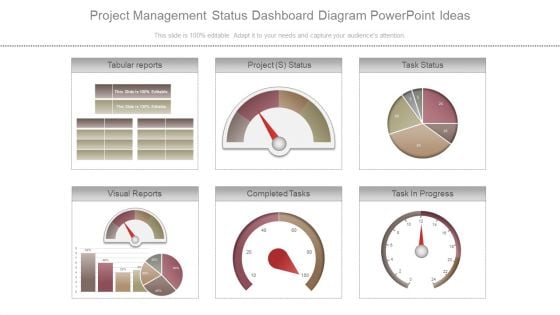
Project Management Status Dashboard Diagram Powerpoint Ideas
This is a project management status dashboard diagram powerpoint ideas. This is a six stage process. The stages in this process are tabular reports, project s status, task status, visual reports, completed tasks, task in progress.
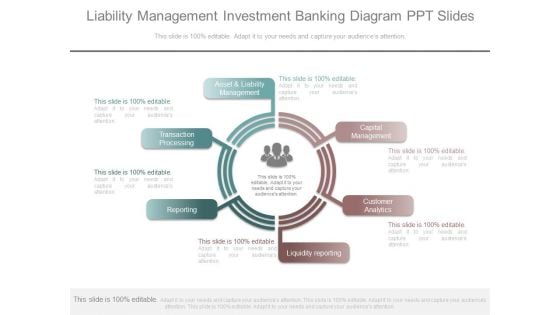
Liability Management Investment Banking Diagram Ppt Slides
This is a liability management investment banking diagram ppt slides. This is a six stage process. The stages in this process are capital management, customer analytics, liquidity reporting, reporting, transaction processing, asset and liability management.
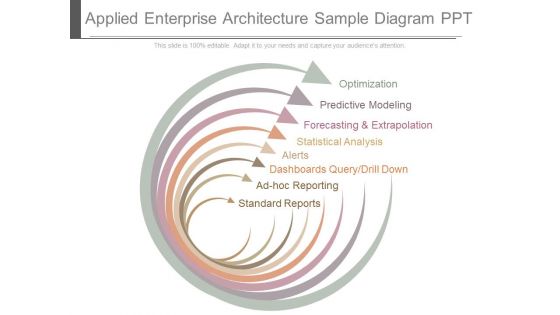
Applied Enterprise Architecture Sample Diagram Ppt
This is a applied enterprise architecture sample diagram ppt. This is a eight stage process. The stages in this process are optimization, predictive modeling, forecasting and extrapolation, statistical analysis, alerts, dashboards query/drill down, ad-hoc reporting, standard reports.
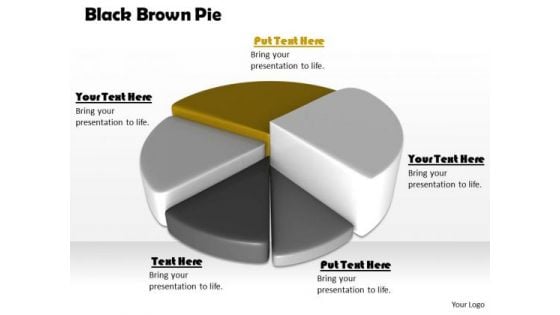
Stock Photo Black Brown Pie Chart For Business Result PowerPoint Slide
This high quality image is designed with pie chart. Use this image to make business reports. Use this outstanding image in presentations relating to data analysis and reports. Go ahead and add charm to your presentations.
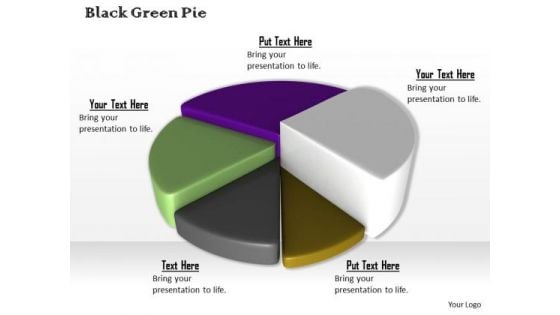
Stock Photo Colorful 3d Pie Chart For Business Result PowerPoint Slide
This high quality image is designed with pie chart. Use this image to make business reports. Use this outstanding image in presentations relating to data analysis and reports. Go ahead and add charm to your presentations.
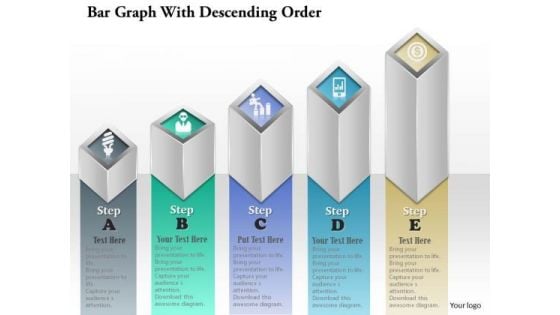
Business Diagram Bar Graph With Ascending Order Presentation Template
Our above diagram displays bar graph in ascending order. It contains bar graph with business icons. Use this amazing diagram for business communication or to present business reports. Download this diagram as a tool for business presentations.
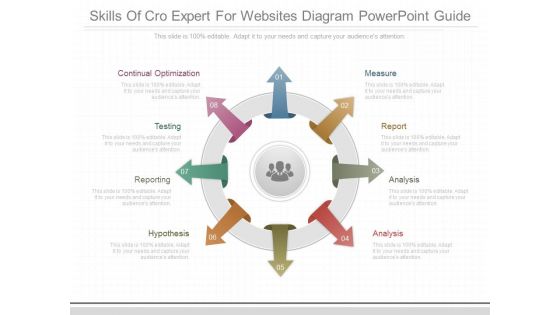
Skills Of Cro Expert For Websites Diagram Powerpoint Guide
This is a skills of cro expert for websites diagram powerpoint guide. This is a eight stage process. The stages in this process are continual optimization, testing, reporting, hypothesis, measure, report, analysis.
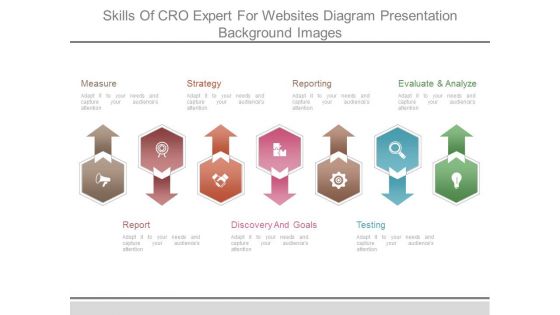
Skills Of Cro Expert For Websites Diagram Presentation Background Images
This is a skills of cro expert for websites diagram presentation background images. This is a seven stage process. The stages in this process are measure, strategy, reporting, evaluate and analyze, report, discovery and goals, testing.
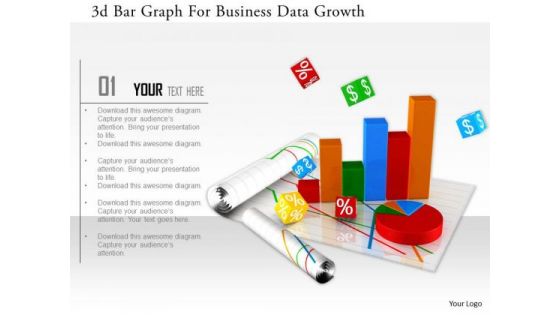
Stock Photo 3d Bar Graph For Business Data Growth Image Graphics For PowerPoint Slide
This image slide has graphics of financial charts and reports. This contains bar graph and pie chart to present business reports. Build an innovative presentations using this professional image slide.
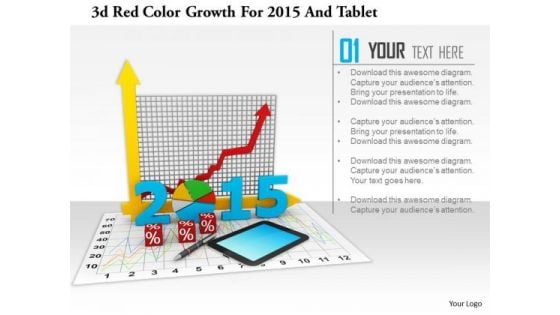
Stock Photo 3d Red Color Growth For 2015 And Tablet PowerPoint Slide
This image slide has graphics of financial charts and reports. This contains bar graph and pie chart to present business reports. Build an innovative presentation using this professional image slide.

Marketing Research Internet Diagram Powerpoint Guide
This is a marketing research internet diagram powerpoint guide. This is a nine stage process. The stages in this process are price analysis, domestic international competitors, target market analysis, competitive analysis, location analysis report, swot analysis report, marketing plans, market research analysis reports, identify trends, market research.
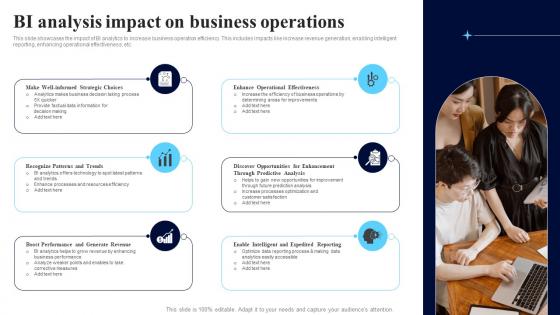
BI Analysis Impact On Business Operations Themes Pdf
This slide showcases the impact of BI analytics to increase business operation efficiency. This includes impacts like increase revenue generation, enabling intelligent reporting, enhancing operational effectiveness, etc. Showcasing this set of slides titled BI Analysis Impact On Business Operations Themes Pdf. The topics addressed in these templates are Recognize Patterns, Enhance Operational Effectiveness, Expedited Reporting. All the content presented in this PPT design is completely editable. Download it and make adjustments in color, background, font etc. as per your unique business setting. This slide showcases the impact of BI analytics to increase business operation efficiency. This includes impacts like increase revenue generation, enabling intelligent reporting, enhancing operational effectiveness, etc.

Financial Analyst Growth Chart Presentation Diagrams
This is a financial analyst growth chart presentation diagrams. This is a three stage process. The stages in this process are reporting, growth, analysis.
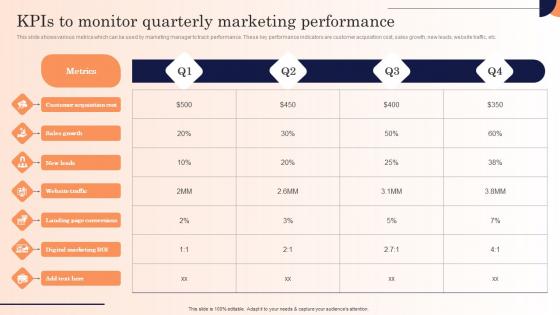
Kpis To Monitor Quarterly Marketing Performance Strategic Marketing Campaign Themes Pdf
This slide shows various metrics which can be used by marketing manager to track performance. These key performance indicators are customer acquisition cost, sales growth, new leads, website traffic, etc.Explore a selection of the finest Kpis To Monitor Quarterly Marketing Performance Strategic Marketing Campaign Themes Pdf here. With a plethora of professionally designed and pre-made slide templates, you can quickly and easily find the right one for your upcoming presentation. You can use our Kpis To Monitor Quarterly Marketing Performance Strategic Marketing Campaign Themes Pdf to effectively convey your message to a wider audience. Slidegeeks has done a lot of research before preparing these presentation templates. The content can be personalized and the slides are highly editable. Grab templates today from Slidegeeks. This slide shows various metrics which can be used by marketing manager to track performance. These key performance indicators are customer acquisition cost, sales growth, new leads, website traffic, etc.
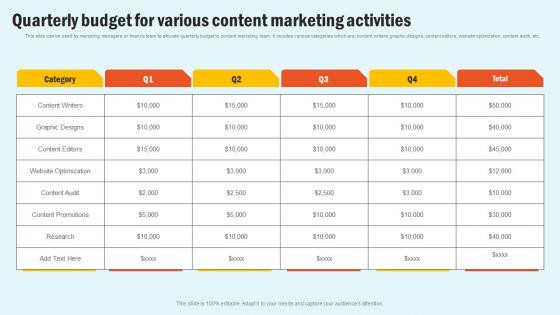
Quarterly Budget For Various Enhancing Website Performance With Search Engine Content Download Pdf
This slide can be used by marketing managers or finance team to allocate quarterly budget to content marketing team. It incudes various categories which are, content writers ,graphic designs, content editors, website optimization, content audit, etc. Retrieve professionally designed Quarterly Budget For Various Enhancing Website Performance With Search Engine Content Download Pdf to effectively convey your message and captivate your listeners. Save time by selecting pre made slideshows that are appropriate for various topics, from business to educational purposes. These themes come in many different styles, from creative to corporate, and all of them are easily adjustable and can be edited quickly. Access them as PowerPoint templates or as Google Slides themes. You do not have to go on a hunt for the perfect presentation because Slidegeeks got you covered from everywhere. This slide can be used by marketing managers or finance team to allocate quarterly budget to content marketing team. It incudes various categories which are, content writers ,graphic designs, content editors, website optimization, content audit, etc.
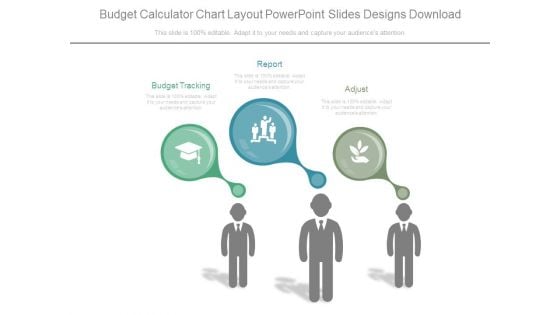
Budget Calculator Chart Layout Powerpoint Slides Designs Download
This is a budget calculator chart layout powerpoint slides designs download. This is a three stage process. The stages in this process are budget tracking, report, adjust.
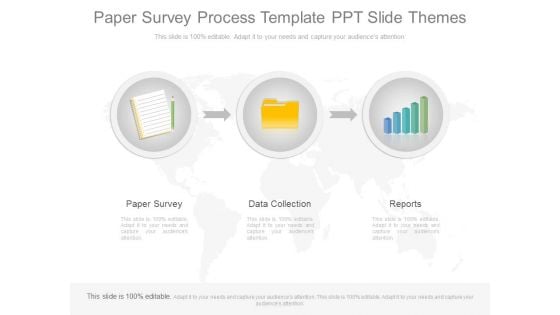
Paper Survey Process Template Ppt Slide Themes
This is a paper survey process template ppt slide themes. This is a three stage process. The stages in this process are paper survey, data collection, reports.
Web Analytics Example Powerpoint Slides Themes
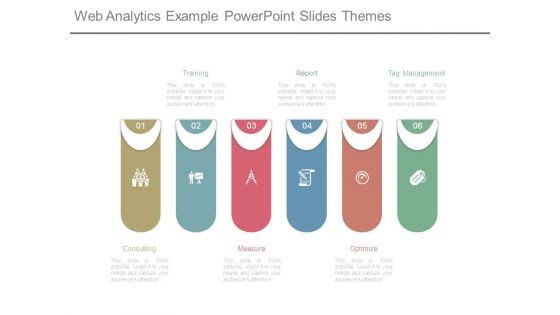
This is a web analytics example powerpoint slides themes. This is a six stage process. The stages in this process are consulting, training, measure, report, optimize, tag management.
Dashboard Analytics Diagram Powerpoint Guide
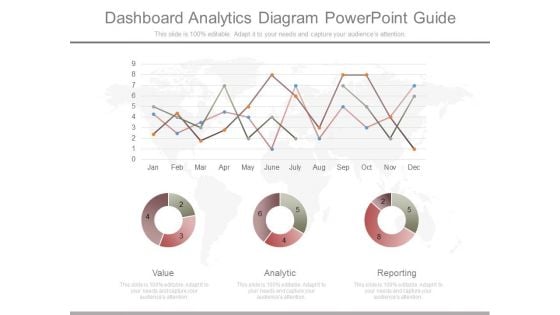
This is a dashboard analytics diagram powerpoint guide. This is a three stage process. The stages in this process are value, analytic, reporting.
Dashboard Analytics Diagram Presentation Powerpoint
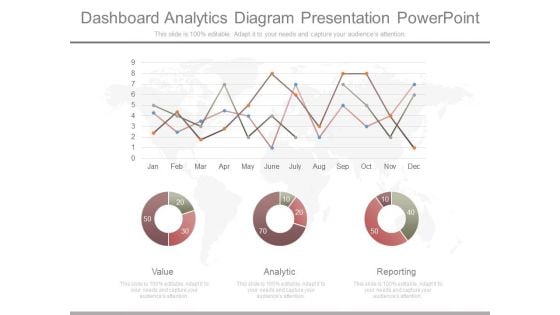
This is a dashboard analytics diagram presentation powerpoint. This is a three stage process. The stages in this process are value, analytic, reporting.
Multichannel Retailing Diagram Powerpoint Show
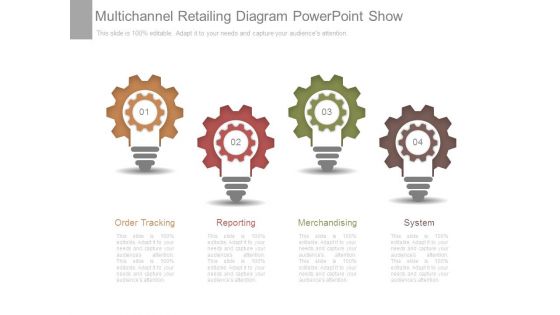
This is a multichannel retailing diagram powerpoint show. This is a four stage process. The stages in this process are order tracking, reporting, merchandising, system.
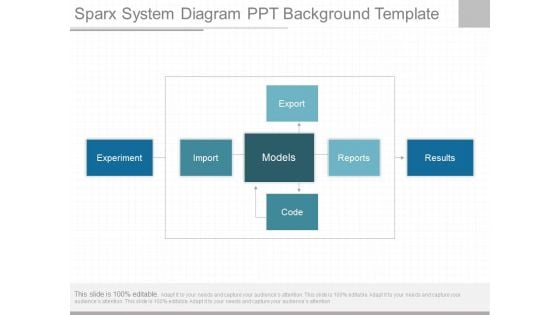
Sparx System Diagram Ppt Background Template
This is a sparx system diagram ppt background template. This is a one stage process. The stages in this process are experiment, import, export, models, code, reports, results.
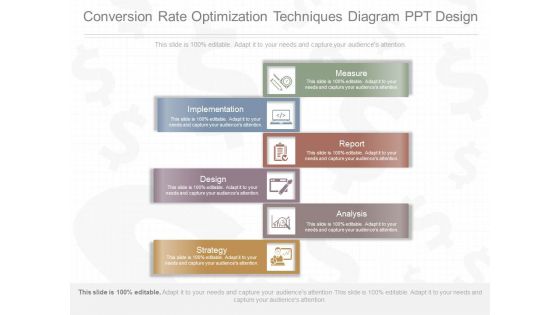
Conversion Rate Optimization Techniques Diagram Ppt Design
This is a conversion rate optimization techniques diagram ppt design. This is a six stage process. The stages in this process are measure, implementation, report, design, analysis, strategy.
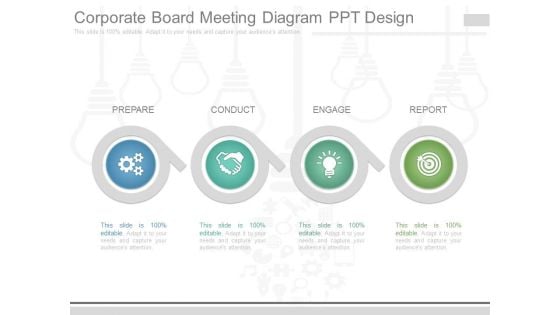
Corporate Board Meeting Diagram Ppt Design
This is a corporate board meeting diagram ppt design. This is a four stage process. The stages in this process are prepare, conduct, engage, report.
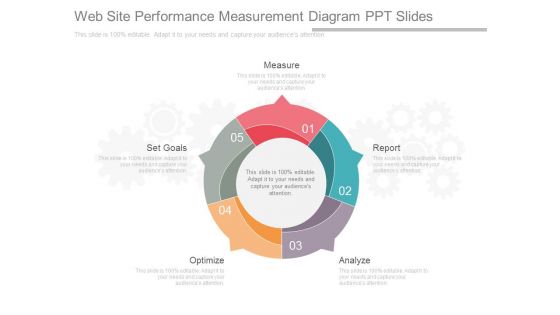
Web Site Performance Measurement Diagram Ppt Slides
This is a web site performance measurement diagram ppt slides. This is a five stage process. The stages in this process are measure, report, analyze, optimize, set goals.
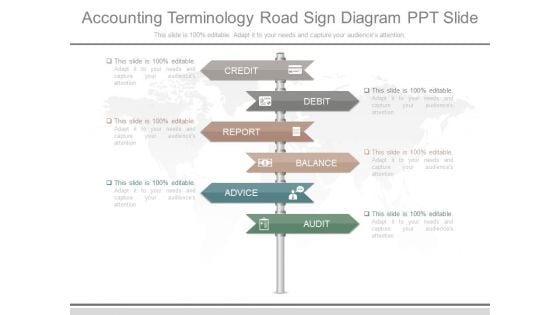
Accounting Terminology Road Sign Diagram Ppt Slide
This is a accounting terminology road sign diagram ppt slide. This is a six stage process. The stages in this process are credit, debit, report, balance, advice, audit.
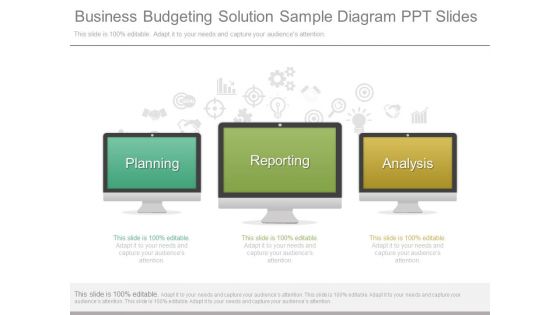
Business Budgeting Solution Sample Diagram Ppt Slides
This is a business budgeting solution sample diagram ppt slides. This is a three stage process. The stages in this process are planning, reporting, analysis.
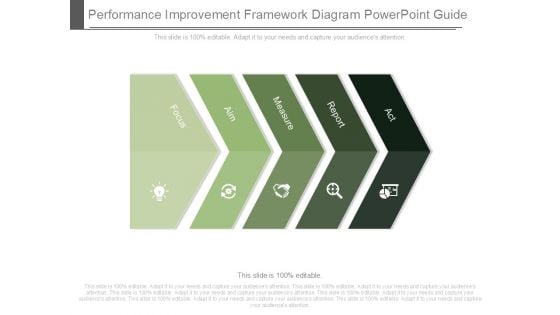
Performance Improvement Framework Diagram Powerpoint Guide
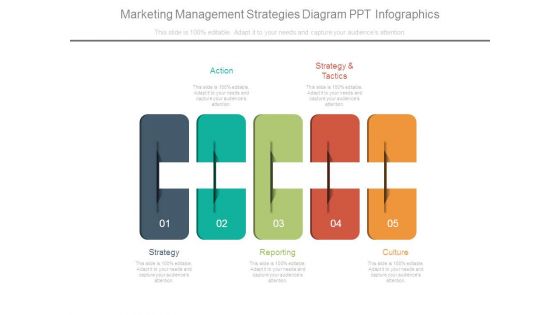
Marketing Management Strategies Diagram Ppt Infographics
This is a marketing management strategies diagram ppt infographics. This is a five stage process. The stages in this process are action, strategy and tactics, strategy, reporting, culture.
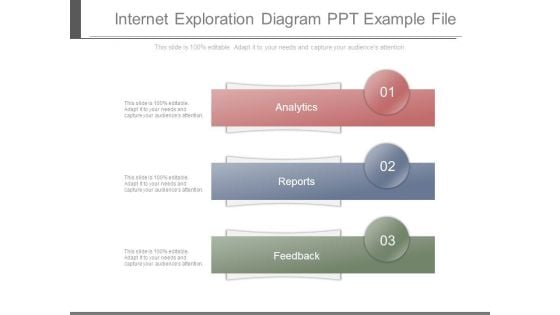
Internet Exploration Diagram Ppt Example File
This is a internet exploration diagram ppt example file. This is a three stage process. The stages in this process are analytics, reports, feedback.
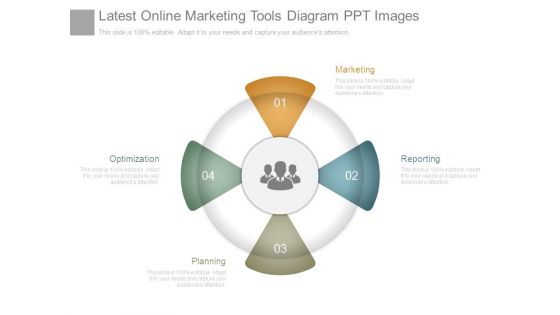
Latest Online Marketing Tools Diagram Ppt Images
This is a latest online marketing tools diagram ppt images. This is a four stage process. The stages in this process are optimization, planning, marketing, reporting.
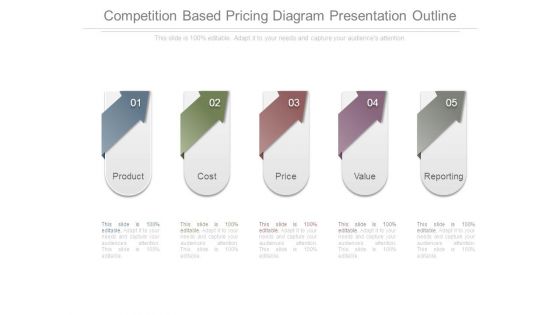
Competition Based Pricing Diagram Presentation Outline
This is a competition based pricing diagram presentation outline. This is a five stage process. The stages in this process are product, cost, price, value, reporting.
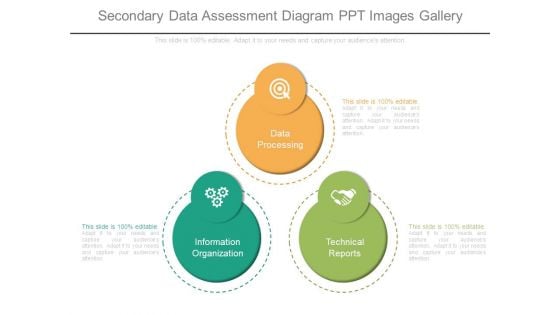
Secondary Data Assessment Diagram Ppt Images Gallery
This is a secondary data assessment diagram ppt images gallery. This is a three stage process. The stages in this process are data processing, information organization, technical reports.

Stock Requirement Plan With Inventory Summary Ppt PowerPoint Presentation Gallery Designs Download PDF
The following slide highlights the material requirement planning with inventory summary. It illustrates sales report, delivery report, inventory summary, purchase order and suppliers. Showcasing this set of slides titled Stock Requirement Plan With Inventory Summary Ppt PowerPoint Presentation Gallery Designs Download PDF. The topics addressed in these templates are Suppliers, Sales Report, Inventory Summary, Purchase Order. All the content presented in this PPT design is completely editable. Download it and make adjustments in color, background, font etc. as per your unique business setting.
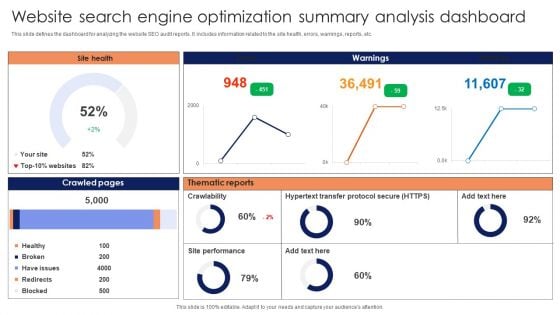
Website Search Engine Optimization Summary Analysis Dashboard Infographics PDF
This slide defines the dashboard for analyzing the website SEO audit reports. It includes information related to the site health, errors, warnings, reports, etc. Showcasing this set of slides titled Website Search Engine Optimization Summary Analysis Dashboard Infographics PDF. The topics addressed in these templates are Crawled Pages, Thematic Reports, Site Health, Warnings. All the content presented in this PPT design is completely editable. Download it and make adjustments in color, background, font etc. as per your unique business setting.
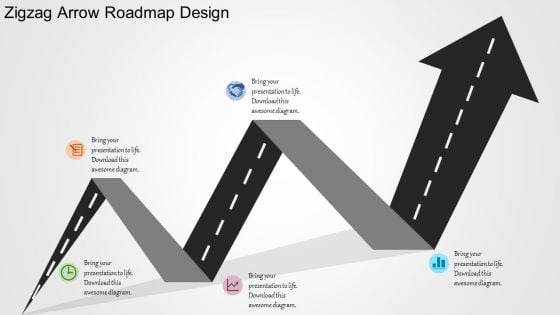
Zigzag Arrow Roadmap Design PowerPoint Templates
Need to show the achievements or performance of your company or want to show your colleagues their targets. Have a look at the above slide. Presenting zigzag arrow road map PowerPoint template design which has everything that you need for your presentation. This PPT template is very helpful and can be used in various ways. For example, it can depict what are the hindrances one might face in order to achieve the goal. This design can also be used to show your business or company?s performance over the period of time, or how has the journey been. This slide has five customizable icons which can help you put forward your point and give you the edge over those boring presentations. This template can be modified as per your needs. So what are you waiting for? Download this amazing zigzag road map PowerPoint template for your presentation.
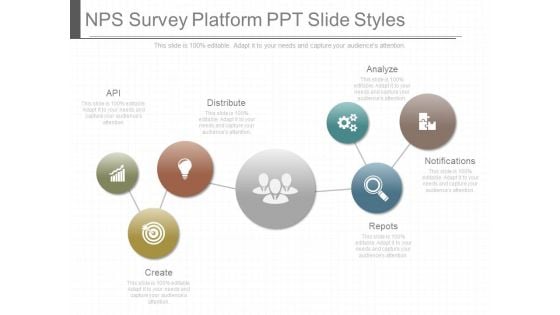
Naps Survey Platform Ppt Slide Styles
This is a naps survey platform ppt slide styles. This is a one stage process. The stages in this process are distribute, create, analyze, notifications, reports.
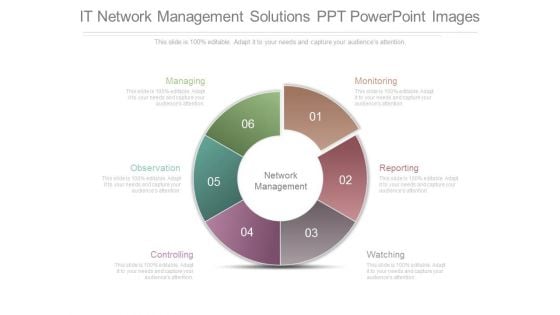
It Network Management Solutions Ppt Powerpoint Images
This is a it network management solutions ppt powerpoint images. This is a six stage process. The stages in this process are monitoring, reporting, watching, controlling, observation, managing.
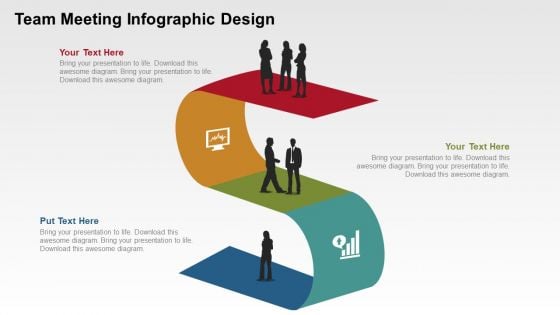
Team Meeting Infographic Design PowerPoint Templates
This template can be best used to describe different levels in an organization. It could be perfect solution if you are looking for a slide to depict the existing hierarchy or flow of communication in a company. This S shaped PowerPoint template is good enough to encourage your colleagues, teammates to reach their goals. This slide can represent stairs and what steps have to be taken to reach the top or achieve the targets. This diagram also displays how you can plan or discuss things with others during your journey. And slowly steadily you are there at the top. You can easily modify it per your needs and convenience. The human icons are editable. Use this background to make your point easy to understand.
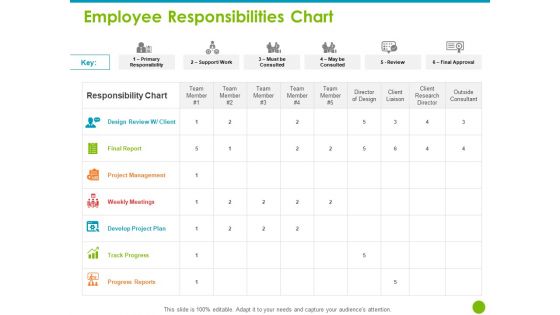
Project Capabilities Employee Responsibilities Chart Ppt Infographics File Formats PDF
Presenting this set of slides with name project capabilities employee responsibilities chart ppt infographics file formats pdf. The topics discussed in these slides are progress reports, track progress, develop project plan, weekly meetings, project management, final report. This is a completely editable PowerPoint presentation and is available for immediate download. Download now and impress your audience.
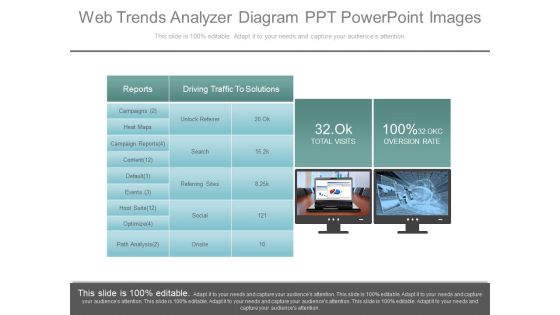
Web Trends Analyzer Diagram Ppt Powerpoint Images
This is a web trends analyzer diagram ppt powerpoint images. This is a two stage process. The stages in this process are reports, driving traffic to solutions, campaigns, heat maps, campaign reports, content, default, events, hoot suite, optimize, unlock referrer, search, referring sites, social, onsite, 32 ok total visits, 100 percent 32 okc oversion rate.
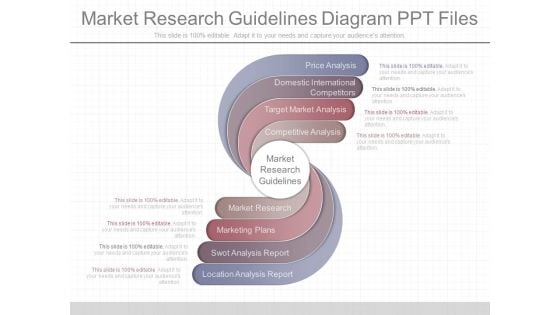
Market Research Guidelines Diagram Ppt Files
This is a market research guidelines diagram ppt files. This is a four stage process. The stages in this process are price analysis, domestic international competitors, target market analysis, competitive analysis, market research guidelines, market research, marketing plans, swot analysis report, location analysis report.
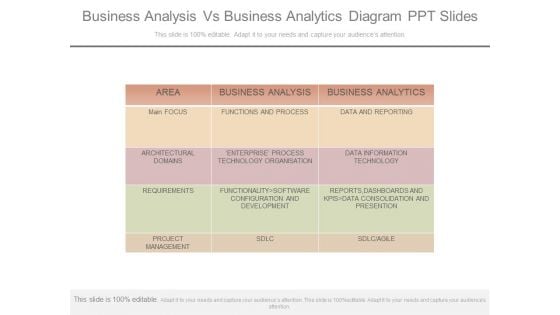
Business Analysis Vs Business Analytics Diagram Ppt Slides
This is a business analysis vs business analytics diagram ppt slides. This is a one stage process. The stages in this process are area, main focus, architectural domains, requirements, project management, business analysis, functions and process, enterprise? process technology organisation, functionality software configuration and development, sdlc, business analytics, data and reporting, data information technology, reports, dashboards and kpis data consolidation and presention, sdlc agile.

Quarterly Financial Performance Dashboard By Power BI Ppt Sample SS
This slide represents the pyramid showing the asset performance management. It includes details related to APM-centric, predictive, condition-based, preventive and reactive maintenance. Find a pre-designed and impeccable Quarterly Financial Performance Dashboard By Power BI Ppt Sample SS The templates can ace your presentation without additional effort. You can download these easy-to-edit presentation templates to make your presentation stand out from others. So, what are you waiting for Download the template from Slidegeeks today and give a unique touch to your presentation. This slide represents the pyramid showing the asset performance management. It includes details related to APM-centric, predictive, condition-based, preventive and reactive maintenance.
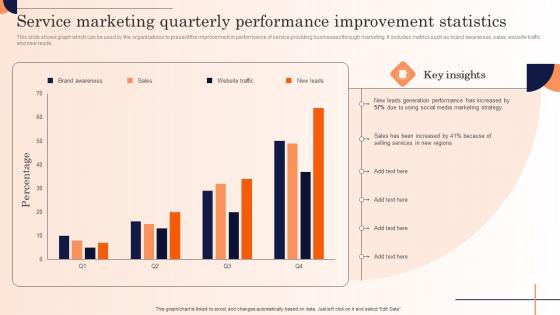
Service Marketing Quarterly Performance Strategic Marketing Campaign Demonstration Pdf
This slide shows graph which can be used by the organizations to present the improvement in performance of service providing businesses through marketing. It includes metrics such as brand awareness, sales, website traffic and new leads.Take your projects to the next level with our ultimate collection of Service Marketing Quarterly Performance Strategic Marketing Campaign Demonstration Pdf. Slidegeeks has designed a range of layouts that are perfect for representing task or activity duration, keeping track of all your deadlines at a glance. Tailor these designs to your exact needs and give them a truly corporate look with your own brand colors they all make your projects stand out from the rest. This slide shows graph which can be used by the organizations to present the improvement in performance of service providing businesses through marketing. It includes metrics such as brand awareness, sales, website traffic and new leads.
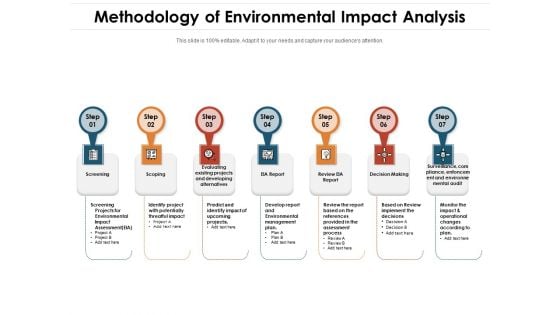
Methodology Of Environmental Impact Analysis Ppt PowerPoint Presentation Portfolio Slide Portrait PDF
Presenting methodology of environmental impact analysis ppt powerpoint presentation portfolio slide portrait pdf to dispense important information. This template comprises seven stages. It also presents valuable insights into the topics including screening, scoping, eia report, review eia report, decision making. This is a completely customizable PowerPoint theme that can be put to use immediately. So, download it and address the topic impactfully.
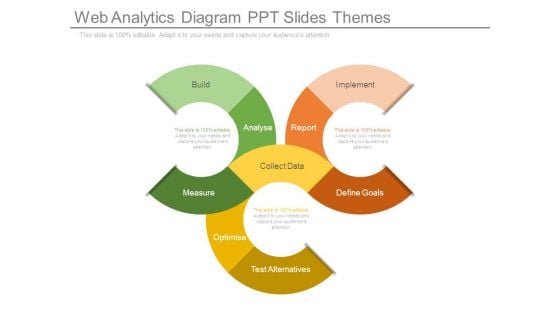
Web Analytics Diagram Ppt Slides Themes
This is a web analytics diagram ppt slides themes. This is a three stage process. The stages in this process are build, analyse, measure, test alternatives, optimise, collect data, define goals, report, implement.
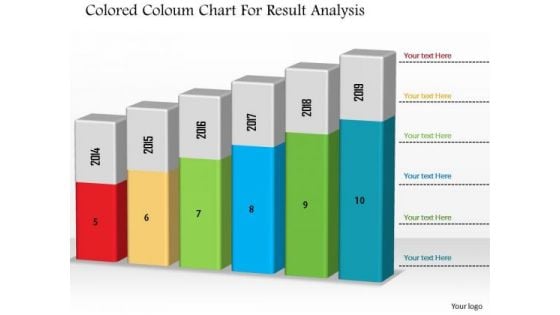
Business Diagram Colored Column Chart For Result Analysis PowerPoint Slide
This Power Point diagram has been designed with graphic of column chart. It contains diagram of bar char depicting annual business progress report. Use this diagram to build professional presentations for your viewers.
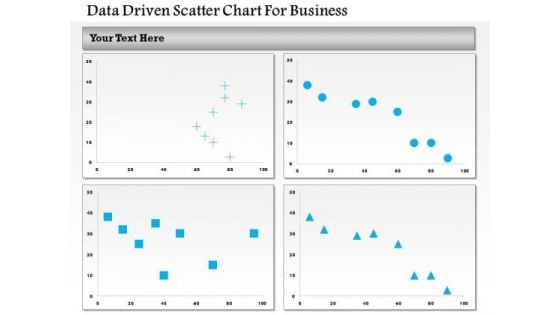
Business Diagram Data Driven Scatter Chart For Business PowerPoint Slide
This business diagram has been designed with four comparative charts. This slide suitable for data representation. You can also use this slide to present business analysis and reports. Use this diagram to present your views in a wonderful manner.
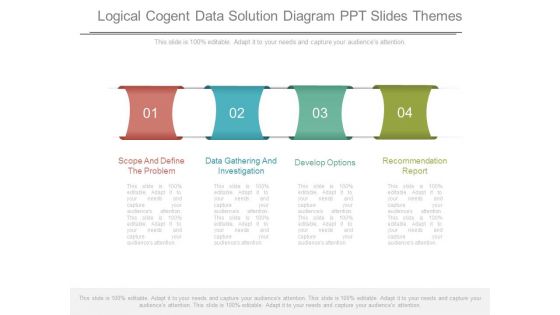
Logical Cogent Data Solution Diagram Ppt Slides Themes
This is a logical cogent data solution diagram ppt slides themes. This is a four stage process. The stages in this process are scope and define the problem, data gathering and investigation, develop options, recommendation report.
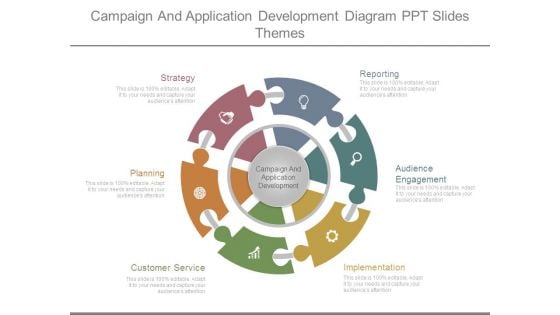
Campaign And Application Development Diagram Ppt Slides Themes
This is a campaign and application development diagram ppt slides themes. This is a six stage process. The stages in this process are campaign and application development, strategy, planning, customer service, reporting, audience engagement, implementation.
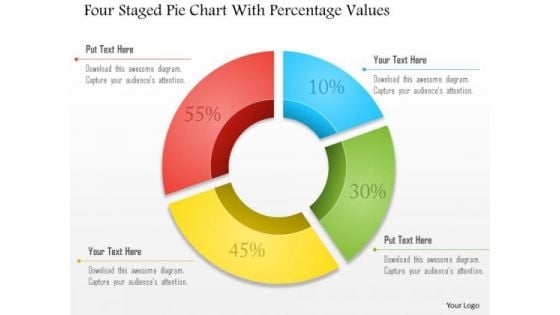
Business Diagram Four Staged Pie Chart With Percentage Values Presentation Template
Four staged pie chart and percentage values are used to design this business slide. Download this diagram to make business and financial reports. Use our above diagram to express information in a visual way.
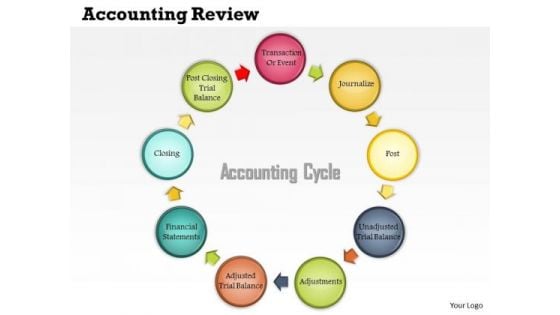
Business Framework Accounting Review PowerPoint Presentation
This circular diagram depicts the steps involved in the accounting process from when a transaction occurs up the end of period reports. Use this diagram to display accounting procedure in graphical way.
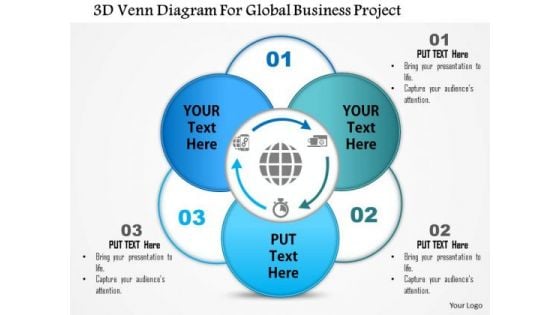
Business Diagram 3d Venn Diagram For Global Business Project Presentation Template
This business diagram displays 3d Venn diagram. This editable slide is suitable to present business reports. Use this diagram for business and finance related topics and display complete data analysis in your presentation.
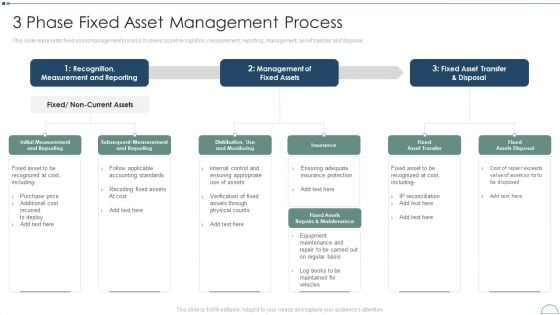
Fixed Asset Management Framework Implementation 3 Phase Fixed Asset Management Process Microsoft PDF
This slide represents fixed asset management process. It covers asset recognition, measurement, reporting, management, asset transfer and disposal.Deliver an awe inspiring pitch with this creative Fixed Asset Management Framework Implementation 3 Phase Fixed Asset Management Process Microsoft PDF bundle. Topics like Measurement And Reporting, Management Of Fixed, Asset Transfer can be discussed with this completely editable template. It is available for immediate download depending on the needs and requirements of the user.
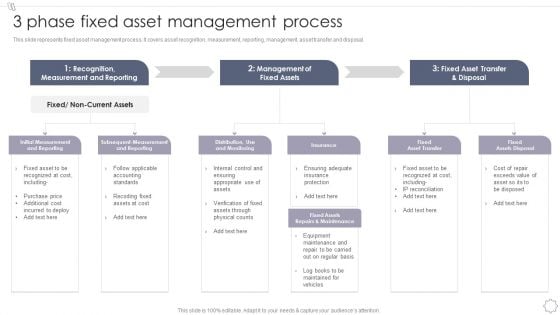
Maintaining And Managing Fixed Assets 3 Phase Fixed Asset Management Process Inspiration PDF
This slide represents fixed asset management process. It covers asset recognition, measurement, reporting, management, asset transfer and disposal.Deliver and pitch your topic in the best possible manner with this Maintaining And Managing Fixed Assets 3 Phase Fixed Asset Management Process Inspiration PDF. Use them to share invaluable insights on Measurement Reporting, Management Fixed, Fixed Asset and impress your audience. This template can be altered and modified as per your expectations. So, grab it now.
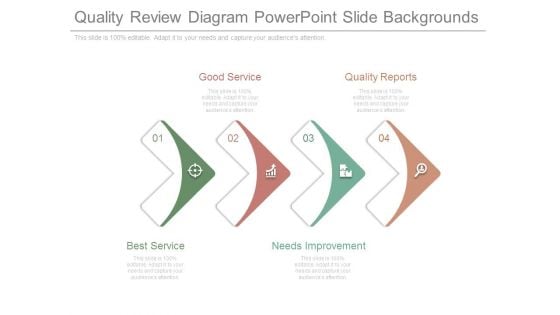
Quality Review Diagram Powerpoint Slide Backgrounds
This is a quality review diagram powerpoint slide backgrounds. This is a four stage process. The stages in this process are good service, quality reports, needs improvement, best service.
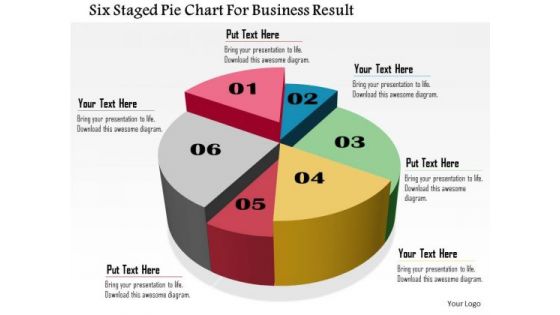
Business Daigram Six Staged Pie Chart For Business Result Presentation Templets
Six staged pie chart is used to design this business slide. Download this diagram to make business and financial reports. Use our above diagram to express information in a visual way.
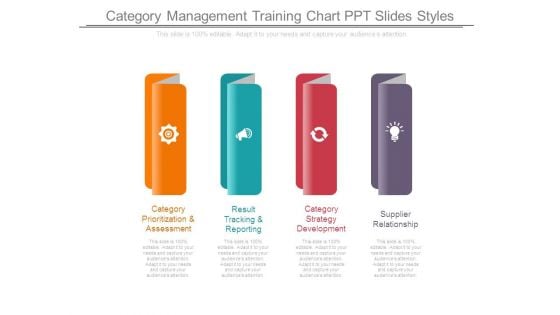
Category Management Training Chart Ppt Slides Styles
This is a category management training chart ppt slides styles. This is a four stage process. The stages in this process are category prioritization and assessment, result tracking and reporting, category strategy development, supplier relationship.
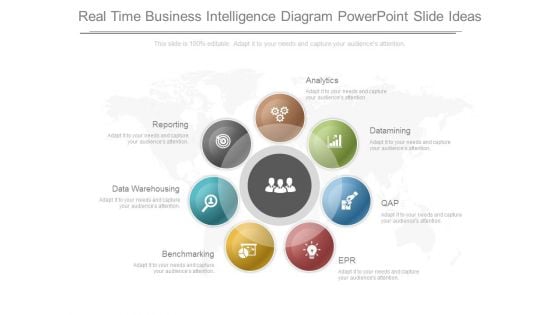
Real Time Business Intelligence Diagram Powerpoint Slide Ideas
This is a real time business intelligence diagram powerpoint slide ideas. This is a seven stage process. The stages in this process are data warehousing, reporting, analytics, datamining, qap, epr, benchmarking.
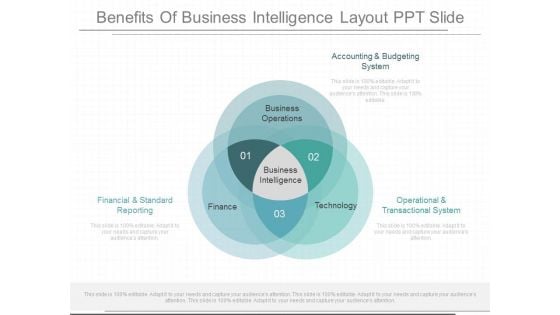
Benefits Of Business Intelligence Layout Ppt Slide
This is a benefits of business intelligence layout ppt slide. This is a three stage process. The stages in this process are accounting and budgeting system, financial and standard reporting, operational and transactional system, business operations, business intelligence, finance, technology.
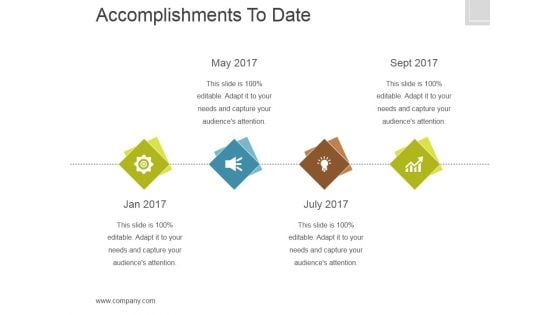
Accomplishments To Date Ppt PowerPoint Presentation Ideas
This is a accomplishments to date ppt powerpoint presentation ideas. This is a four stage process. The stages in this process are icons, business, process, marketing, years.
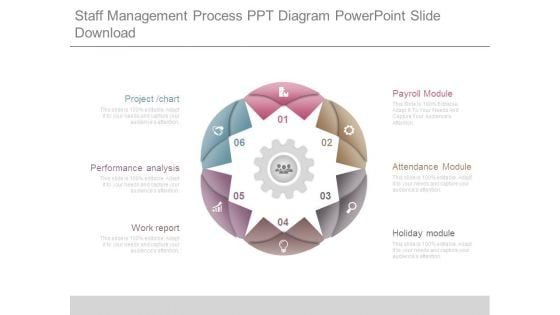
Staff Management Process Ppt Diagram Powerpoint Slide Download
This is a staff management process ppt diagram powerpoint slide download. This is a six stage process. The stages in this process are project chart, performance analysis, work report, holiday module, attendance module, payroll module.
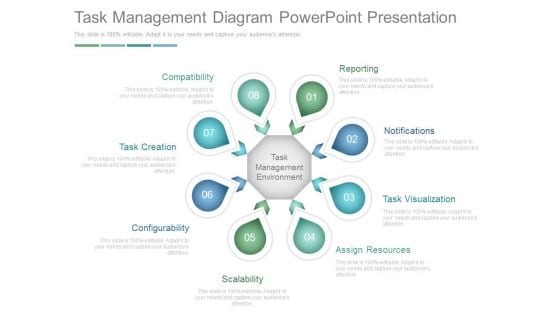
Task Management Diagram Powerpoint Presentation
This is a task management diagram powerpoint presentation. This is a eight stage process. The stages in this process are compatibility, task creation, configurability, scalability, assign resources, task visualization, notifications, reporting.
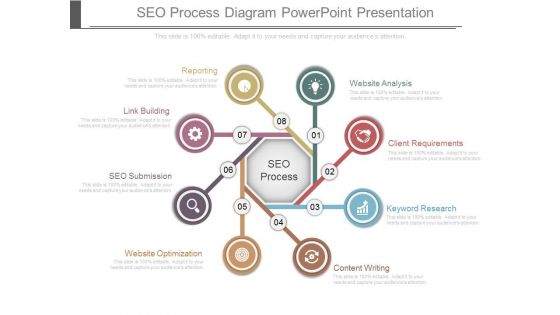
Seo Process Diagram Powerpoint Presentation
This is a seo process diagram powerpoint presentation. This is a eight stage process. The stages in this process are reporting, link building, seo submission, website optimization, content writing, keyword research, client requirements, website analysis, seo process.
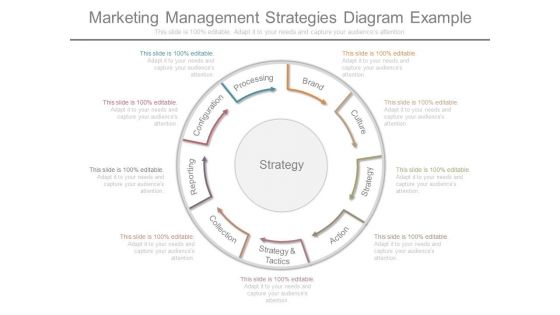
Marketing Management Strategies Diagram Example
This is a marketing management strategies diagram example. This is a nine stage process. The stages in this process are brand, culture, strategy, action, strategy and tactics, collection, reporting, configuration, processing.
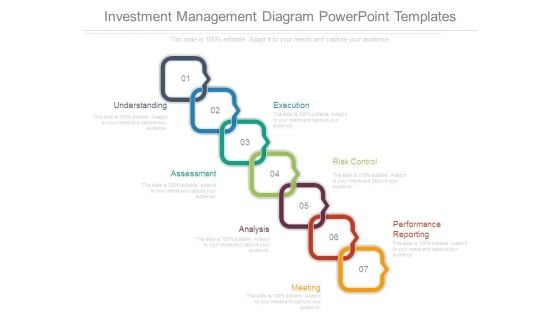
Investment Management Diagram Powerpoint Templates
This is a investment management diagram powerpoint templates. This is a seven stage process. The stages in this process are understanding, execution, risk control, performance reporting, meeting, analysis, assessment.
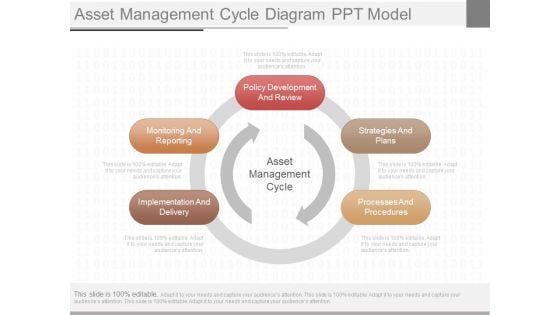
Asset Management Cycle Diagram Ppt Model
This is a asset management cycle diagram ppt model. This is a five stage process. The stages in this process are monitoring and reporting, policy development and review, implementation and delivery, strategies and plans, processes and procedures, asset management cycle.
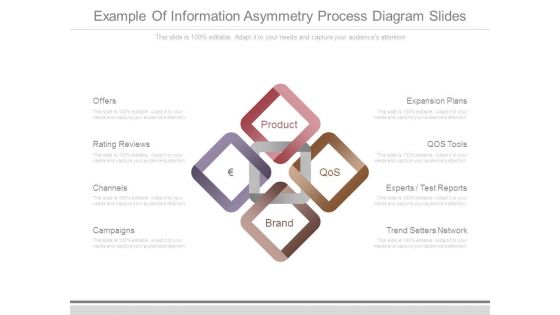
Example Of Information Asymmetry Process Diagram Slides
This is a example of information asymmetry process diagram slides. This is a four stage process. The stages in this process are offers, rating reviews, channels, campaigns, product, brand, expansion plans, qos tools, experts test reports, trend setters network.
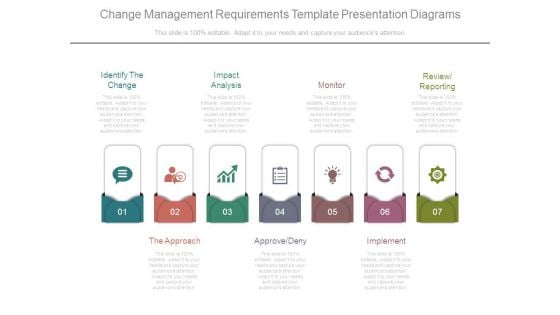
Change Management Requirements Template Presentation Diagrams
This is a Change Management Requirements Template Presentation Diagrams. This is a seven stage process. The stages in this process are identify the change, impact analysis, monitor, review reporting, the approach, approve deny, implement.

Major Achievements Powerpoint Ppt Template Bundles
This Major Achievements Powerpoint Ppt Template Bundles is meant to inspire a sense of awe about the organization, planning, skill and innovation you bring to business, and the ways it pays you back. The presentation template in Technological Achievements, Achievements In Healthcare Industry, Accomplishments Of AI slides also lists the roles and duties of a business organization and its members in building a wholesome, prosperous society. You can create a comprehensive chart on business functions and showcase specifics that make you special due to the 100 percent editable and customizable nature of the presentation. Encourage stakeholders to dig deep into business knowledge and use it in practice to deliver quality products and service with the uses of this PPT Template for the ages. Download now. Our Major Achievements PowerPoint Template Bundles are expertly designed to enhance any presentation. Use them to present your accomplishments with a professional and visually appealing backdrop.
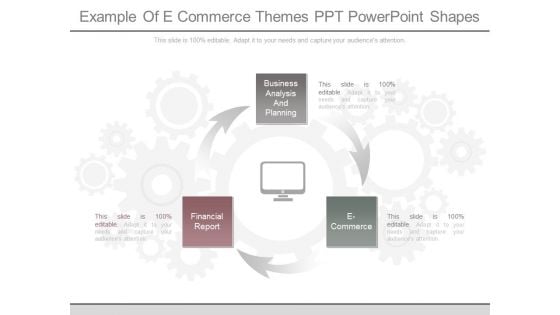
Example Of E Commerce Themes Ppt Powerpoint Shapes
This is a example of e commerce themes ppt powerpoint shapes. This is a three stage process. The stages in this process are business analysis and planning, financial report, e commerce.

Kpi Engineering Process Cycle Diagram Ppt Sample
This is a kpi engineering process cycle diagram ppt sample. This is a six stage process. The stages in this process are program discovery, database optimization, program implementation, program delivery, program maintenance, analysis and reporting.

Order Fulfillment Cycle Diagram Ppt Sample
This is an order fulfillment cycle diagram ppt sample. This is a four stage process. The stages in this process are storage, incoming orders, picking, packing and despatch, reporting, stock control, incoming shipments.
Web Based Crm Diagram Ppt Slides
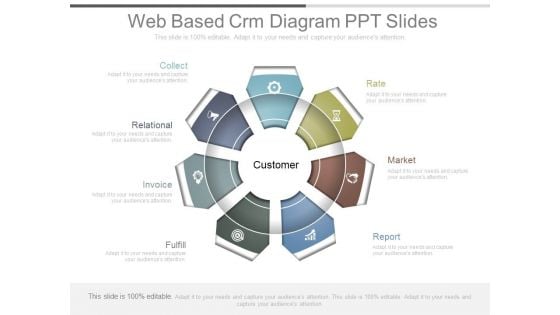
This is a web based crm diagram ppt slides. This is a five stage process. The stages in this process are collect, relational, invoice, fulfill, rate, market, report, customer.
Sales Crm Solution Diagram Powerpoint Show
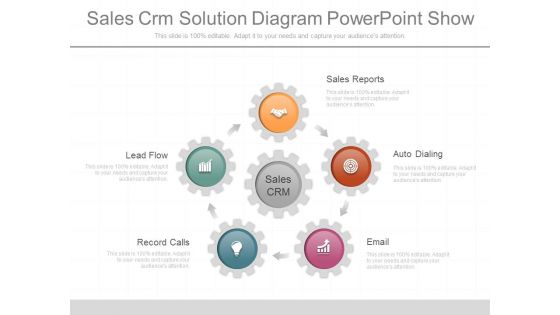
This is a sales crm solution diagram powerpoint show. This is a five stage process. The stages in this process are lead flow, record calls, email, auto dialing, sales reports, sales crm.
Small Business Crm Solutions Diagram Powerpoint Graphics
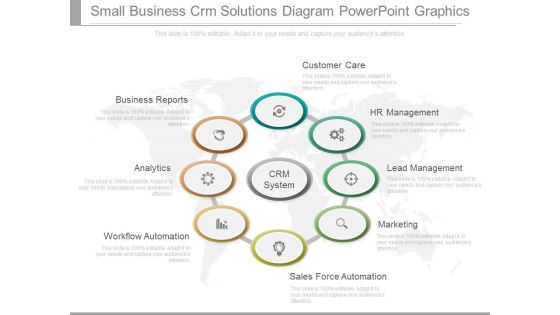
This is a small business crm solutions diagram powerpoint graphics. This is a eight stage process. The stages in this process are business reports, analytics, workflow automation, sales force automation, marketing, lead management, hr management, customer care, crm system.
Branding Corporate Identity Diagram Powerpoint Slides
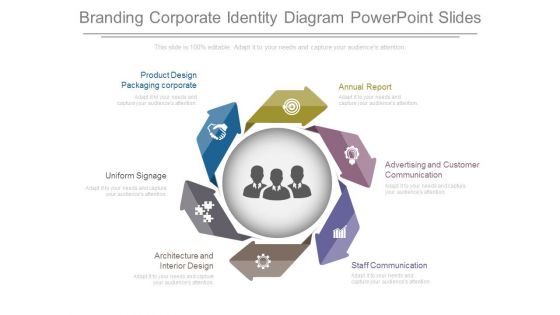
This is a branding corporate identity diagram powerpoint slides. This is a six stage process. The stages in this process are annual report, advertising and customer communication, staff communication, architecture and interior design uniform signage, product design packaging corporate.
Email Marketing Strategy Diagram Ppt Presentation Examples
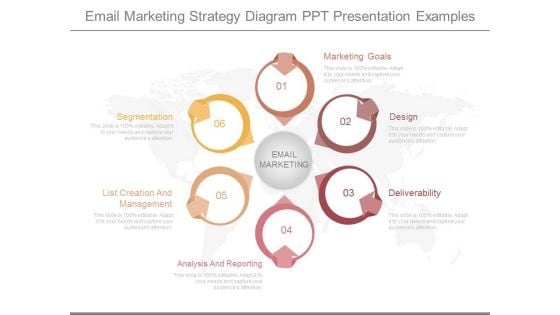
This is a email marketing strategy diagram ppt presentation examples. This is a six stage process. The stages in this process are segmentation, list creation and management, analysis and reporting, email marketing, marketing goals, design, deliverability.
Feasibility Of Project Diagram Presentation Visuals
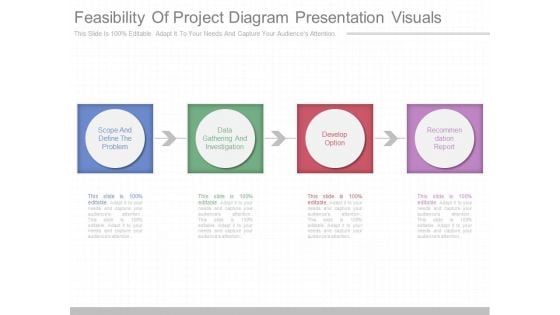
This is a feasibility of project diagram presentation visuals. This is a four stage process. The stages in this process are scope and define the problem, data gathering and investigation, develop option, recommendation report.
Business Research Process Diagram Ppt Example
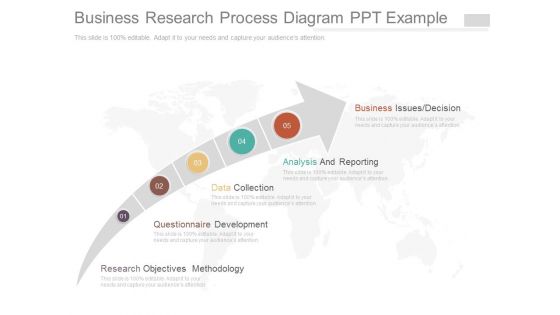
This is a business research process diagram ppt example. This is a five stage process. The stages in this process are business issues decision, analysis and reporting, data collection, questionnaire development, research objectives methodology.
Data Warehousing Opportunities Diagram Ppt Powerpoint Slides
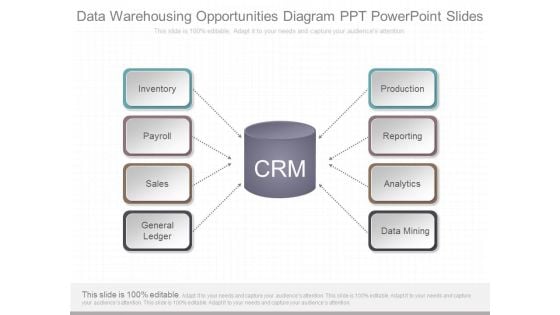
This is a data warehousing opportunities diagram ppt powerpoint slides. This is a eight stage process. The stages in this process are inventory, payroll, sales, ledger general, production, reporting, analytics, data mining.
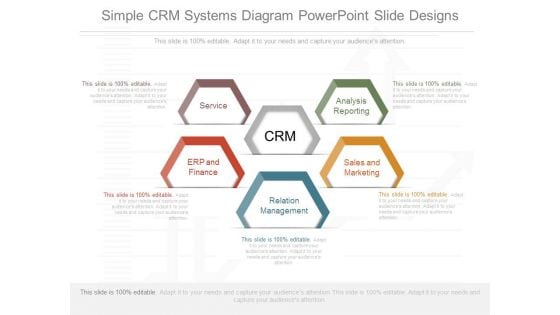
Simple Crm Systems Diagram Powerpoint Slide Designs
This is a simple crm systems diagram powerpoint slide designs. This is a five stage process. The stages in this process are service, erp and finance, analysis reporting, sales and marketing, relation management.
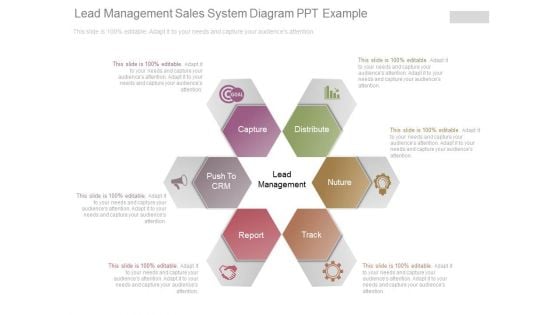
Lead Management Sales System Diagram Ppt Example
This is a lead management sales system diagram ppt example. This is a six stage process. The stages in this process are capture, distribute, nuture, track, report, push to crm, lead management.
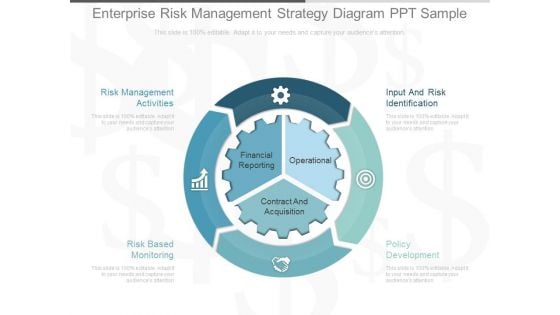
Enterprise Risk Management Strategy Diagram Ppt Sample
This is a enterprise risk management strategy diagram ppt sample. This is a three stage process. The stages in this process are risk management activities, input and risk identification, risk based monitoring, policy development, financial reporting, operational, contract and acquisition.\n\n\n\n\n\n\n\n
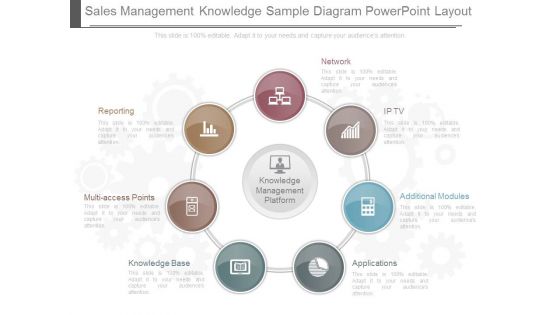
Sales Management Knowledge Sample Diagram Powerpoint Layout
This is a sales management knowledge sample diagram powerpoint layout. This is a seven stage process. The stages in this process are network, ip tv, additional modules, applications, knowledge base, multi access points, reporting.
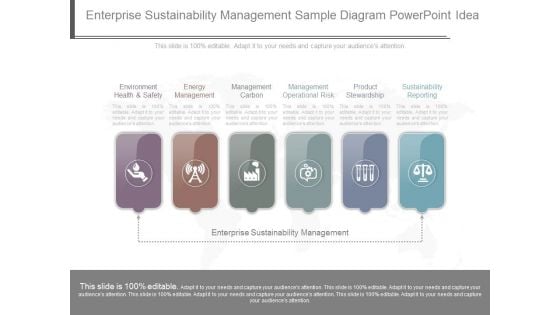
Enterprise Sustainability Management Sample Diagram Powerpoint Idea
This is a enterprise sustainability management sample diagram powerpoint idea. This is a six stage process. The stages in this process are environment health and safety, energy management, management carbon, management operational risk, product stewardship, sustainability reporting, enterprise sustainability management.
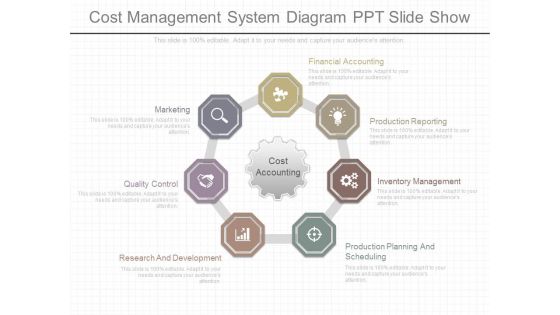
Cost Management System Diagram Ppt Slide Show
This is a cost management system diagram ppt slide show. This is a seven stage process. The stages in this process are research and development, quality control, marketing, financial accounting, production reporting, inventory management, production planning and scheduling, cost accounting.
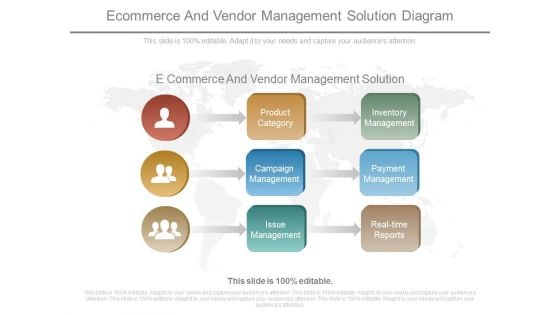
E Commerce And Vendor Management Solution Diagram
This is a e commerce and vendor management solution diagram. This is a nine stage process. The stages in this process are product category, campaign management, issue management, inventory management, payment management, real time reports.\n\n\n\n
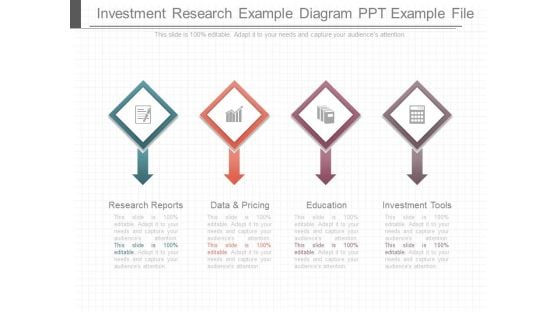
Investment Research Example Diagram Ppt Example File
This is a investment research example diagram ppt example file. This is a four stage process. The stages in this process are research reports, data and pricing, education, investment tools.
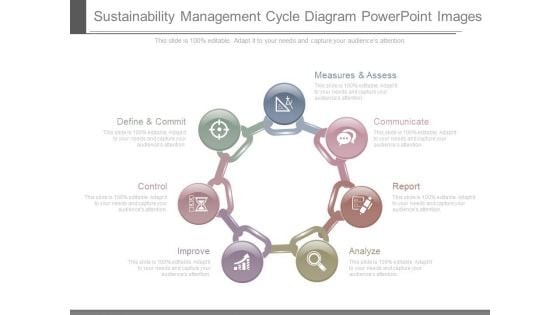
Sustainability Management Cycle Diagram Powerpoint Images
This is a sustainability management cycle diagram powerpoint images. This is a seven stage process. The stages in this process are define and commit, control, improve, analyze, report, communicate, measures and assess.
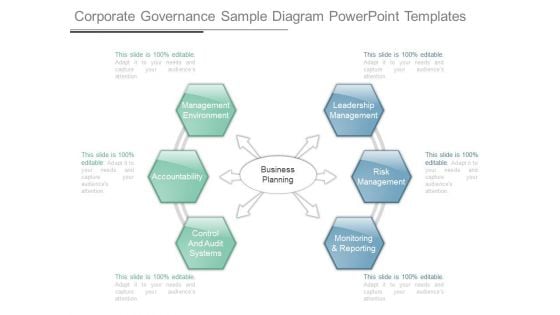
Corporate Governance Sample Diagram Powerpoint Templates
This is a corporate governance sample diagram powerpoint templates. This is a six stage process. The stages in this process are management environment, leadership management, accountability, control and audit systems, monitoring and reporting, risk management, business planning.

Service Level Management Sample Diagram Powerpoint Slide
This is a service level management sample diagram powerpoint slide. This is a five stage process. The stages in this process are service level management, availability sla, plan, monitor, report.

Streamline Commercial Lending Diagram Ppt Examples
This is a streamline commercial lending diagram ppt examples. This is a six stage process. The stages in this process are origination, structuring, due diligence, reporting, marketing, credit analysis.
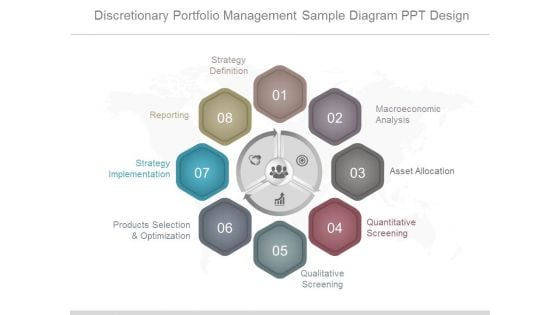
Discretionary Portfolio Management Sample Diagram Ppt Design
This is a discretionary portfolio management sample diagram ppt design. This is a eight stage process. The stages in this process are strategy definition, reporting, strategy implementation, products selection and optimization, macroeconomic analysis, asset allocation, quantitative screening, qualitative screening.
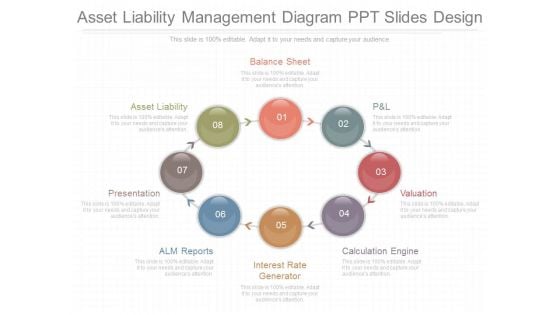
Asset Liability Management Diagram Ppt Slides Design
This is a asset liability management diagram ppt slides design. This is a eight stage process. The stages in this process are valuation, calculation engine, interest rate generator, alm reports, presentation, asset liability, balance sheet, p and l.
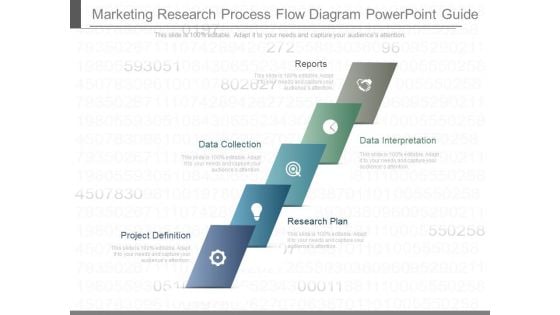
Marketing Research Process Flow Diagram Powerpoint Guide
This is a marketing research process flow diagram powerpoint guide. This is a five stage process. The stages in this process are reports, data interpretation, data collection, research plan, project definition.
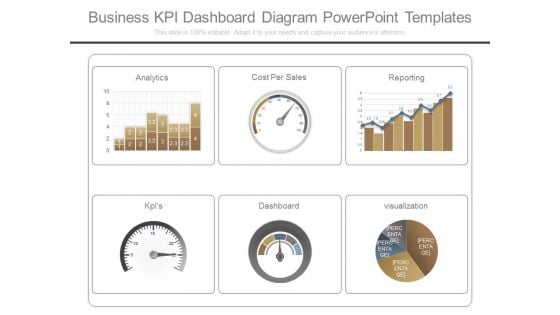
Business Kpi Dashboard Diagram Powerpoint Templates
This is a business kpi dashboard diagram powerpoint templates. This is a six stage process. The stages in this process are analytics, cost per sales, reporting, kpis, dashboard, visualization.
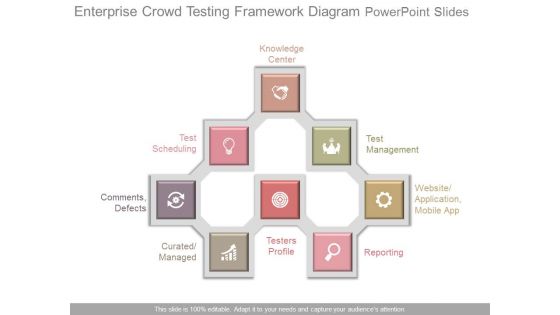
Enterprise Crowd Testing Framework Diagram Powerpoint Slides
This is a enterprise crowd testing framework diagram powerpoint slides. This is a eight stage process. The stages in this process are knowledge center, test scheduling, test management, comments defects, website application mobile app, curated managed, testers profile, reporting.
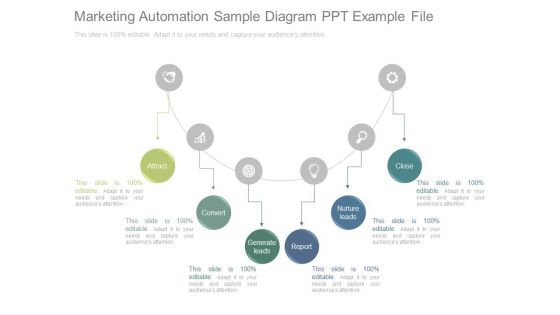
Marketing Automation Sample Diagram Ppt Example File
This is a marketing automation sample diagram ppt example file. This is a six stage process. The stages in this process are attract, convert, generate leads, report, nurture leads, close.
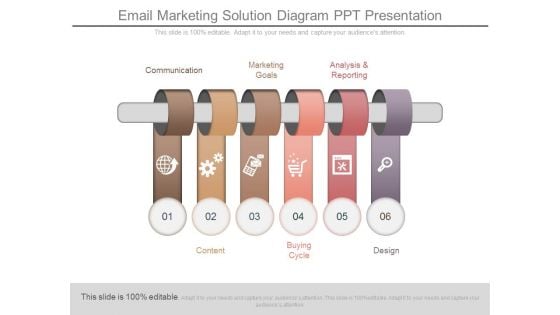
Email Marketing Solution Diagram Ppt Presentation
This is a email marketing solution diagram ppt presentation. This is a six stage process. The stages in this process are communication, marketing, goals, analysis and reporting, content, buying cycle, design.
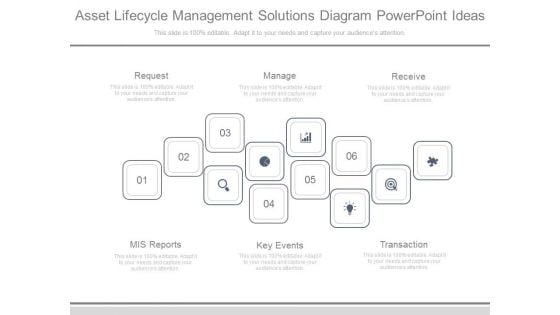
Asset Lifecycle Management Solutions Diagram Powerpoint Ideas
This is a asset lifecycle management solutions diagram powerpoint ideas. This is a six stage process. The stages in this process are request, manage, receive, mis reports, key events, transaction.
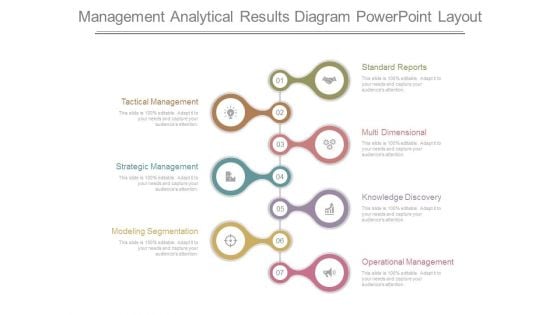
Management Analytical Results Diagram Powerpoint Layout
This is a management analytical results diagram powerpoint layout. This is a seven stage process. The stages in this process are standard reports, multi dimensional, knowledge discovery, operational management, modeling segmentation, strategic management, tactical management.

Annual Financial Planning Cycle Diagram Ppt Summary
This is a annual financial planning cycle diagram ppt summary. This is a six stage process. The stages in this process are annual report, risk management, strategy objectives, budget, strategy invectives, evaluate alternatives.
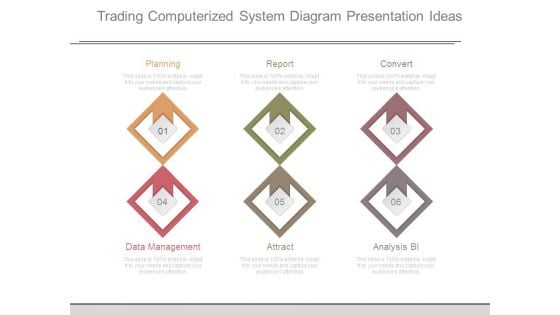
Trading Computerized System Diagram Presentation Ideas
This is a trading computerized system diagram presentation ideas. This is a six stage process. The stages in this process are planning, report, convert, data management, attract, analysis bi.
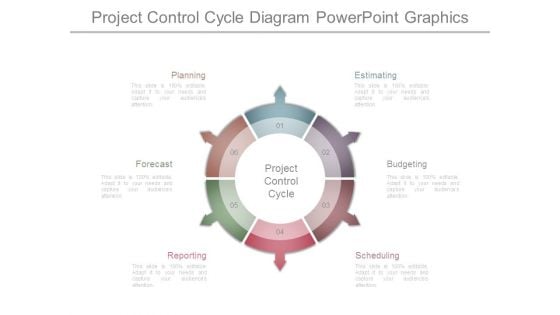
Project Control Cycle Diagram Powerpoint Graphics
This is a project control cycle diagram powerpoint graphics. This is a six stage process. The stages in this process are estimating, budgeting, scheduling, reporting, forecast, planning, project control cycle.

Internal Audit Process Diagram Presentation Powerpoint Example
This is a internal audit process diagram presentation powerpoint example. This is a six stage process. The stages in this process are our audit process, reporting, internal audit process, fieldwork, corrective action, planning.
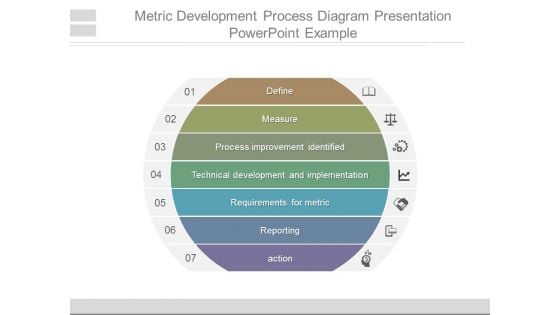
Metric Development Process Diagram Presentation Powerpoint Example
This is a metric development process diagram presentation powerpoint example. This is a seven stage process. The stages in this process are define, measure, process improvement identified, technical development and implementation, requirements for metric, reporting, action.
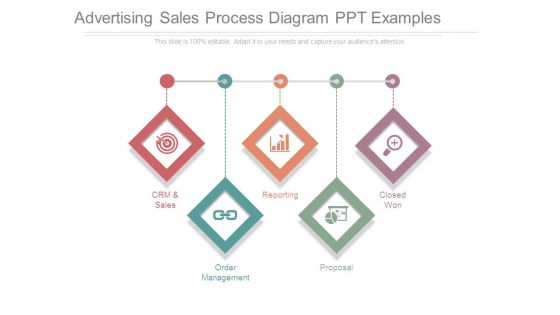
Advertising Sales Process Diagram Ppt Examples
This is a advertising sales process diagram ppt examples. This is a five stage process. The stages in this process are crm and sales, order management, reporting, proposal, closed won.
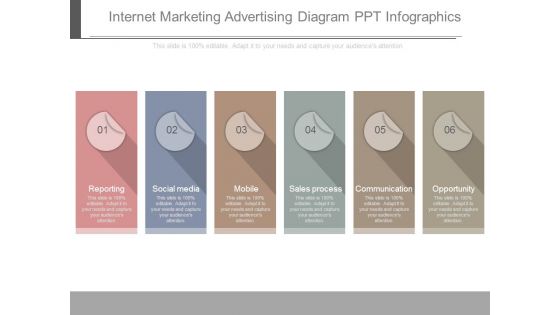
Internet Marketing Advertising Diagram Ppt Infographics
This is a internet marketing advertising diagram ppt infographics. This is a six stage process. The stages in this process are reporting, social media, mobile, sales process, communication, opportunity.
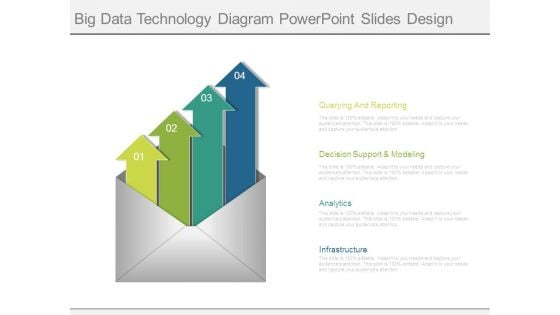
Big Data Technology Diagram Powerpoint Slides Design
This is a big data technology diagram powerpoint slides design. This is a four stage process. The stages in this process are querying and reporting, decision support and modeling, analytics, infrastructure.
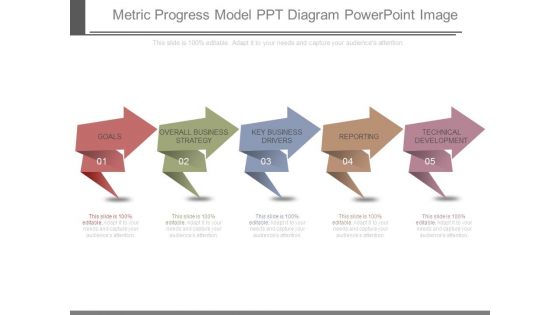
Metric Progress Model Ppt Diagram Powerpoint Image
This is a metric progress model ppt diagram powerpoint image. This is a five stage process. The stages in this process are goals, overall business strategy, key business drivers, reporting, technical development.
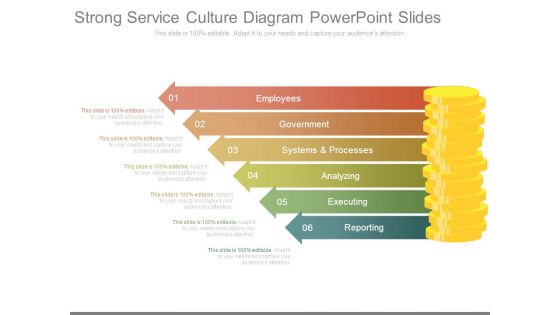
Strong Service Culture Diagram Powerpoint Slides
This is a strong service culture diagram powerpoint slides. This is a six stage process. The stages in this process are employees, government, systems and processes, analyzing, executing, reporting.
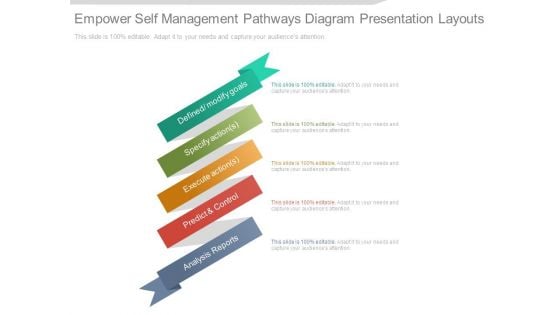
Empower Self Management Pathways Diagram Presentation Layouts
This is a Empower Self Management Pathways Diagram Presentation Layouts. This is a five stage process. The stages in this process are defined modify goals, specify action, execute action, predict and control, analysis reports.
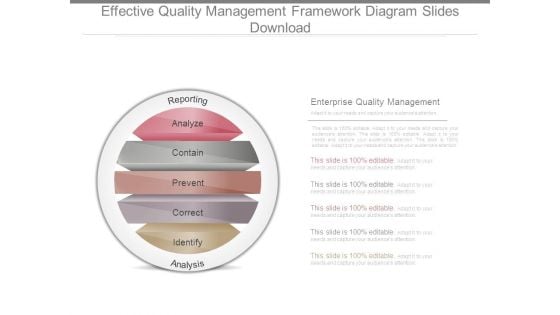
Effective Quality Management Framework Diagram Slides Download
This is a effective quality management framework diagram slides download. This is a five stage process. The stages in this process are reporting, analyze, contain, prevent, correct, identify, analysis, enterprise quality management.
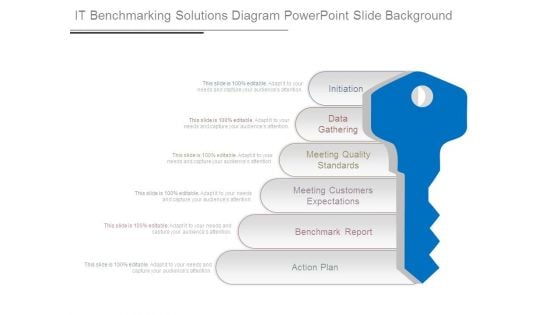
It Benchmarking Solutions Diagram Powerpoint Slide Background
This is a it benchmarking solutions diagram powerpoint slide background. This is a six stage process. The stages in this process are initiation, data gathering, meeting quality standards, meeting customers expectations, benchmark report, action plan.
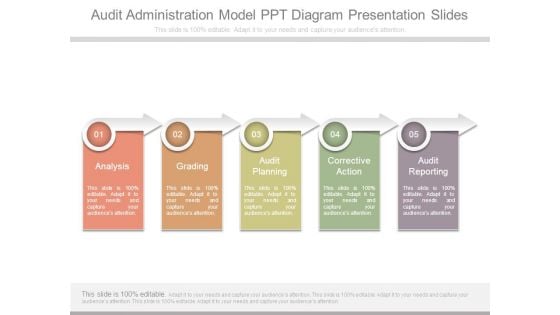
Audit Administration Model Ppt Diagram Presentation Slides
This is a audit administration model ppt diagram presentation slides. This is a five stage process. The stages in this process are analysis, grading, audit planning, corrective action, audit reporting.
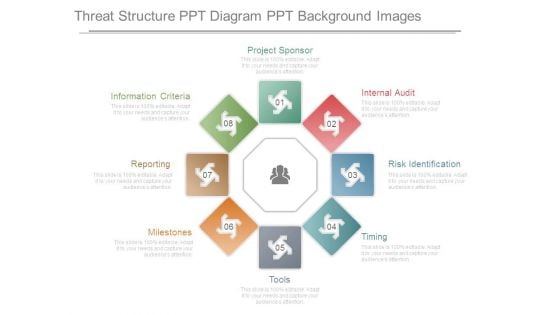
Threat Structure Ppt Diagram Ppt Background Images
This is a threat structure ppt diagram ppt background images. This is a eight stage process. The stages in this process are project sponsor, internal audit, risk identification, timing, tools, milestones, reporting, information criteria.
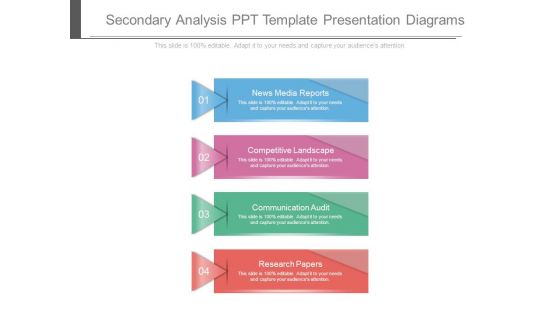
Secondary Analysis Ppt Template Presentation Diagrams
This is a secondary analysis ppt template presentation diagrams. This is a four stage process. The stages in this process are news media reports, competitive landscape, communication audit, research papers.
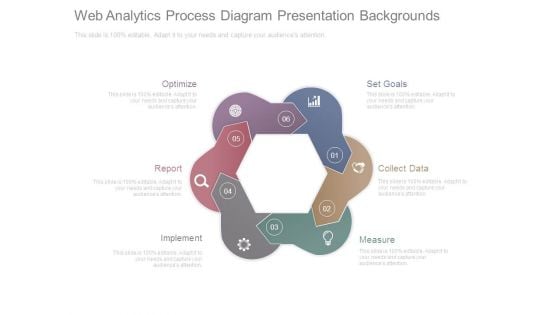
Web Analytics Process Diagram Presentation Backgrounds
This is a web analytics process diagram presentation backgrounds. This is a six stage process. The stages in this process are optimize, report, implement, measure, collect data, set goals.
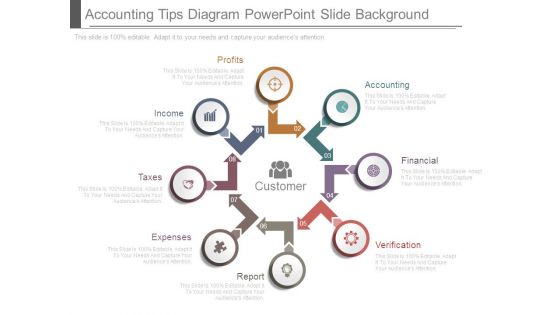
Accounting Tips Diagram Powerpoint Slide Background
This is a accounting tips diagram powerpoint slide background. This is a eight stage process. The stages in this process are accounting, financial, verification, report, expenses, taxes, income, profits, customer.
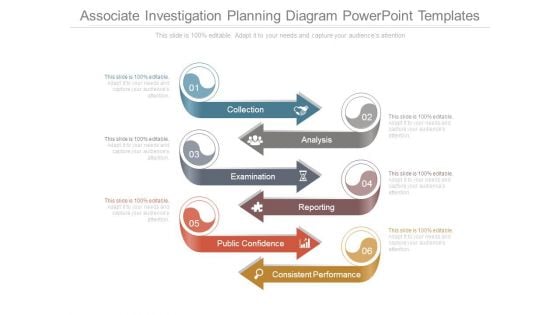
Associate Investigation Planning Diagram Powerpoint Templates
This is a associate investigation planning diagram powerpoint templates. This is a six stage process. The stages in this process are collection, analysis, examination, reporting, public confidence, consistent performance.

Customized Analytical Support Diagram Powerpoint Presentation Examples
This is a customized analytical support diagram powerpoint presentation examples. This is a four stage process. The stages in this process are scope and define the problem, data gathering and investigation, develop options, recommendation report.
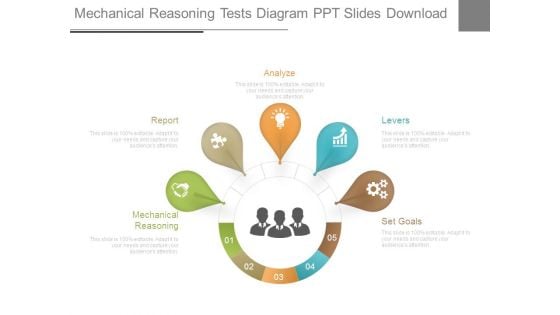
Mechanical Reasoning Tests Diagram Ppt Slides Download
This is a mechanical reasoning tests diagram ppt slides download. This is a five stage process. The stages in this process are mechanical reasoning, report, analyze, levers, set goals.
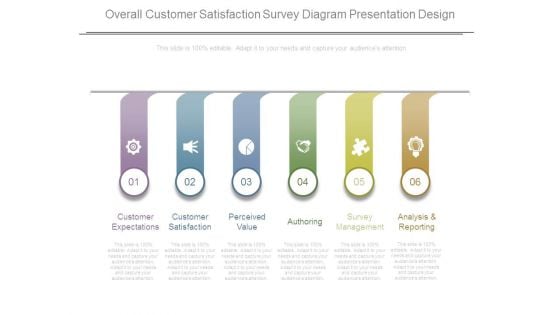
Overall Customer Satisfaction Survey Diagram Presentation Design
This is a overall customer satisfaction survey diagram presentation design. This is a six stage process. The stages in this process are customer expectations, customer satisfaction, perceived value, authoring, survey management, analysis and reporting.
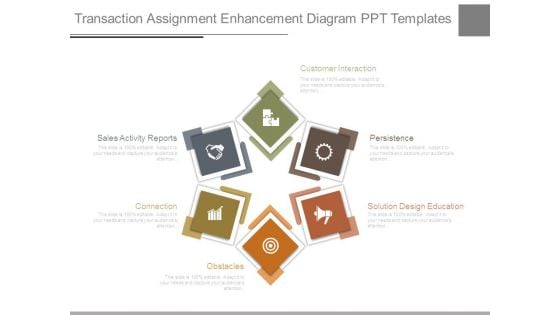
Transaction Assignment Enhancement Diagram Ppt Templates
This is a transaction assignment enhancement diagram ppt templates. This is a six stage process. The stages in this process are customer interaction, persistence, solution design education, obstacles, connection, sales activity reports.
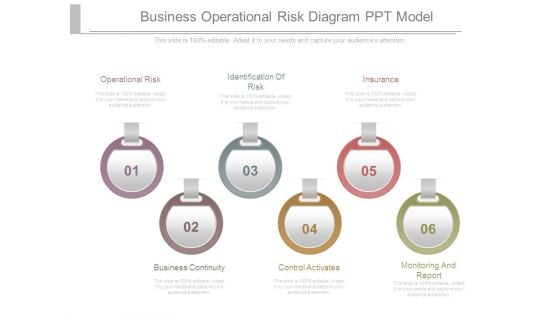
Business Operational Risk Diagram Ppt Model
This is a business operational risk diagram ppt model. This is a six stage process. The stages in this process are operational risk, identification of risk, insurance, business continuity, control activates, monitoring and report.
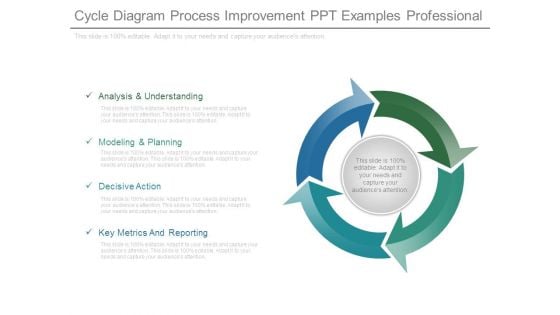
Cycle Diagram Process Improvement Ppt Examples Professional
This is a cycle diagram process improvement ppt examples professional. This is a four stage process. The stages in this process are analysis and understanding, modeling and planning, decisive action, key metrics and reporting.
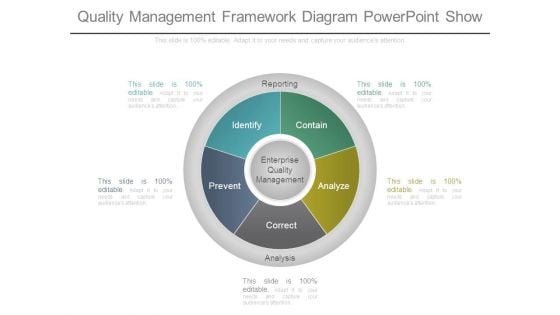
Quality Management Framework Diagram Powerpoint Show
This is a quality management framework diagram powerpoint show. This is a five stage process. The stages in this process are enterprise quality management, reporting, identify, prevent, correct, analyze, contain, analysis.
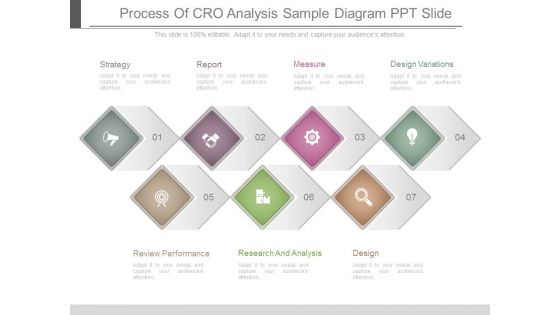
Process Of Cro Analysis Sample Diagram Ppt Slide
This is a process of cro analysis sample diagram ppt slide. This is a seven stage process. The stages in this process are strategy, report, measure, design variations, design, research and analysis, review performance.
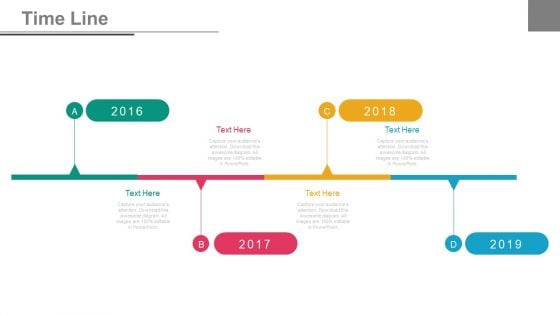
Four Years Tags Timeline Diagram Powerpoint Slides
This PowerPoint timeline slide design can be used to display yearly business report. This timeline template has been designed with four years tags. Download this PowerPoint timeline template to make impressive presentations.
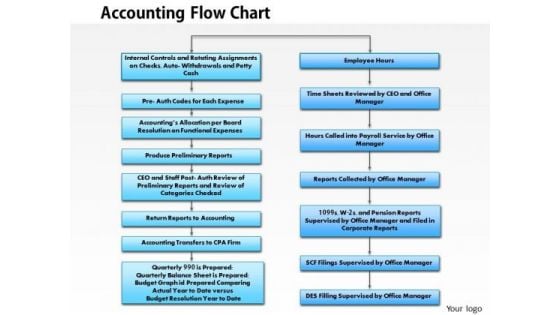
Business Framework Accounting Flowchart PowerPoint Presentation
This flowchart depicts the steps involved in the accounting process from when a transaction occurs up the end of period reports. Use this diagram to display accounting procedure in graphical way.

Ecommerce Features Sample Diagram Powerpoint Presentation Templates
This is a ecommerce features sample diagram powerpoint presentation templates. This is a fifteen stage process. The stages in this process are unlimited categories and products, create online payment facilities, order history, gift certificate, solid analytics and reporting, online sales reports, multi currency support, inventory management system, shopping cart system, customer product reviews, flexible pricing management, integrated shipping, catalog management, product feed support, discount of reward based schemes.\n\n\n\n\n\n\n\n
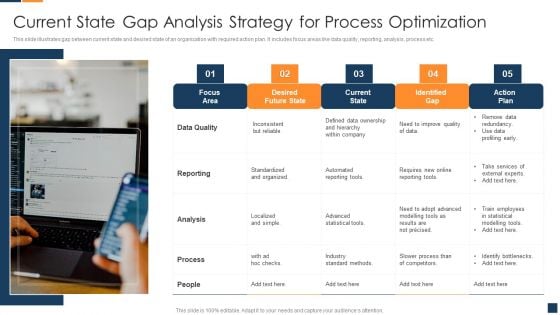
Current State Gap Analysis Strategy For Process Optimization Diagrams PDF
This slide illustrates gap between current state and desired state of an organization with required action plan. It includes focus areas like data quality, reporting, analysis, process etc. Presenting Current State Gap Analysis Strategy For Process Optimization Diagrams PDF to dispense important information. This template comprises five stages. It also presents valuable insights into the topics including Data Quality, Reporting, Analysis. This is a completely customizable PowerPoint theme that can be put to use immediately. So, download it and address the topic impactfully.
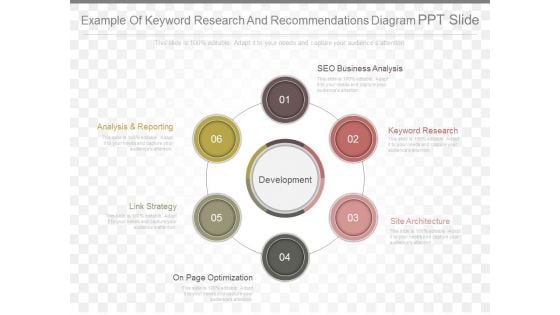
Example Of Keyword Research And Recommendations Diagram Ppt Slide
This is an example of keyword research and recommendations diagram ppt slide. This is a six stage process. The stages in this process are analysis and reporting, link strategy, on page optimization, site architecture, keyword research, seo business analysis.

Improve Net Promoter Score Diagram Ppt Slide Template
This is a improve net promoter score diagram ppt slide template. This is a five stage process. The stages in this process are program governance, driving innovation, action and accountability, enrolling and equipping the organization, measurement analysis and reporting.
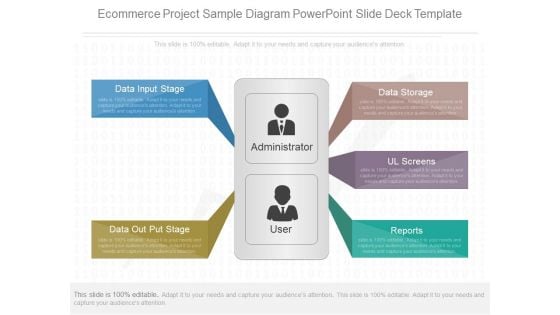
Ecommerce Project Sample Diagram Powerpoint Slide Deck Template
This is a ecommerce project sample diagram powerpoint slide deck template. This is a five stage process. The stages in this process are data input stage, data out put stage, data storage, ul screens, reports.
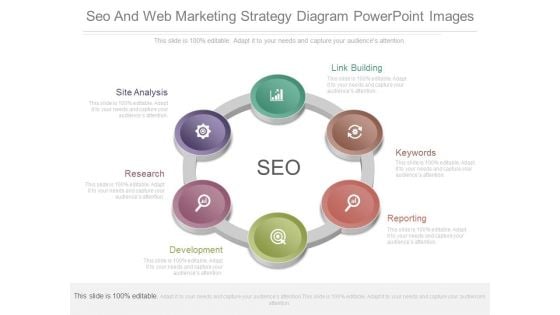
Seo And Web Marketing Strategy Diagram Powerpoint Images
This is a seo and web marketing strategy diagram powerpoint images. This is a six stage process. The stages in this process are seo, link building, keywords, reporting, development, research, site analysis.
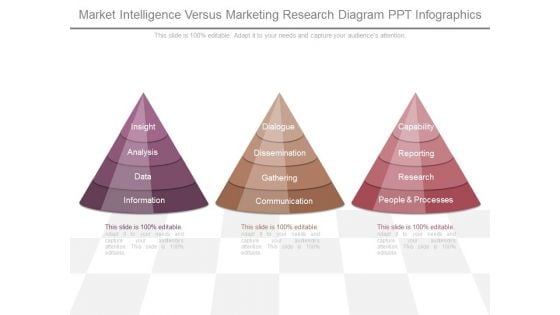
Market Intelligence Versus Marketing Research Diagram Ppt Infographics
This is a market intelligence versus marketing research diagram ppt infographics. This is a three stage process. The stages in this process are insight, analysis, data, information, dialogue, dissemination, gathering, communication, capability, reporting, research, people and processes.

 Home
Home