Resource Management

Case Study 2 Oculus Virtual Reality Headset Real Estate Crowdfunding To Unlock Fin SS V
This slide shows detailed information about technology companys crowdfunding campaign. It includes various actions taken by the organization to promote campaign and raise maximum funds for the project. Want to ace your presentation in front of a live audience Our Case Study 2 Oculus Virtual Reality Headset Real Estate Crowdfunding To Unlock Fin SS V can help you do that by engaging all the users towards you. Slidegeeks experts have put their efforts and expertise into creating these impeccable powerpoint presentations so that you can communicate your ideas clearly. Moreover, all the templates are customizable, and easy-to-edit and downloadable. Use these for both personal and commercial use. This slide shows detailed information about technology companys crowdfunding campaign. It includes various actions taken by the organization to promote campaign and raise maximum funds for the project.
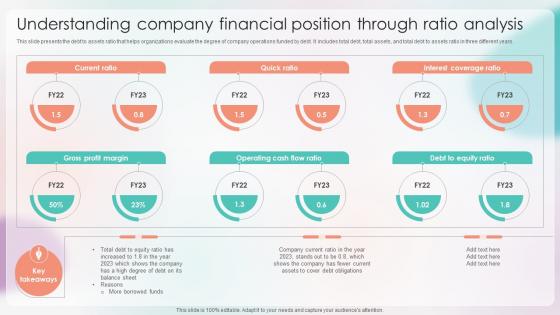
Strategies For Stabilizing Corporate Understanding Company Financial Position Through Ratio
This slide presents the debt to assets ratio that helps organizations evaluate the degree of company operations funded by debt. It includes total debt, total assets, and total debt to assets ratio in three different years. Do you know about Slidesgeeks Strategies For Stabilizing Corporate Understanding Company Financial Position Through Ratio These are perfect for delivering any kind od presentation. Using it, create PowerPoint presentations that communicate your ideas and engage audiences. Save time and effort by using our pre-designed presentation templates that are perfect for a wide range of topic. Our vast selection of designs covers a range of styles, from creative to business, and are all highly customizable and easy to edit. Download as a PowerPoint template or use them as Google Slides themes. This slide presents the debt to assets ratio that helps organizations evaluate the degree of company operations funded by debt. It includes total debt, total assets, and total debt to assets ratio in three different years.
Business Framework To Do List PowerPoint Presentation
This business framework power point diagram has been crafted with graphic of list. This list is can be used to show to do work. Use this PPT diagram for your business and work related presentations.
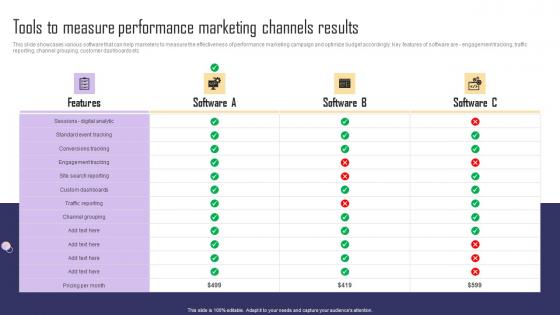
Tools To Measure Performance Marketing Channels Paid Internet Marketing Strategy Diagrams Pdf
This slide showcases various software that can help marketers to measure the effectiveness of performance marketing campaign and optimize budget accordingly. Key features of software are - engagement tracking, traffic reporting, channel grouping, customer dashboards etc. Slidegeeks is here to make your presentations a breeze with Tools To Measure Performance Marketing Channels Paid Internet Marketing Strategy Diagrams Pdf With our easy-to-use and customizable templates, you can focus on delivering your ideas rather than worrying about formatting. With a variety of designs to choose from, you are sure to find one that suits your needs. And with animations and unique photos, illustrations, and fonts, you can make your presentation pop. So whether you are giving a sales pitch or presenting to the board, make sure to check out Slidegeeks first. This slide showcases various software that can help marketers to measure the effectiveness of performance marketing campaign and optimize budget accordingly. Key features of software are - engagement tracking, traffic reporting, channel grouping, customer dashboards etc.
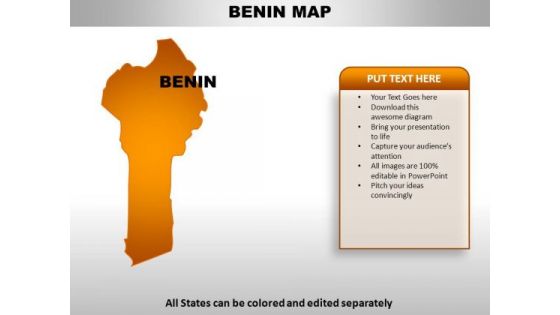
Binin PowerPoint Maps
Binin Country Powerpoint Maps-These high quality, editable powerpoint country maps have been carefully created by our professional team to display location and other geographic details in your PowerPoint presentation. Each map is vector based and is 100% editable in powerpoint. Each and every property of any region - color, size, shading etc can be modified to help you build an effective powerpoint presentation. Use these maps to show sales territories, business and new office locations, travel planning etc in your presentations. Any text can be entered at any point in the powerpoint map slide. Simply DOWNLOAD, TYPE and PRESENT! Transform your organization with our Binin PowerPoint Maps. Download without worries with our money back guaranteee.
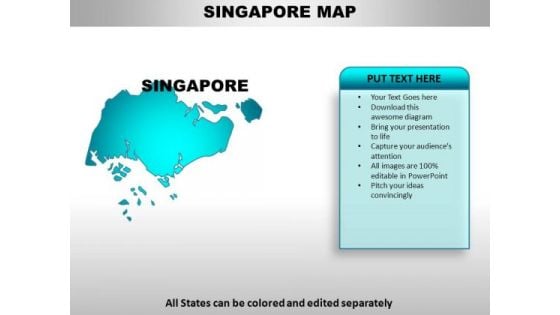
Singapore PowerPoint Maps
Singapore Country Powerpoint Maps-These high quality, editable powerpoint country maps have been carefully created by our professional team to display location and other geographic details in your PowerPoint presentation. Each map is vector based and is 100% editable in powerpoint. Each and every property of any region - color, size, shading etc can be modified to help you build an effective powerpoint presentation. Use these maps to show sales territories, business and new office locations, travel planning etc in your presentations. Any text can be entered at any point in the powerpoint map slide. Simply DOWNLOAD, TYPE and PRESENT! Restructure your organization with our Singapore PowerPoint Maps. Download without worries with our money back guaranteee.
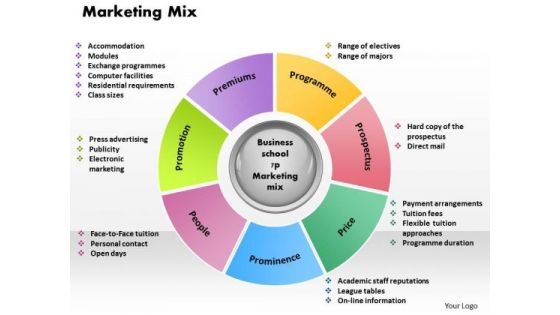
Business Framework Marketing Mix 2 PowerPoint Presentation
A multicolored and multistage circular process chart has been used to develop this business framework PPT. This template contains the concept of process flow for marketing strategy. Use this PPT and build a unique presentation for your viewers.
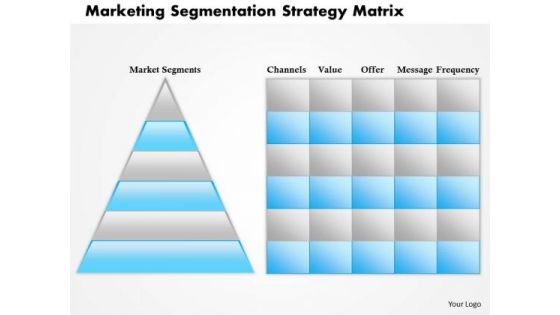
Business Framework Marketing Segmentation Strategy Matrix PowerPoint Presentation
Define marketing segmentation strategy with this business power point template. This power point template contains the graphic of triangle and matrix to display segmentation process. Use this PPT for marketing segmentation strategy and process related topics in any marketing presentation.
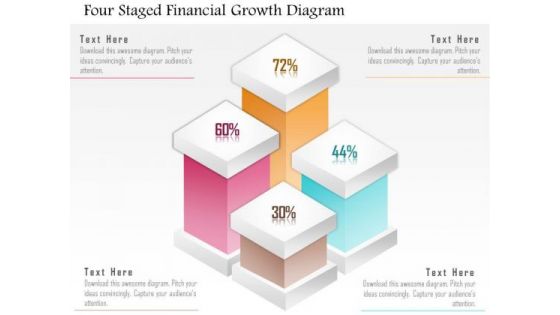
Business Diagram Four Staged Financial Growth Diagram Presentation Template
Our above slide displays four staged financial growth diagram. It helps to depict workflow or a process. This diagram offers a way for your audience to visually conceptualize the process.
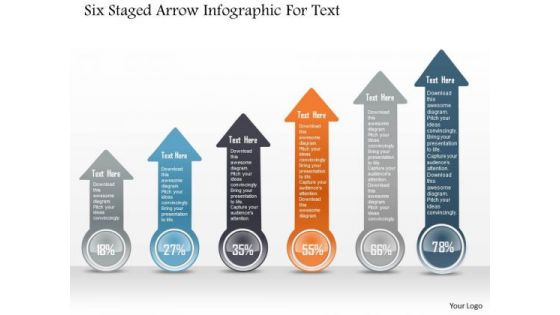
Business Diagram Six Staged Arrow Infographic For Text PowerPoint Template
Six staged colored arrow info graphics diagram has been used to craft this power point template. This PPT contains the concept of business process flow and information representation. Display any process flow in your presentation with this professional PPT slide.
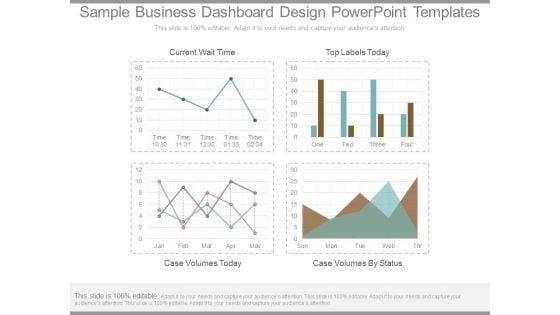
Sample Business Dashboard Design Powerpoint Templates
This is a sample business dashboard design powerpoint templates. This is a four stage process. The stages in this process are current wait time, top labels today, case volumes today, case volumes by status.
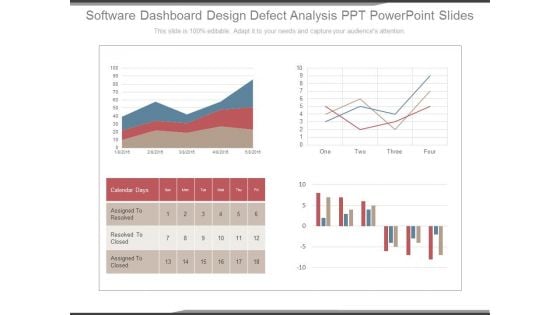
Software Dashboard Design Defect Analysis Ppt Powerpoint Slides
This is a software dashboard design defect analysis ppt powerpoint slides. This is a four stage process. The stages in this process are calendar days, assigned to resolved, resolved to closed, assigned to closed.
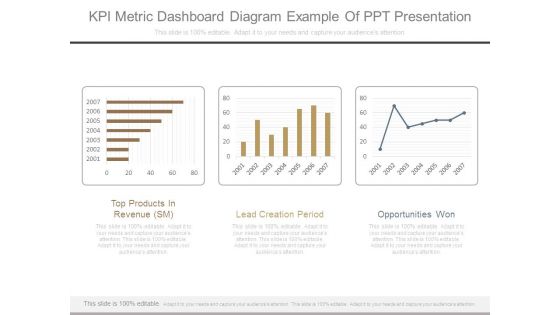
Kpi Metric Dashboard Diagram Example Of Ppt Presentation
This is a kpi metric dashboard diagram example of ppt presentation. This is a three stage process. The stages in this process are top products in revenue sm, lead creation period, opportunities won.
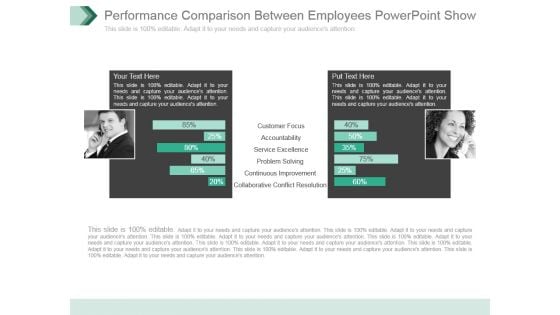
Performance Comparison Between Employees Powerpoint Show
This is a performance comparison between employees powerpoint show. This is a two stage process. The stages in this process are customer focus, accountability, service excellence, problem solving, continuous improvement, collaborative conflict resolution.
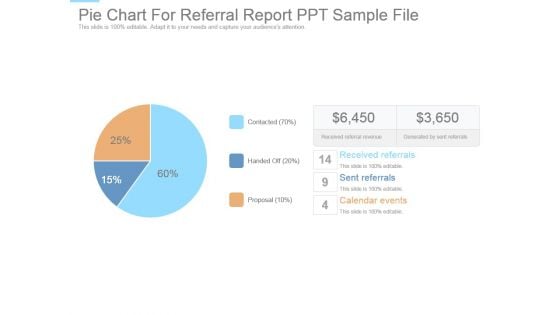
Pie Chart For Referral Report Ppt Sample File
This is a pie chart for referral report ppt sample file. This is a three stage process. The stages in this process are received referrals, sent referrals, calendar events, proposal, handed off, contacted, received referral revenue, generated by sent referrals.
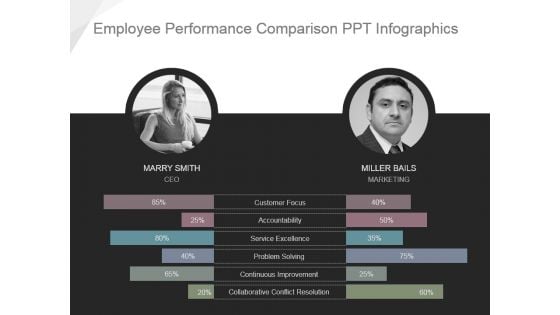
Employee Performance Comparison Ppt Infographics
This is a employee performance comparison ppt infographics. This is a two stage process. The stages in this process are customer focus, accountability, service excellence, problem solving, continuous improvement, collaborative conflict resolution.

Vision And Mission PowerPoint Presentation Complete Deck With Slides
This is a vision and mission powerpoint presentation complete deck with slides. This is a one stage process. The stages in this process are vision, mission, target, strategy, competition.
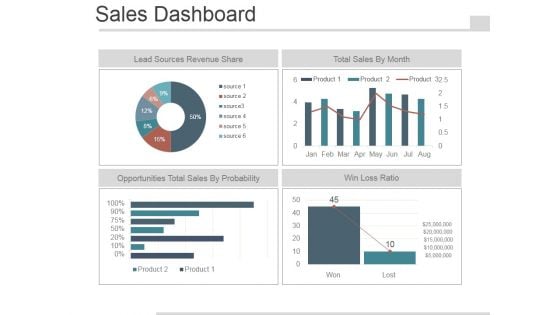
Sales Dashboard Slide Template 2 Ppt PowerPoint Presentation Images
This is a sales dashboard slide template 2 ppt powerpoint presentation images. This is a four stage process. The stages in this process are lead sources revenue share, total sales by month, opportunities total sales by probability, win loss ratio.

Marketing And Sales Strategy Business Plan Ppt PowerPoint Presentation Complete Deck With Slides
This is a marketing and sales strategy business plan ppt powerpoint presentation complete deck with slides. This is a one stage process. The stages in this process are sales, business, plan, marketing, strategy.

Company Marketing Analysis Report Ppt PowerPoint Presentation Complete Deck With Slides
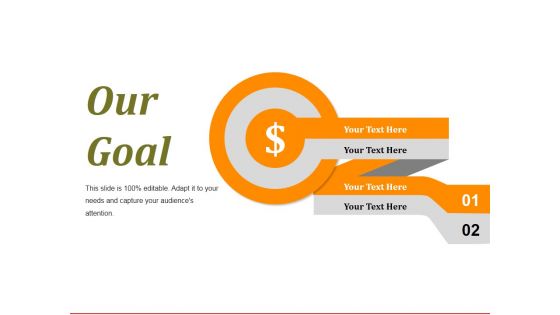
Our Goal Ppt PowerPoint Presentation Inspiration Clipart Images
This is a our goal ppt powerpoint presentation inspiration clipart images. This is a two stage process. The stages in this process are our goals, target, success, business, achievement.
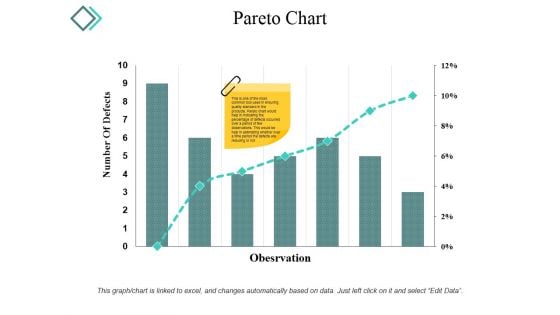
Pareto Chart Ppt PowerPoint Presentation Infographic Template Microsoft
This is a pareto chart ppt powerpoint presentation infographic template microsoft. This is a seven stage process. The stages in this process are number of defects, observation, graph, percentage, business.
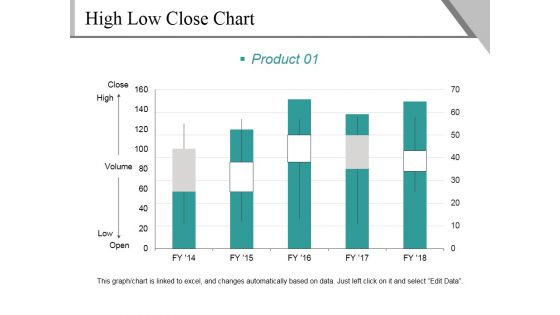
High Low Close Chart Template 1 Ppt PowerPoint Presentation Infographics Graphics Design
This is a high low close chart template 1 ppt powerpoint presentation infographics graphics design. This is a five stage process. The stages in this process are close, high, volume, low, open, product.
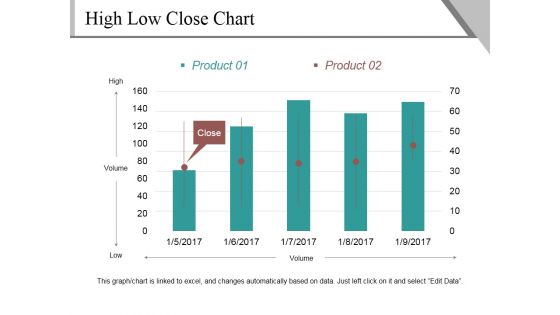
High Low Close Chart Template 2 Ppt PowerPoint Presentation Outline Show
This is a high low close chart template 2 ppt powerpoint presentation outline show. This is a five stage process. The stages in this process are high, volume, low, close, product.
Bar Chart Ppt PowerPoint Presentation Icon Demonstration
This is a bar chart ppt powerpoint presentation icon demonstration. This is a seven stage process. The stages in this process are product, sales in percentage, financial year, graph.
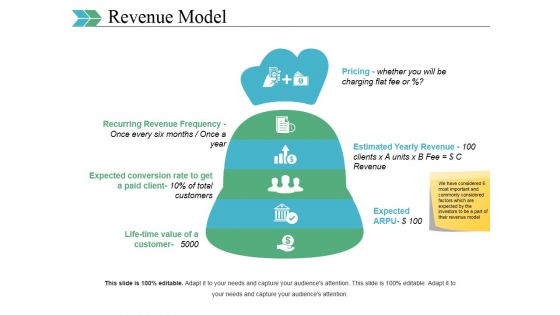
Revenue Model Ppt PowerPoint Presentation Layouts Graphics Tutorials
This is a revenue model ppt powerpoint presentation layouts graphics tutorials. This is a six stage process. The stages in this process are pricing, estimated yearly revenue, recurring revenue frequency, expected arpu.
Brand Tracking Info Graphics Ppt PowerPoint Presentation Infographics Slides
This is a brand tracking info graphics ppt powerpoint presentation infographics slides. This is a four stage process. The stages in this process are of consumers read, trust online reviews, user generated, look to online.
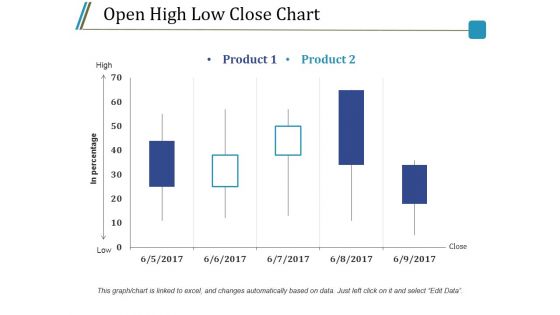
Open High Low Close Chart Ppt PowerPoint Presentation Styles Model
This is a open high low close chart ppt powerpoint presentation styles model. This is a five stage process. The stages in this process are product, high, low, in percentage, close.
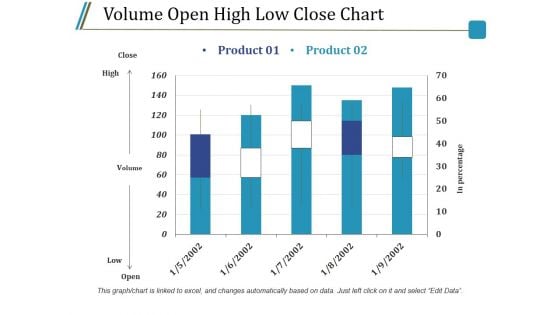
Volume Open High Low Close Chart Ppt PowerPoint Presentation Infographics Guide
This is a volume open high low close chart ppt powerpoint presentation infographics guide. This is a two stage process. The stages in this process are close, high, volume, low, open, product.
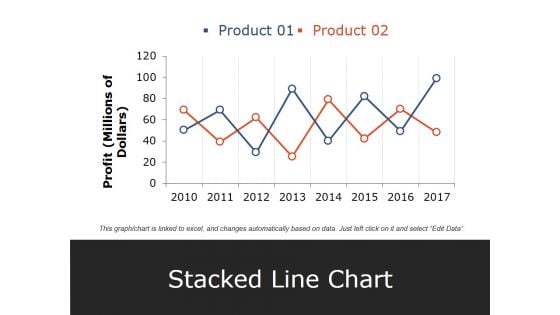
Stacked Line Chart Ppt PowerPoint Presentation Pictures Elements
This is a stacked line chart ppt powerpoint presentation pictures elements. This is a two stage process. The stages in this process are product, profit, stacked line chart, year, business.
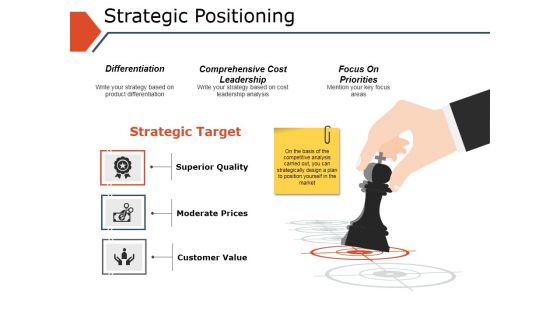
Strategic Positioning Ppt PowerPoint Presentation Model Portfolio
This is a strategic positioning ppt powerpoint presentation model portfolio. This is a three stage process. The stages in this process are superior quality, moderate prices, customer value, strategic target, differentiation.
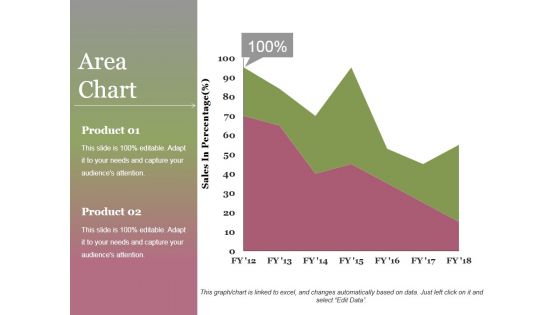
Area Chart Ppt PowerPoint Presentation Infographics File Formats
This is a area chart ppt powerpoint presentation infographics file formats. This is a two stage process. The stages in this process are area chart, product, sales in percentage, growth, success.
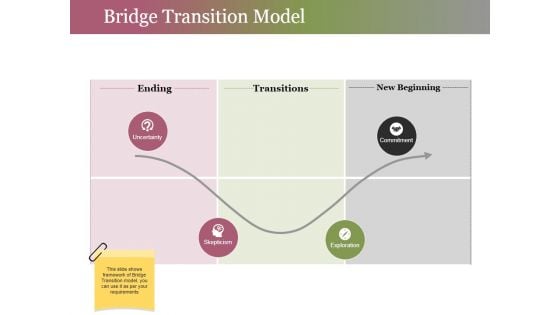
Bridge Transition Model Ppt PowerPoint Presentation Gallery Infographics
This is a bridge transition model ppt powerpoint presentation gallery infographics. This is a four stage process. The stages in this process are ending, transitions, new beginning, commitment, exploration.
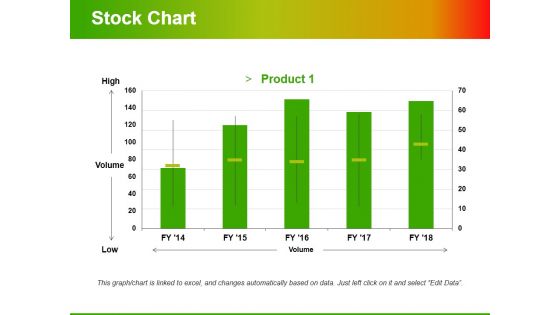
Stock Chart Template 2 Ppt PowerPoint Presentation Infographic Template Styles
This is a stock chart template 2 ppt powerpoint presentation infographic template styles. This is a one stage process. The stages in this process are high, volume, low, product, volume.

Key Metrics Ppt PowerPoint Presentation Professional Slideshow
This is a key metrics ppt powerpoint presentation professional slideshow. This is a five stage process. The stages in this process are new customers per month, on time delivery, customer satisfaction, lead conversion rate, customer retention rate.
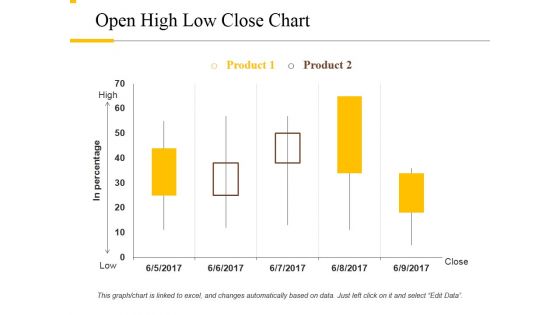
Open High Low Close Chart Ppt PowerPoint Presentation Outline Rules
This is a open high low close chart ppt powerpoint presentation outline rules. This is a two stage process. The stages in this process are product, high, low, close, in percentage.
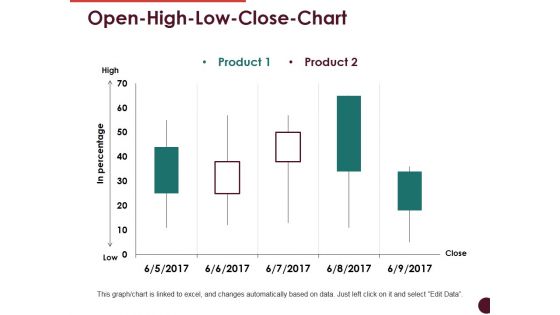
Open High Low Close Chart Ppt PowerPoint Presentation Professional Visuals
This is a open high low close chart ppt powerpoint presentation professional visuals. This is a two stage process. The stages in this process are high, low, in percentage, product, close.
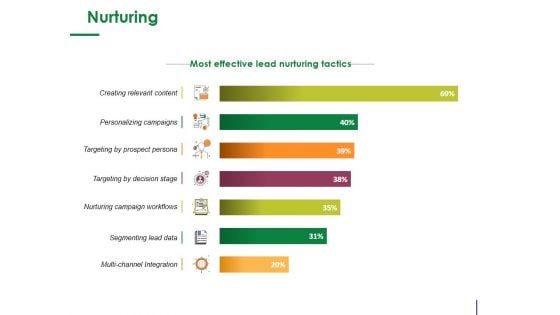
Nurturing Ppt PowerPoint Presentation Summary Images
This is a nurturing ppt powerpoint presentation summary images. This is a seven stage process. The stages in this process are segmenting lead data, creating relevant content, personalizing campaigns.
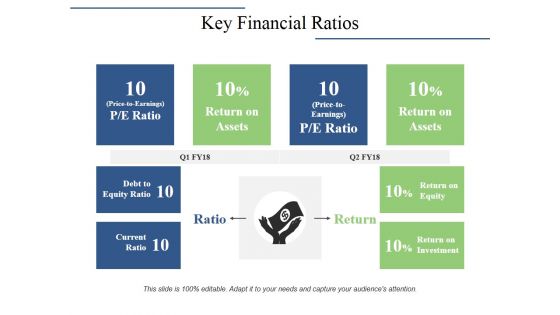
Key Financial Ratios Ppt PowerPoint Presentation Portfolio Background Image
This is a key financial ratios ppt powerpoint presentation portfolio background image. This is a four stage process. The stages in this process are debt to equity ratio, current ratio, return on assets, ratio, return.
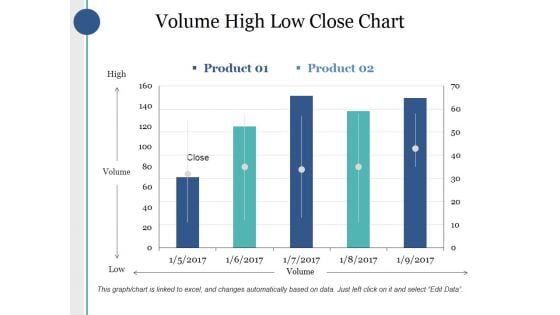
Volume High Low Close Chart Ppt PowerPoint Presentation Infographics Good
This is a volume high low close chart ppt powerpoint presentation infographics good. This is a two stage process. The stages in this process are high, volume, low, product, close.
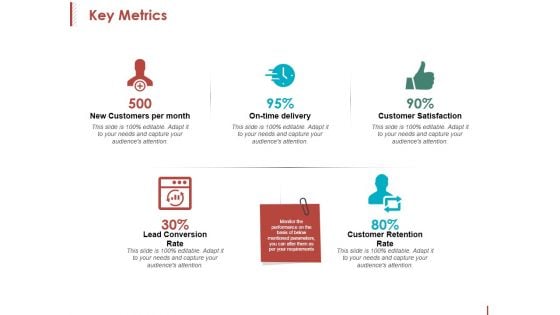
Key Metrics Ppt PowerPoint Presentation Inspiration Format
This is a key metrics ppt powerpoint presentation inspiration format. This is a five stage process. The stages in this process are new customers per month, on time delivery, customer satisfaction, customer retention rate.
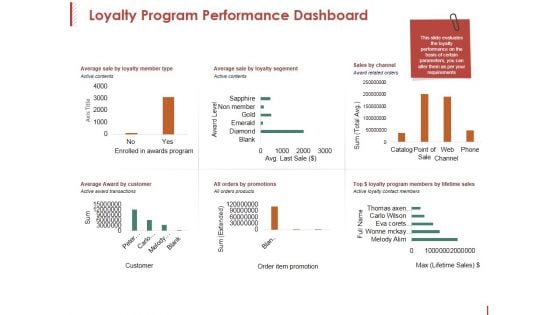
Loyalty Program Performance Dashboard Ppt PowerPoint Presentation Pictures Clipart
This is a loyalty program performance dashboard ppt powerpoint presentation pictures clipart. This is a six stage process. The stages in this process are axis title, award level, sum, active contents, channel.
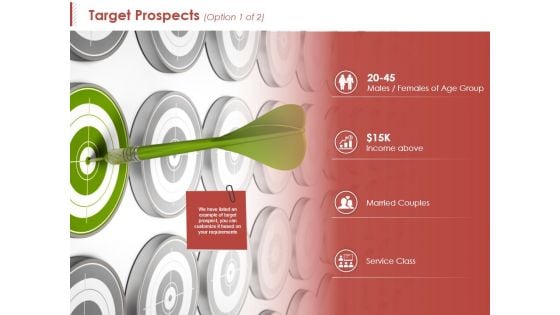
Target Prospects Template 1 Ppt PowerPoint Presentation Summary Portfolio
This is a target prospects template 1 ppt powerpoint presentation summary portfolio. This is a four stage process. The stages in this process are income above, married couples, service class, males, target prospects.
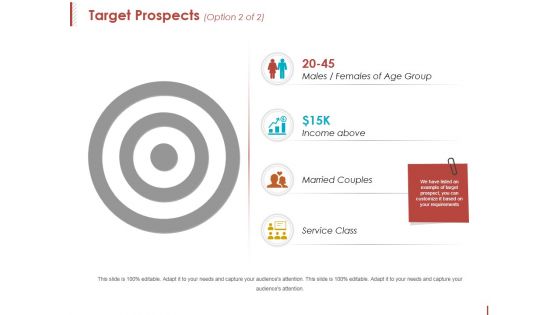
Target Prospects Template 2 Ppt PowerPoint Presentation Slides Templates
This is a target prospects template 2 ppt powerpoint presentation slides templates. This is a four stage process. The stages in this process are males, income above, married couples, service class.

Our Goal Ppt PowerPoint Presentation Outline Visual Aids
This is a our goal ppt powerpoint presentation outline visual aids. This is a three stage process. The stages in this process are focus on quality, commitment and dedication, reliability, icons, strategy.
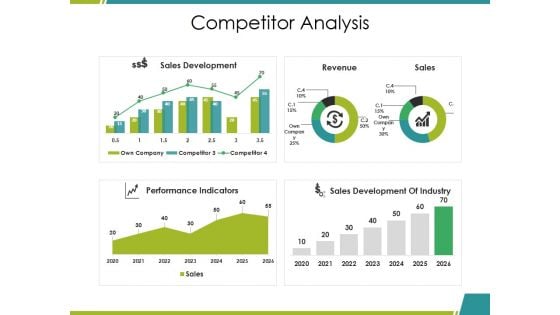
Competitor Analysis Ppt PowerPoint Presentation Inspiration Ideas
This is a competitor analysis ppt powerpoint presentation inspiration ideas. This is a four stage process. The stages in this process are sales development, performance indicators, revenue, sales, sales development of industry.
Sales Kpi Tracker Ppt PowerPoint Presentation Layout
This is a sales kpi tracker ppt powerpoint presentation layout. This is a six stage process. The stages in this process are leads created, sales ratio, opportunities won, top products in revenue, actual.
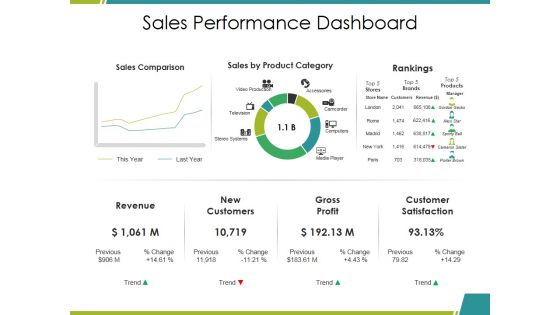
Sales Performance Dashboard Ppt PowerPoint Presentation Infographics Mockup
This is a sales performance dashboard ppt powerpoint presentation infographics mockup. This is a three stage process. The stages in this process are sales comparison, sales by product category, rankings, revenue, gross profit.
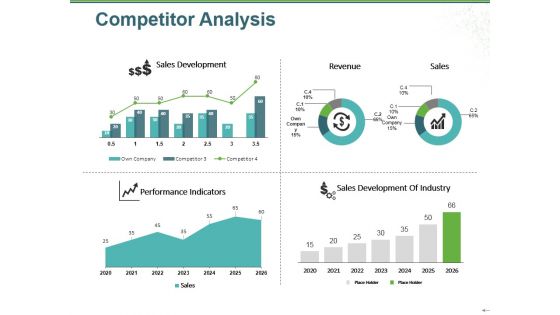
Competitor Analysis Ppt PowerPoint Presentation Pictures Visuals
This is a competitor analysis ppt powerpoint presentation pictures visuals. This is a four stage process. The stages in this process are sales development, performance indicators, sales development of industry, sales, revenue.
Highlights Ppt PowerPoint Presentation Icon Infographics
This is a highlights ppt powerpoint presentation icon infographics. This is a five stage process. The stages in this process are countries, stores worldwide, total revenue, associates, monthly website visitors.
Our Main Goal Ppt PowerPoint Presentation Pictures Background
This is a our main goal ppt powerpoint presentation pictures background. This is a one stage process. The stages in this process are our goals, target, success, business, achievement.
Sales Kpi Tracker Ppt PowerPoint Presentation Gallery Shapes
This is a sales kpi tracker ppt powerpoint presentation gallery shapes. This is a six stage process. The stages in this process are target growth, leads created, sales ratio, last year, stretched growth.
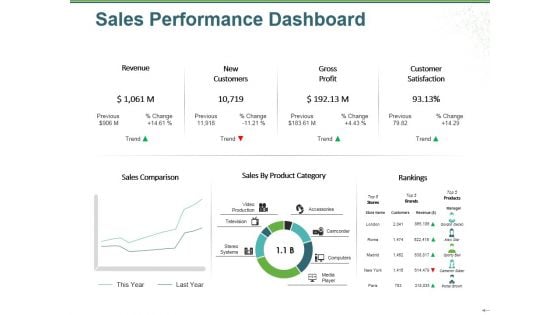
Sales Performance Dashboard Ppt PowerPoint Presentation Outline File Formats
This is a sales performance dashboard ppt powerpoint presentation outline file formats. This is a three stage process. The stages in this process are revenue, new customers, gross profit, customer satisfaction, rankings.
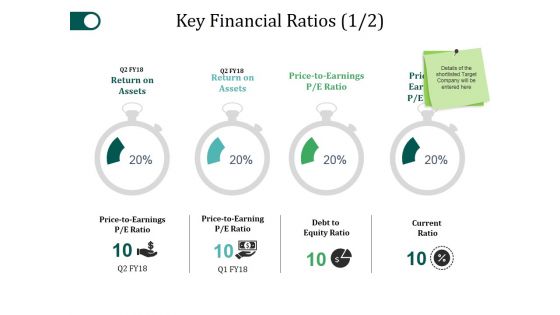
Key Financial Ratios Template 1 Ppt PowerPoint Presentation Layouts Pictures
This is a key financial ratios template 1 ppt powerpoint presentation layouts pictures. This is a four stage process. The stages in this process are return on assets, debt to equity ratio, current ratio, price to earnings.
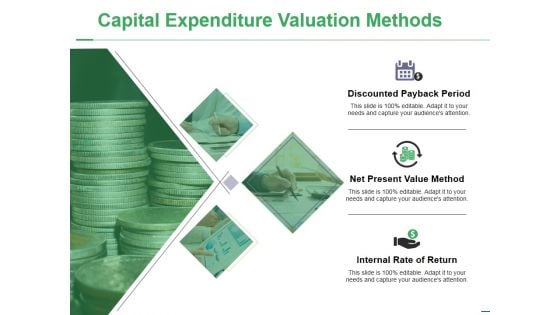
Capital Expenditure Valuation Methods Ppt PowerPoint Presentation File Background Images
This is a capital expenditure valuation methods ppt powerpoint presentation file background images. This is a three stage process. The stages in this process are discounted payback period, net present value method, internal rate of return.
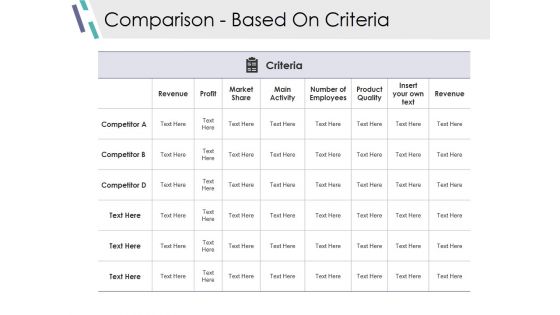
Comparison Based On Criteria Ppt PowerPoint Presentation Show Outline
This is a comparison based on criteria ppt powerpoint presentation show outline. This is a six stage process. The stages in this process are revenue, profit, market share, main activity, number of employees.
Competitive Analysis Module Ppt PowerPoint Presentation Complete Deck With Slides
This is a competitive analysis module ppt powerpoint presentation complete deck with slides. This is a one stage process. The stages in this process are competition, analysis, marketing, strategy, business.
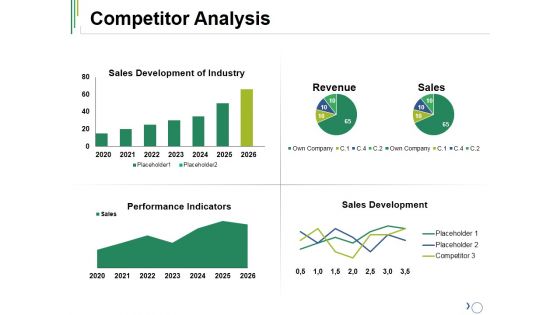
Competitor Analysis Ppt PowerPoint Presentation File Influencers
This is a competitor analysis ppt powerpoint presentation file influencers. This is a four stage process. The stages in this process are revenue, sales, placeholder, performance indicators, sales development.
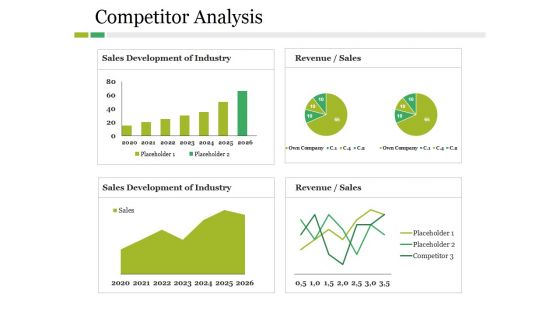
Competitor Analysis Ppt PowerPoint Presentation File Graphics Example
This is a competitor analysis ppt powerpoint presentation file graphics example. This is a four stage process. The stages in this process are revenue, sales development of industry, own company, placeholder, competitor.
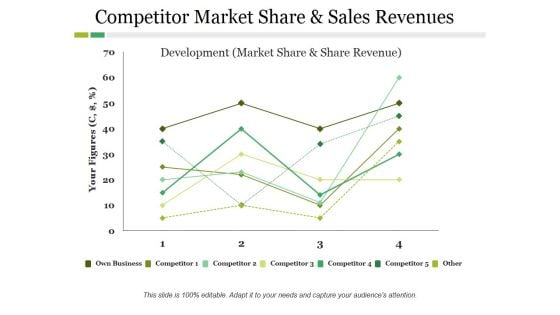
Competitor Market Share And Sales Revenues Ppt PowerPoint Presentation Ideas Slide
This is a competitor market share and sales revenues ppt powerpoint presentation ideas slide. This is a four stage process. The stages in this process are competitor, development, own business, your figures.


 Continue with Email

 Home
Home


