Resource Plan
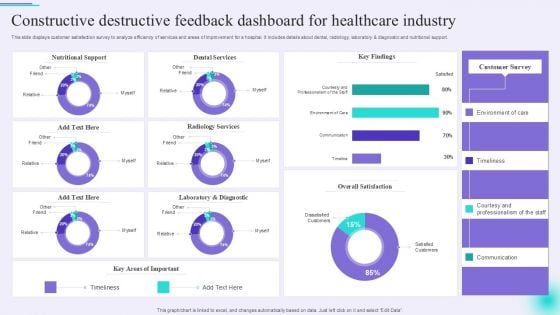
Constructive Destructive Feedback Dashboard For Healthcare Industry Guidelines PDF
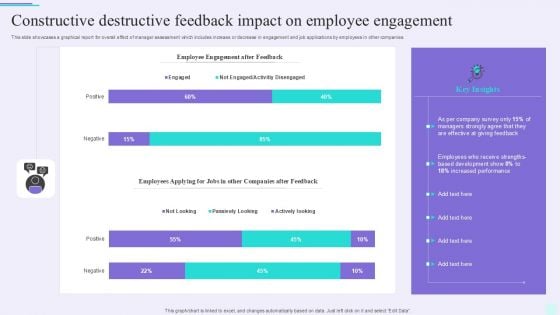
Constructive Destructive Feedback Impact On Employee Engagement Pictures PDF
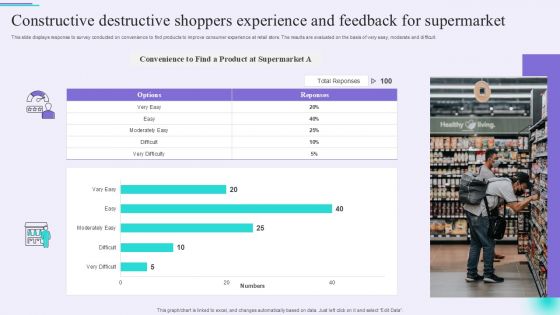
Constructive Destructive Shoppers Experience And Feedback For Supermarket Clipart PDF
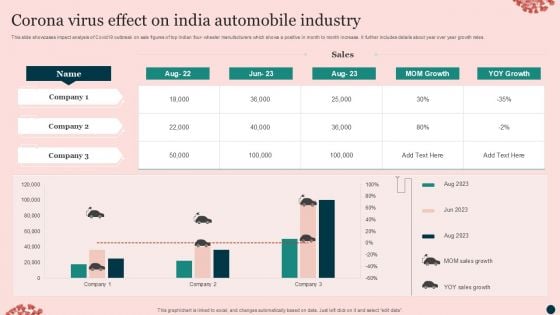
Corona Virus Effect On India Automobile Industry Introduction PDF
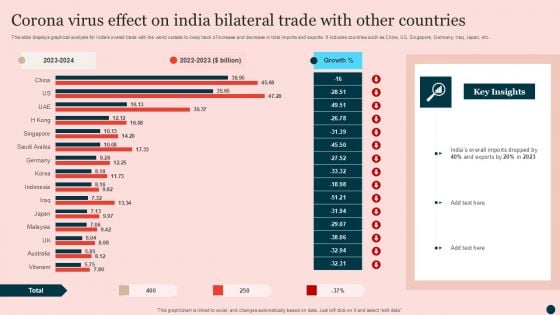
Corona Virus Effect On India Bilateral Trade With Other Countries Pictures PDF

Corona Virus Effect On India Construction And Real Estate Industry Mockup PDF

Corona Virus Effect On India Education Sector With Challenges Faced By Teachers Icons PDF
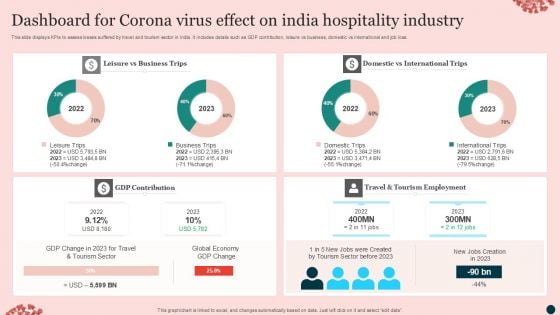
Dashboard For Corona Virus Effect On India Hospitality Industry Download PDF
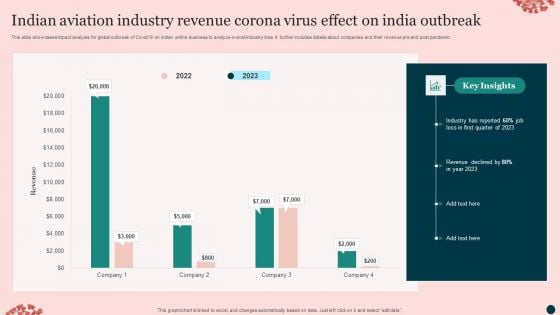
Indian Aviation Industry Revenue Corona Virus Effect On India Outbreak Clipart PDF
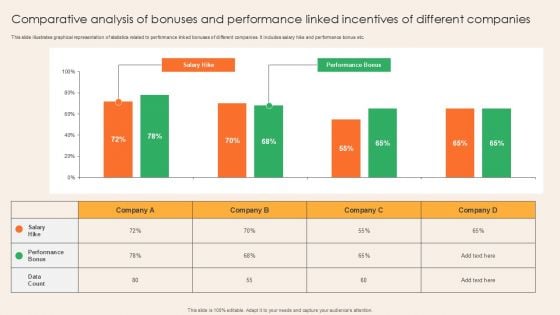
Comparative Analysis Of Bonuses And Performance Linked Incentives Of Different Companies Demonstration PDF
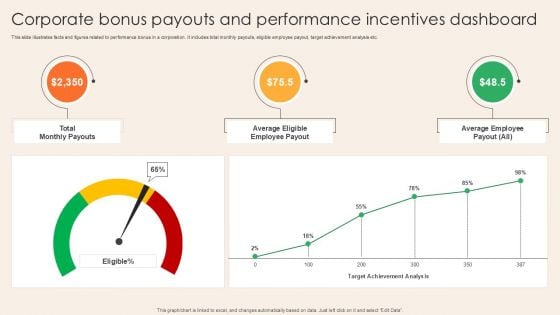
Corporate Bonus Payouts And Performance Incentives Dashboard Mockup PDF
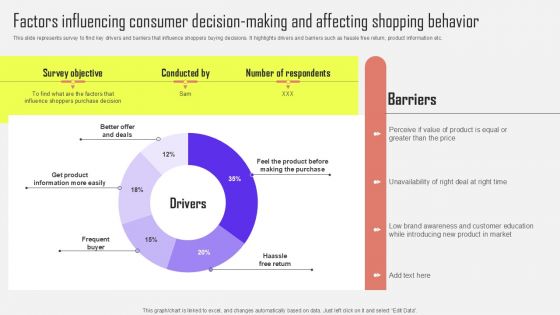
Factors Influencing Consumer Decision Making Optimizing Customer Purchase Experience By Executi Rules PDF
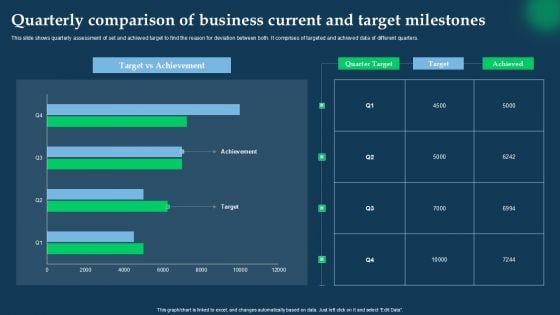
Quarterly Comparison Of Business Current And Target Milestones Themes PDF
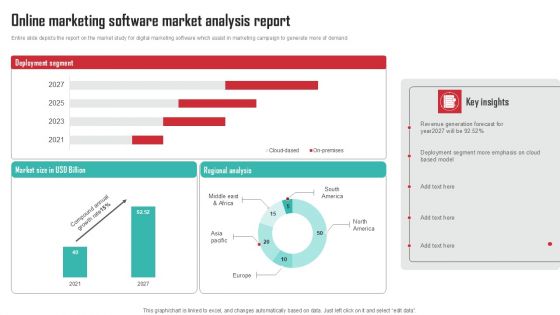
Online Marketing Software Market Analysis Report Portrait PDF
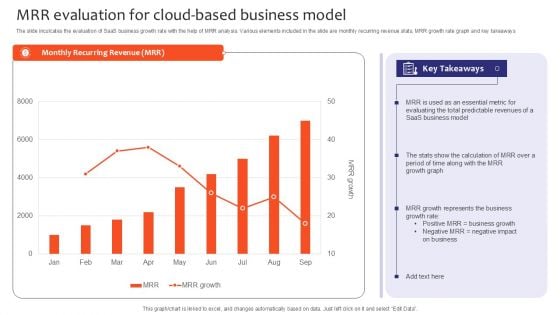
MRR Evaluation For Cloud Based Business Model Slides PDF
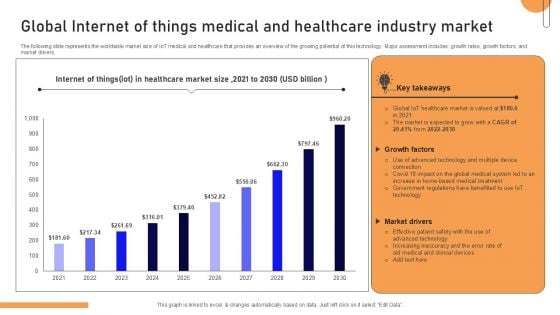
Global Internet Of Things Medical And Healthcare Industry Market Summary PDF
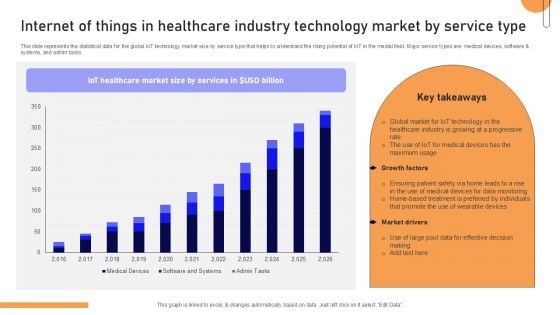
Internet Of Things In Healthcare Industry Technology Market By Service Type Background PDF
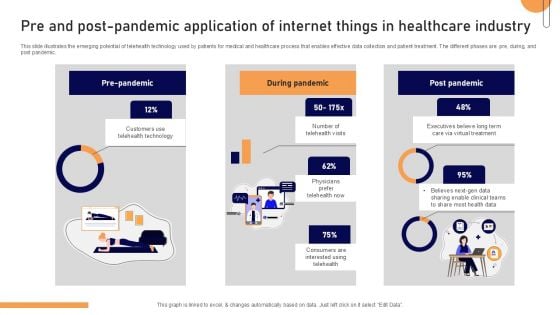
Pre And Post Pandemic Application Of Internet Things In Healthcare Industry Ideas PDF
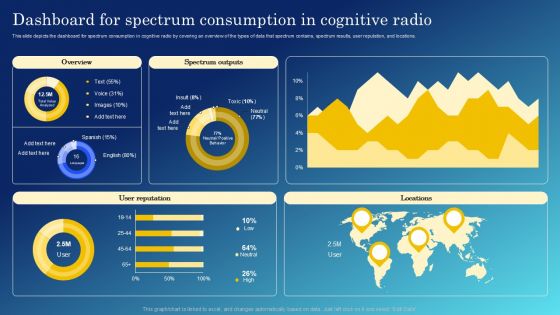
Cognitive Sensing Innovation Dashboard For Spectrum Consumption In Cognitive Radio Brochure PDF
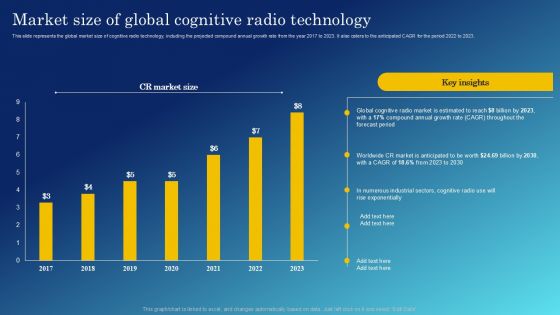
Cognitive Sensing Innovation Market Size Of Global Cognitive Radio Technology Topics PDF
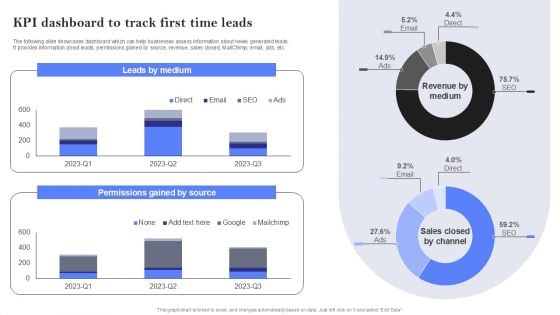
KPI Dashboard To Track First Time Leads Ppt PowerPoint Presentation File Pictures PDF
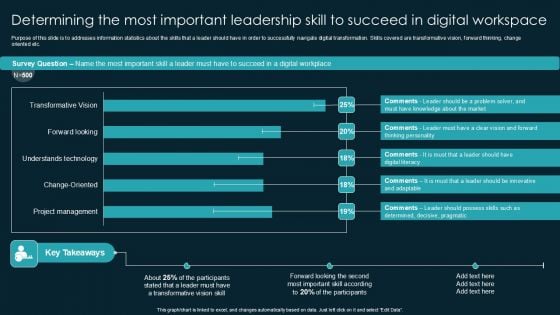
Determining The Most Important Leadership Skill To Succeed In Digital Workspace Topics PDF
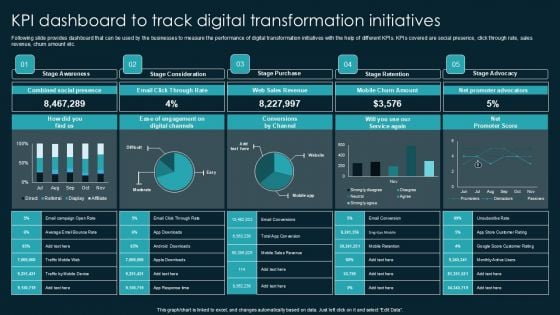
Kpi Dashboard To Track Digital Transformation Initiatives Formats PDF
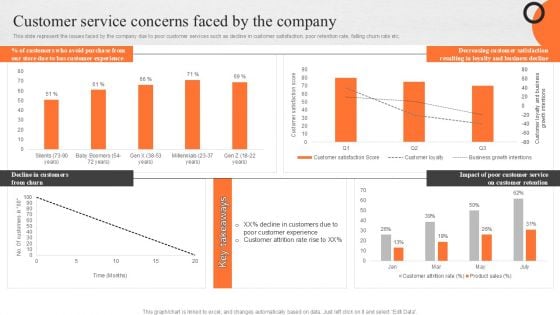
Enhancing Buyer Journey Customer Service Concerns Faced By The Company Introduction PDF
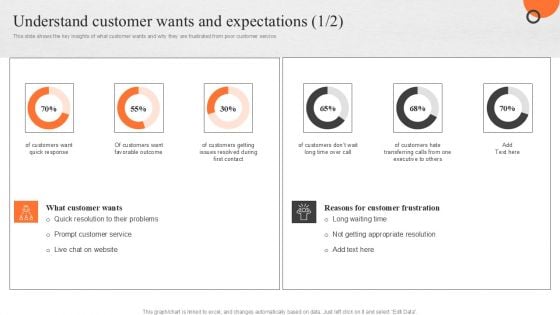
Enhancing Buyer Journey Understand Customer Wants And Expectations Themes PDF
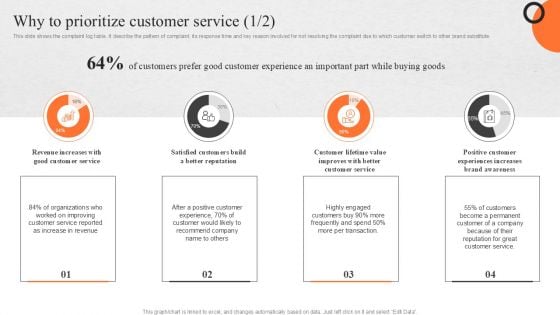
Enhancing Buyer Journey Why To Prioritize Customer Service Sample PDF
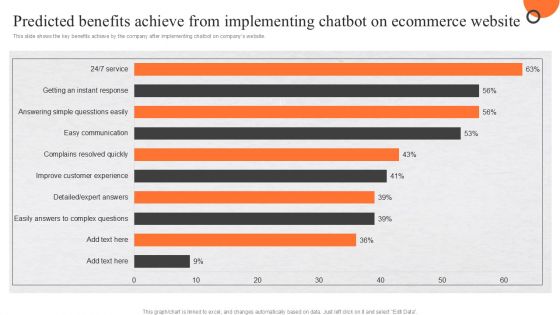
Predicted Benefits Achieve From Implementing Chatbot On Ecommerce Website Background PDF
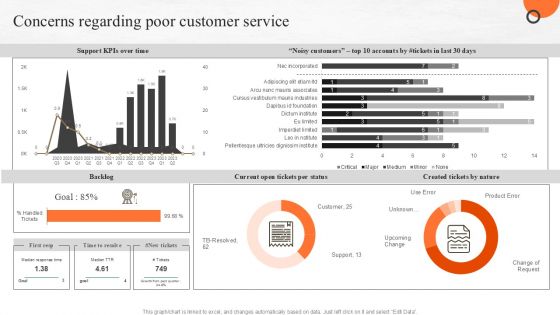
Concerns Regarding Poor Customer Service Ppt PowerPoint Presentation Diagram Images PDF
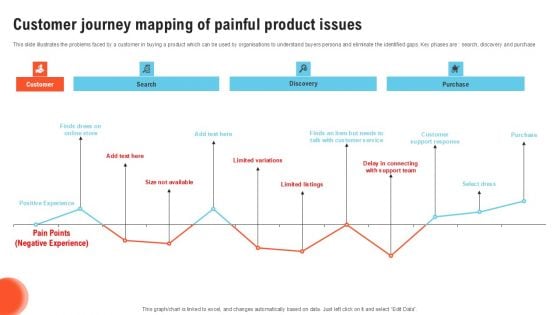
Customer Journey Mapping Of Painful Product Issues Portrait PDF
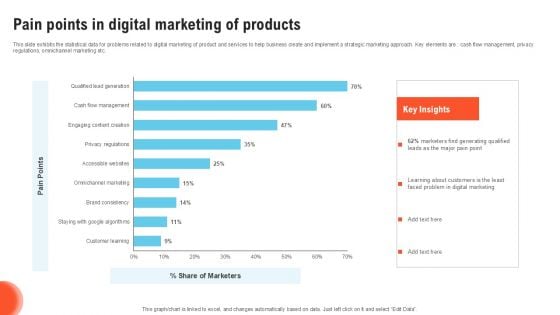
Pain Points In Digital Marketing Of Products Graphics PDF
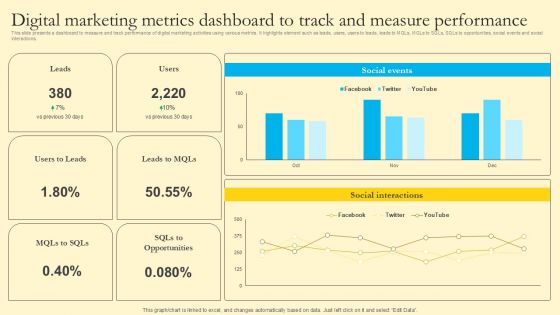
Comprehensive Guide For Sales And Advertising Processes Digital Marketing Metrics Dashboard To Track Measure Clipart PDF
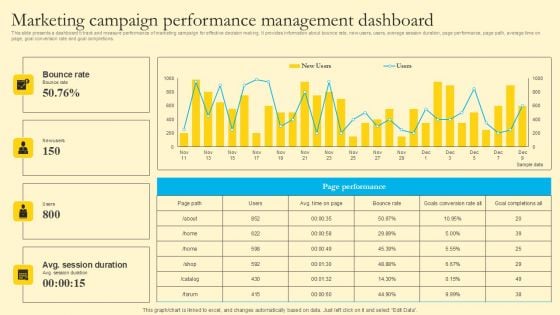
Comprehensive Guide For Sales And Advertising Processes Marketing Campaign Performance Management Graphics PDF
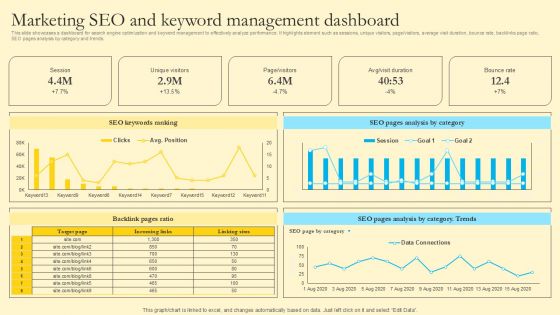
Comprehensive Guide For Sales And Advertising Processes Marketing SEO And Keyword Management Dashboard Pictures PDF
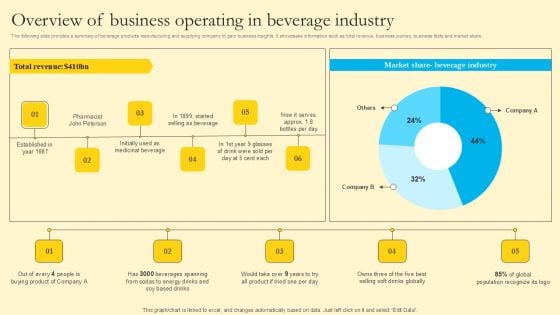
Comprehensive Guide For Sales And Advertising Processes Overview Of Business Operating In Beverage Industry Clipart PDF
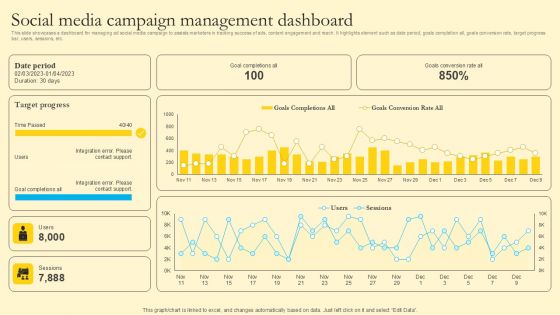
Comprehensive Guide For Sales And Advertising Processes Social Media Campaign Management Dashboard Formats PDF
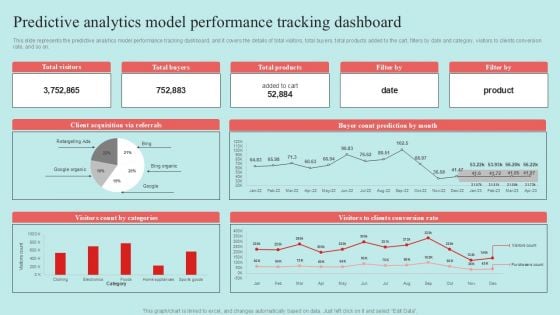
Predictive Data Model Predictive Analytics Model Performance Tracking Dashboard Themes PDF
Enterprise Product And Service Overview Icon Pictures PDF
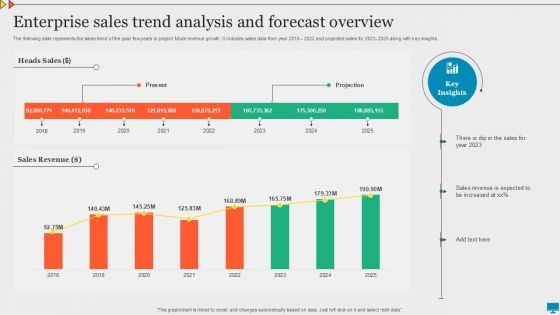
Enterprise Sales Trend Analysis And Forecast Overview Summary PDF
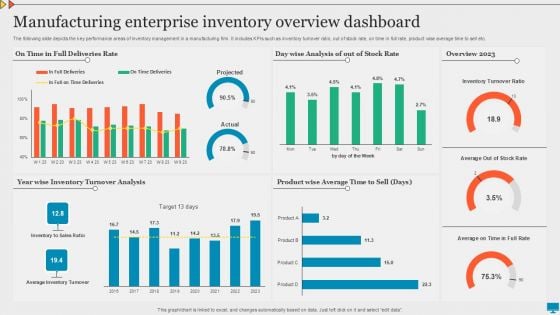
Manufacturing Enterprise Inventory Overview Dashboard Graphics PDF
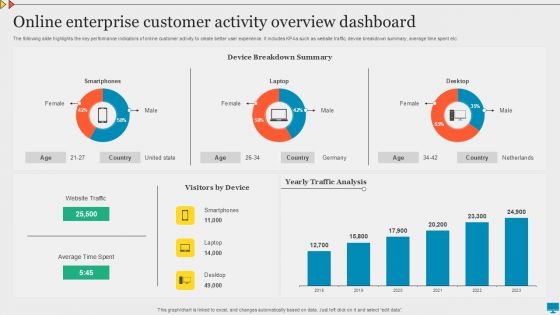
Online Enterprise Customer Activity Overview Dashboard Download PDF
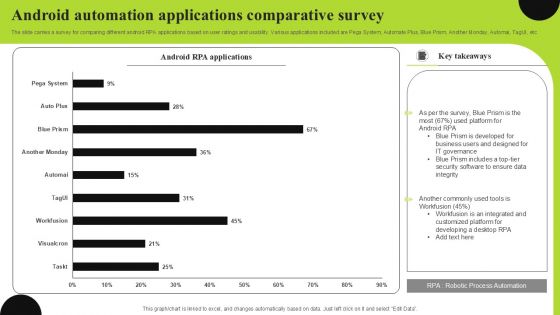
Android Automation Applications Comparative Survey Pictures PDF
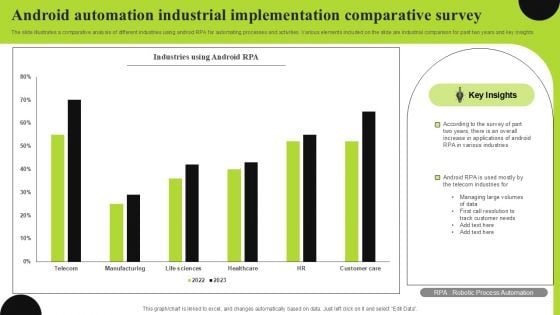
Android Automation Industrial Implementation Comparative Survey Formats PDF
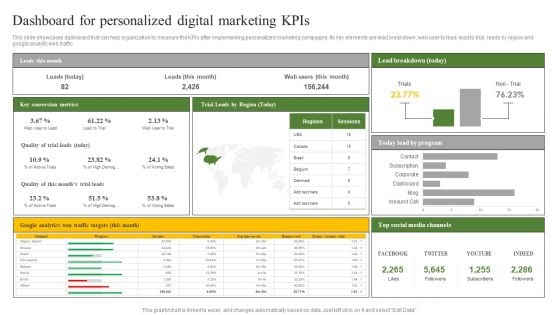
Dashboard For Personalized Digital Marketing Kpis Ppt Background Designs PDF
This slide showcases dashboard that can help organization to measure the KPIs after implementing personalized marketing campaigns. Its key elements are lead breakdown, web user to lead, lead to trial, leads by region and google analytic web traffic. Presenting this PowerPoint presentation, titled Dashboard For Personalized Digital Marketing Kpis Ppt Background Designs PDF, with topics curated by our researchers after extensive research. This editable presentation is available for immediate download and provides attractive features when used. Download now and captivate your audience. Presenting this Dashboard For Personalized Digital Marketing Kpis Ppt Background Designs PDF. Our researchers have carefully researched and created these slides with all aspects taken into consideration. This is a completely customizable Dashboard For Personalized Digital Marketing Kpis Ppt Background Designs PDF that is available for immediate downloading. Download now and make an impact on your audience. Highlight the attractive features available with our PPTs.
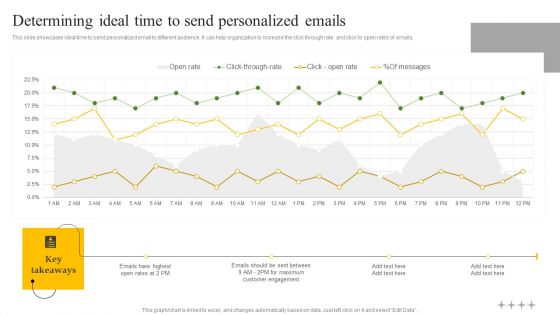
Determining Ideal Time To Send Personalized Emails Ppt Styles Outfit PDF
This slide showcases ideal time to send personalized email to different audience. It can help organization to increase the click through rate and click to open rates of emails. Here you can discover an assortment of the finest PowerPoint and Google Slides templates. With these templates, you can create presentations for a variety of purposes while simultaneously providing your audience with an eye catching visual experience. Download Determining Ideal Time To Send Personalized Emails Ppt Styles Outfit PDF to deliver an impeccable presentation. These templates will make your job of preparing presentations much quicker, yet still, maintain a high level of quality. Slidegeeks has experienced researchers who prepare these templates and write high quality content for you. Later on, you can personalize the content by editing the Determining Ideal Time To Send Personalized Emails Ppt Styles Outfit PDF.
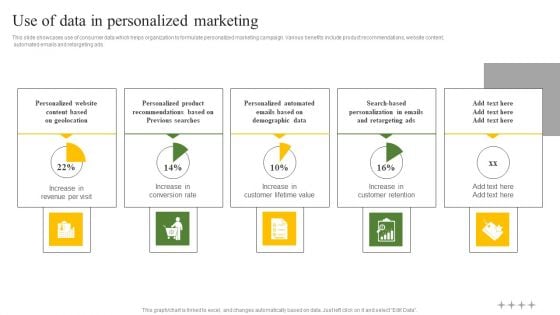
Use Of Data In Personalized Marketing Ppt Show Summary PDF
This slide showcases use of consumer data which helps organization to formulate personalized marketing campaign. Various benefits include product recommendations, website content, automated emails and retargeting ads. Are you in need of a template that can accommodate all of your creative concepts This one is crafted professionally and can be altered to fit any style. Use it with Google Slides or PowerPoint. Include striking photographs, symbols, depictions, and other visuals. Fill, move around, or remove text boxes as desired. Test out color palettes and font mixtures. Edit and save your work, or work with colleagues. Download Use Of Data In Personalized Marketing Ppt Show Summary PDF and observe how to make your presentation outstanding. Give an impeccable presentation to your group and make your presentation unforgettable.
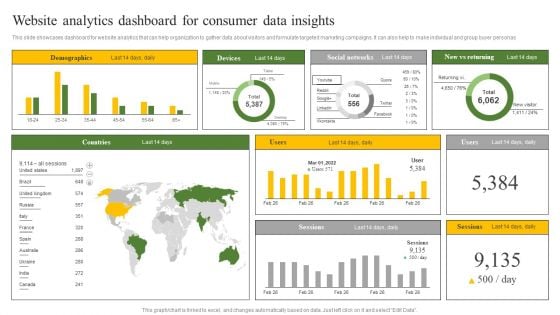
Website Analytics Dashboard For Consumer Data Insights Ppt Infographic Template Samples PDF
This slide showcases dashboard for website analytics that can help organization to gather data about visitors and formulate targeted marketing campaigns. It can also help to make individual and group buyer personas. Crafting an eye catching presentation has never been more straightforward. Let your presentation shine with this tasteful yet straightforward Website Analytics Dashboard For Consumer Data Insights Ppt Infographic Template Samples PDF template. It offers a minimalistic and classy look that is great for making a statement. The colors have been employed intelligently to add a bit of playfulness while still remaining professional. Construct the ideal Website Analytics Dashboard For Consumer Data Insights Ppt Infographic Template Samples PDF that effortlessly grabs the attention of your audience Begin now and be certain to wow your customers.
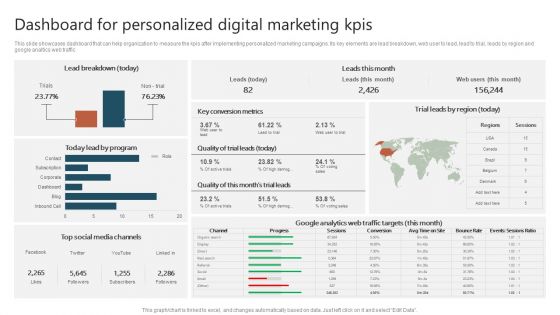
Dashboard For Personalized Digital Marketing Kpis Ppt File Layouts PDF
This slide showcases dashboard that can help organization to measure the KPIs after implementing personalized marketing campaigns. Its key elements are lead breakdown, web user to lead, lead to trial, leads by region and google analytic web traffic. Presenting this PowerPoint presentation, titled Dashboard For Personalized Digital Marketing Kpis Ppt File Layouts PDF, with topics curated by our researchers after extensive research. This editable presentation is available for immediate download and provides attractive features when used. Download now and captivate your audience. Presenting this Dashboard For Personalized Digital Marketing Kpis Ppt File Layouts PDF. Our researchers have carefully researched and created these slides with all aspects taken into consideration. This is a completely customizable Dashboard For Personalized Digital Marketing Kpis Ppt File Layouts PDF that is available for immediate downloading. Download now and make an impact on your audience. Highlight the attractive features available with our PPTs.
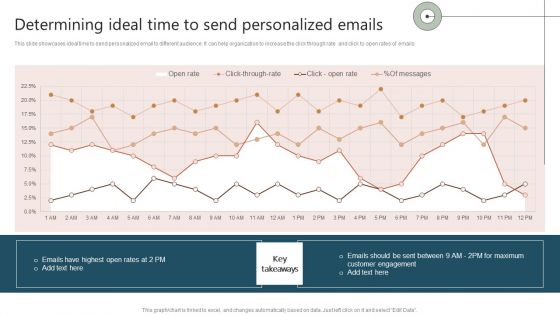
Determining Ideal Time To Send Personalized Emails Ppt Styles Example File PDF
This slide showcases ideal time to send personalized email to different audience. It can help organization to increase the click through rate and click to open rates of emails. Here you can discover an assortment of the finest PowerPoint and Google Slides templates. With these templates, you can create presentations for a variety of purposes while simultaneously providing your audience with an eye catching visual experience. Download Determining Ideal Time To Send Personalized Emails Ppt Styles Example File PDF to deliver an impeccable presentation. These templates will make your job of preparing presentations much quicker, yet still, maintain a high level of quality. Slidegeeks has experienced researchers who prepare these templates and write high quality content for you. Later on, you can personalize the content by editing the Determining Ideal Time To Send Personalized Emails Ppt Styles Example File PDF.
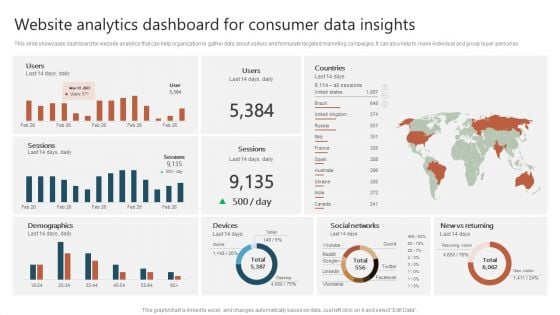
Website Analytics Dashboard For Consumer Data Insights Ppt Show Graphics Download PDF
This slide showcases dashboard for website analytics that can help organization to gather data about visitors and formulate targeted marketing campaigns. It can also help to make individual and group buyer personas. Crafting an eye catching presentation has never been more straightforward. Let your presentation shine with this tasteful yet straightforward Website Analytics Dashboard For Consumer Data Insights Ppt Show Graphics Download PDF template. It offers a minimalistic and classy look that is great for making a statement. The colors have been employed intelligently to add a bit of playfulness while still remaining professional. Construct the ideal Website Analytics Dashboard For Consumer Data Insights Ppt Show Graphics Download PDF that effortlessly grabs the attention of your audience Begin now and be certain to wow your customers.
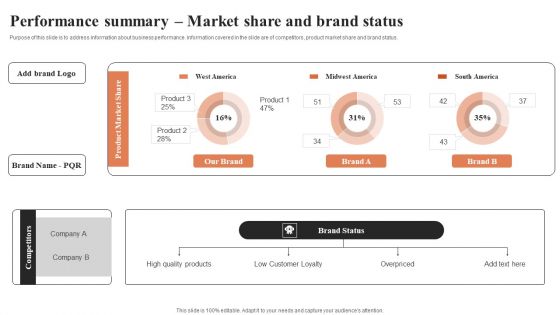
Performance Summary Market Share And Brand Status Ppt Pictures Brochure PDF
Purpose of this slide is to address information about business performance. Information covered in the slide are of competitors, product market share and brand status. Are you in need of a template that can accommodate all of your creative concepts This one is crafted professionally and can be altered to fit any style. Use it with Google Slides or PowerPoint. Include striking photographs, symbols, depictions, and other visuals. Fill, move around, or remove text boxes as desired. Test out color palettes and font mixtures. Edit and save your work, or work with colleagues. Download Performance Summary Market Share And Brand Status Ppt Pictures Brochure PDF and observe how to make your presentation outstanding. Give an impeccable presentation to your group and make your presentation unforgettable.
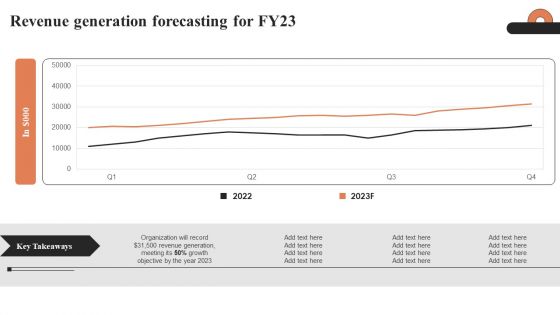
Revenue Generation Forecasting For Fy23 Ppt Portfolio Gallery PDF
Coming up with a presentation necessitates that the majority of the effort goes into the content and the message you intend to convey. The visuals of a PowerPoint presentation can only be effective if it supplements and supports the story that is being told. Keeping this in mind our experts created Revenue Generation Forecasting For Fy23 Ppt Portfolio Gallery PDF to reduce the time that goes into designing the presentation. This way, you can concentrate on the message while our designers take care of providing you with the right template for the situation.
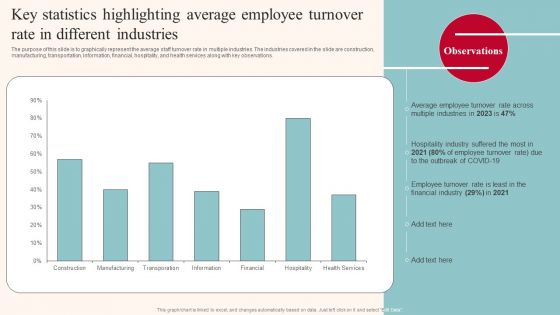
Key Statistics Highlighting Average Employee Turnover Rate In Different Industries Infographics PDF
The purpose of this slide is to graphically represent the average staff turnover rate in multiple industries. The industries covered in the slide are construction, manufacturing, transportation, information, financial, hospitality, and health services along with key observations. Want to ace your presentation in front of a live audience Our Key Statistics Highlighting Average Employee Turnover Rate In Different Industries Infographics PDF can help you do that by engaging all the users towards you. Slidegeeks experts have put their efforts and expertise into creating these impeccable powerpoint presentations so that you can communicate your ideas clearly. Moreover, all the templates are customizable, and easy to edit and downloadable. Use these for both personal and commercial use.
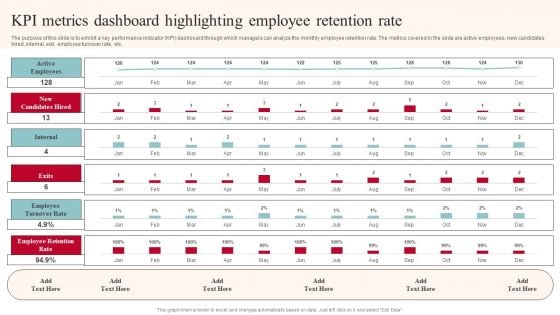
KPI Metrics Dashboard Highlighting Employee Retention Rate Structure PDF
The purpose of this slide is to exhibit a key performance indicator KPI dashboard through which managers can analyze the monthly employee retention rate. The metrics covered in the slide are active employees, new candidates hired, internal, exit, employee turnover rate, etc. Do you have to make sure that everyone on your team knows about any specific topic I yes, then you should give KPI Metrics Dashboard Highlighting Employee Retention Rate Structure PDF a try. Our experts have put a lot of knowledge and effort into creating this impeccable KPI Metrics Dashboard Highlighting Employee Retention Rate Structure PDF. You can use this template for your upcoming presentations, as the slides are perfect to represent even the tiniest detail. You can download these templates from the Slidegeeks website and these are easy to edit. So grab these today.
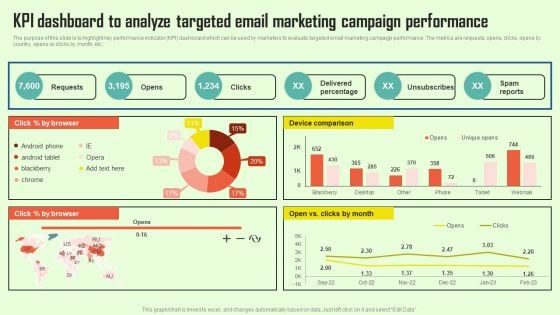
Increasing Consumer Engagement With Database KPI Dashboard To Analyze Targeted Email Infographics PDF
The purpose of this slide is to highlight key performance indicator KPI dashboard which can be used by marketers to evaluate targeted email marketing campaign performance. The metrics are requests, opens, clicks, opens by country, opens vs clicks by month, etc. This modern and well arranged Increasing Consumer Engagement With Database KPI Dashboard To Analyze Targeted Email Infographics PDF provides lots of creative possibilities. It is very simple to customize and edit with the Powerpoint Software. Just drag and drop your pictures into the shapes. All facets of this template can be edited with Powerpoint no extra software is necessary. Add your own material, put your images in the places assigned for them, adjust the colors, and then you can show your slides to the world, with an animated slide included.
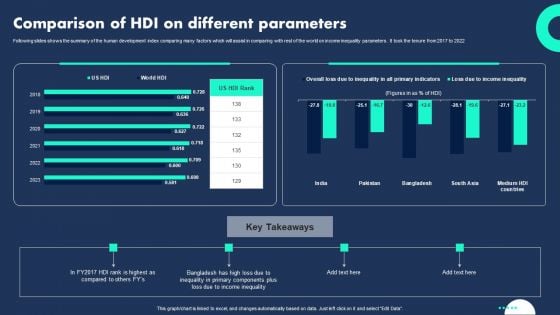
Comparison Of HDI On Different Parameters Diagrams PDF
Following slides shows the summary of the human development index comparing many factors which will assist in comparing with rest of the world on income inequality parameters . It took the tenure from 2017 to 2022. Showcasing this set of slides titled Comparison Of HDI On Different Parameters Diagrams PDF. The topics addressed in these templates are Inequality Primary Components, Plus Loss Income Inequality, Different Parameters . All the content presented in this PPT design is completely editable. Download it and make adjustments in color, background, font etc. as per your unique business setting.
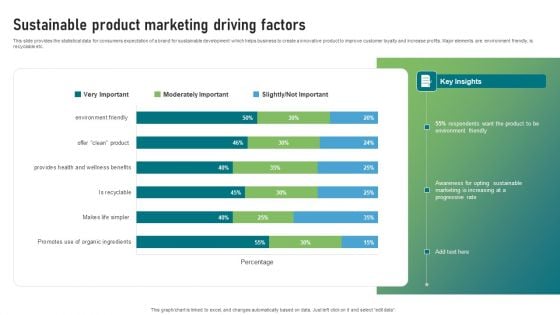
Sustainable Product Marketing Driving Factors Clipart PDF
This slide provides the statistical data for consumers expectation of a brand for sustainable development which helps business to create a innovative product to improve customer loyalty and increase profits. Major elements are environment friendly, is recyclable etc. Showcasing this set of slides titled Sustainable Product Marketing Driving Factors Clipart PDF. The topics addressed in these templates are Respondents, Environment Friendly, Awareness For Opting Sustainable. All the content presented in this PPT design is completely editable. Download it and make adjustments in color, background, font etc. as per your unique business setting.
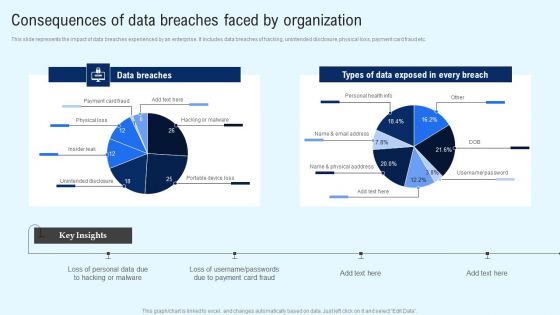
Implementing Cyber Security Incident Consequences Of Data Breaches Faced By Organization Infographics PDF
This slide represents the impact of data breaches experienced by an enterprise. It includes data breaches of hacking, unintended disclosure, physical loss, payment card fraud etc. Create an editable Implementing Cyber Security Incident Consequences Of Data Breaches Faced By Organization Infographics PDF that communicates your idea and engages your audience. Whether youre presenting a business or an educational presentation, pre designed presentation templates help save time. Implementing Cyber Security Incident Consequences Of Data Breaches Faced By Organization Infographics PDF is highly customizable and very easy to edit, covering many different styles from creative to business presentations. Slidegeeks has creative team members who have crafted amazing templates. So, go and get them without any delay.
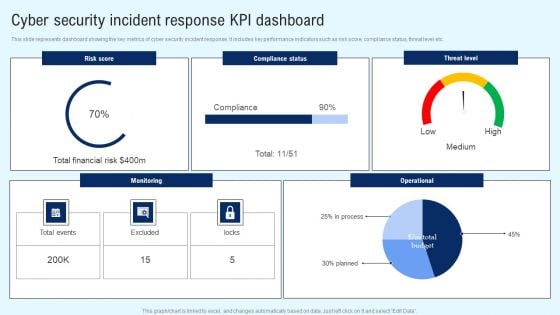
Implementing Cyber Security Incident Cyber Security Incident Response KPI Dashboard Clipart PDF
This slide represents dashboard showing the key metrics of cyber security incident response. It includes key performance indicators such as risk score, compliance status, threat level etc. There are so many reasons you need a Implementing Cyber Security Incident Cyber Security Incident Response KPI Dashboard Clipart PDF. The first reason is you cannot spend time making everything from scratch, Thus, Slidegeeks has made presentation templates for you too. You can easily download these templates from our website easily.
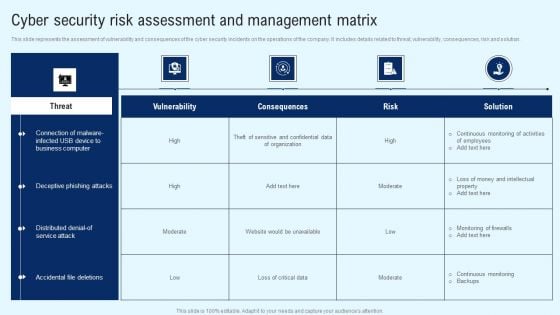
Implementing Cyber Security Incident Cyber Security Risk Assessment And Matrix Introduction PDF
This slide represents the dashboard to assess, analyze and manage the cyber security risks within an organization. It includes details related to directories with direct access, inactive accounts etc. Get a simple yet stunning designed Implementing Cyber Security Incident Cyber Security Risk Assessment And Matrix Introduction PDF. It is the best one to establish the tone in your meetings. It is an excellent way to make your presentations highly effective. So, download this PPT today from Slidegeeks and see the positive impacts. Our easy to edit Implementing Cyber Security Incident Cyber Security Risk Assessment And Matrix Introduction PDF can be your go to option for all upcoming conferences and meetings. So, what are you waiting for Grab this template today.
Implementing Cyber Security Incident Cyber Security Systems Monitoring Report Icons PDF
This slide represents the report to effectively monitor the networks and systems of the organization. It includes KPIs such as total intrusion attempts, mean detect team, mean resolve time etc. Present like a pro with Implementing Cyber Security Incident Cyber Security Systems Monitoring Report Icons PDF Create beautiful presentations together with your team, using our easy to use presentation slides. Share your ideas in real time and make changes on the fly by downloading our templates. So whether you are in the office, on the go, or in a remote location, you can stay in sync with your team and present your ideas with confidence. With Slidegeeks presentation got a whole lot easier. Grab these presentations today.


 Continue with Email

 Home
Home


