Resource Plan
KPI Dashboard To Measure Sales Market Evaluation Performance Summary Pdf
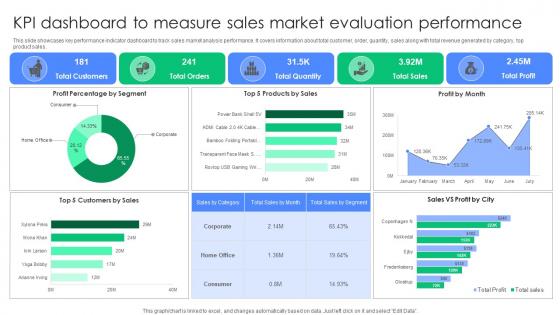
This slide showcases key performance indicator dashboard to track sales market analysis performance. It covers information about total customer, order, quantity, sales along with total revenue generated by category, top product sales. Pitch your topic with ease and precision using this KPI Dashboard To Measure Sales Market Evaluation Performance Summary Pdf. This layout presents information on Profit Percentage Segment, Products Sales, Profit Month. It is also available for immediate download and adjustment. So, changes can be made in the color, design, graphics or any other component to create a unique layout. This slide showcases key performance indicator dashboard to track sales market analysis performance. It covers information about total customer, order, quantity, sales along with total revenue generated by category, top product sales.
Global Market Size Of Digital Implementation Platform With Key Drivers Brochure Pdf
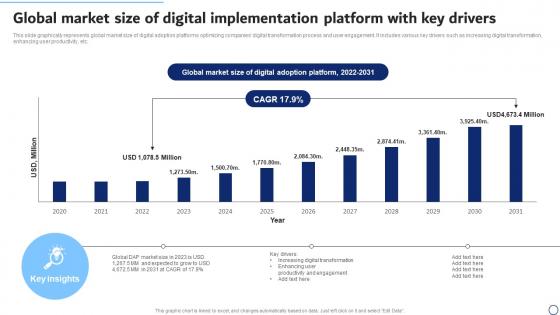
This slide graphically represents global market size of digital adoption platforms optimizing companies digital transformation process and user engagement. It includes various key drivers such as increasing digital transformation, enhancing user productivity, etc. Pitch your topic with ease and precision using this Global Market Size Of Digital Implementation Platform With Key Drivers Brochure Pdf. This layout presents information on Global Market, Digital Adoption Platform. It is also available for immediate download and adjustment. So, changes can be made in the color, design, graphics or any other component to create a unique layout. This slide graphically represents global market size of digital adoption platforms optimizing companies digital transformation process and user engagement. It includes various key drivers such as increasing digital transformation, enhancing user productivity, etc.
Impact Of Digital Implementation On Optimizing Business Efficiency Inspiration Pdf
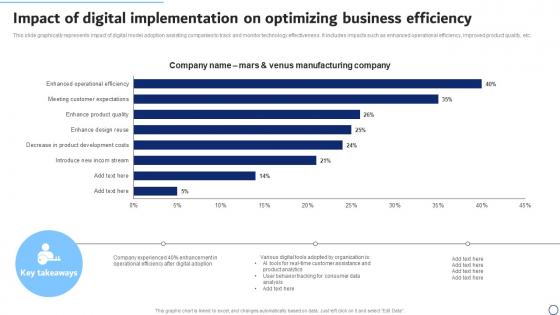
This slide graphically represents impact of digital model adoption assisting companies to track and monitor technology effectiveness. It includes impacts such as enhanced operational efficiency, improved product quality, etc. Showcasing this set of slides titled Impact Of Digital Implementation On Optimizing Business Efficiency Inspiration Pdf. The topics addressed in these templates are Manufacturing Company. All the content presented in this PPT design is completely editable. Download it and make adjustments in color, background, font etc. as per your unique business setting. This slide graphically represents impact of digital model adoption assisting companies to track and monitor technology effectiveness. It includes impacts such as enhanced operational efficiency, improved product quality, etc.
BI Analysis Dashboard For Social Media Presence Introduction Pdf
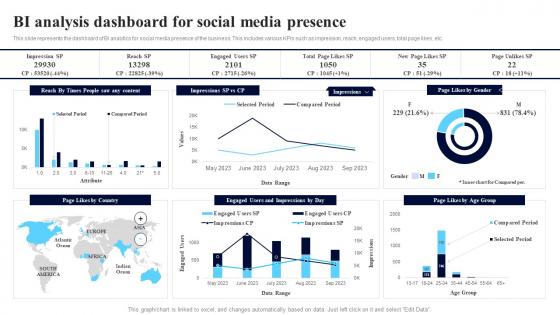
This slide represents the dashboard of BI analytics for social media presence of the business. This includes various KPIs such as impression, reach, engaged users, total page likes, etc. Pitch your topic with ease and precision using this BI Analysis Dashboard For Social Media Presence Introduction Pdf. This layout presents information on Impressions, Page Likes, Engaged Users. It is also available for immediate download and adjustment. So, changes can be made in the color, design, graphics or any other component to create a unique layout. This slide represents the dashboard of BI analytics for social media presence of the business. This includes various KPIs such as impression, reach, engaged users, total page likes, etc.
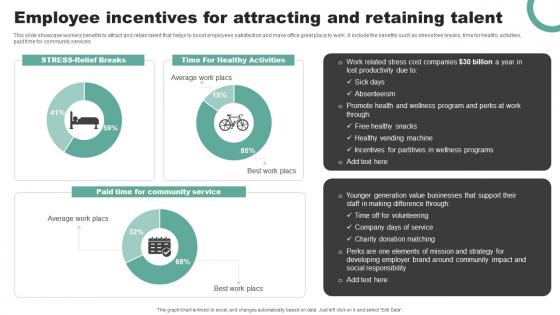
Employee Incentives For Attracting And Retaining Talent Ideas Pdf
This slide showcase workers benefits to attract and retain talent that helps to boost employees satisfaction and make office great place to work. It include the benefits such as stress free breaks, time for healthy activities, paid time for community services. Showcasing this set of slides titled Employee Incentives For Attracting And Retaining Talent Ideas Pdf The topics addressed in these templates are Healthy Activities, Community Service, Retaining Talent All the content presented in this PPT design is completely editable. Download it and make adjustments in color, background, font etc. as per your unique business setting. This slide showcase workers benefits to attract and retain talent that helps to boost employees satisfaction and make office great place to work. It include the benefits such as stress free breaks, time for healthy activities, paid time for community services.
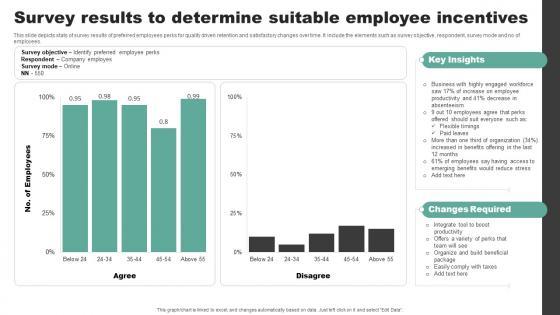
Survey Results To Determine Suitable Employee Incentives Slides Pdf
This slide depicts stats of survey results of preferred employees perks for quality driven retention and satisfactory changes over time. It include the elements such as survey objective, respondent, survey mode and no of employees. Showcasing this set of slides titled Survey Results To Determine Suitable Employee Incentives Slides Pdf The topics addressed in these templates are Survey Results, Determine Suitable, Employee Incentives All the content presented in this PPT design is completely editable. Download it and make adjustments in color, background, font etc. as per your unique business setting. This slide depicts stats of survey results of preferred employees perks for quality driven retention and satisfactory changes over time. It include the elements such as survey objective, respondent, survey mode and no of employees.
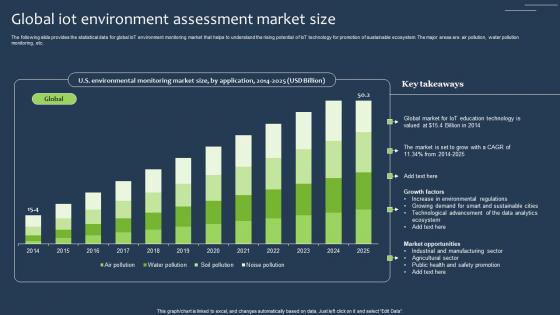
Global IOT Environment Assessment Market Size Portrait Pdf
The following slide provides the statistical data for global IoT environment monitoring market that helps to understand the rising potential of IoT technology for promotion of sustainable ecosystem. The major areas are air pollution, water pollution monitoring, etc. Pitch your topic with ease and precision using this Global IOT Environment Assessment Market Size Portrait Pdf This layout presents information on Environmental Monitoring, Market Size It is also available for immediate download and adjustment. So, changes can be made in the color, design, graphics or any other component to create a unique layout. The following slide provides the statistical data for global IoT environment monitoring market that helps to understand the rising potential of IoT technology for promotion of sustainable ecosystem. The major areas are air pollution, water pollution monitoring, etc.
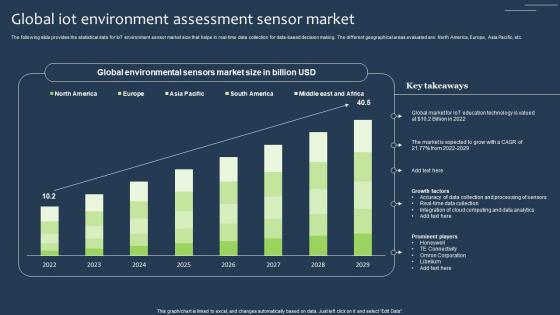
Global IOT Environment Assessment Sensor Market Inspiration Pdf
The following slide provides the statistical data for IoT environment sensor market size that helps in real-time data collection for data-based decision making. The different geographical areas evaluated are North America, Europe, Asia Pacific, etc. Showcasing this set of slides titled Global IOT Environment Assessment Sensor Market Inspiration Pdf The topics addressed in these templates are Global Environmental Sensors, Market Size All the content presented in this PPT design is completely editable. Download it and make adjustments in color, background, font etc. as per your unique business setting. The following slide provides the statistical data for IoT environment sensor market size that helps in real-time data collection for data-based decision making. The different geographical areas evaluated are North America, Europe, Asia Pacific, etc.
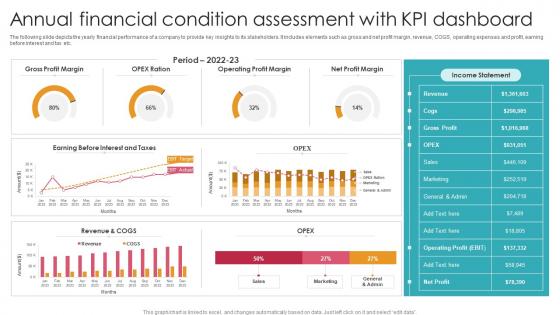
Annual Financial Condition Assessment With KPI Dashboard Ideas Pdf
The following slide depicts the yearly financial performance of a company to provide key insights to its stakeholders. It includes elements such as gross and net profit margin, revenue, COGS, operating expenses and profit, earning before interest and tax etc. Showcasing this set of slides titled Annual Financial Condition Assessment With KPI Dashboard Ideas Pdf. The topics addressed in these templates are Gross Profit Margin, Operating Profit Margin, Net Profit Margin. All the content presented in this PPT design is completely editable. Download it and make adjustments in color, background, font etc. as per your unique business setting. The following slide depicts the yearly financial performance of a company to provide key insights to its stakeholders. It includes elements such as gross and net profit margin, revenue, COGS, operating expenses and profit, earning before interest and tax etc.
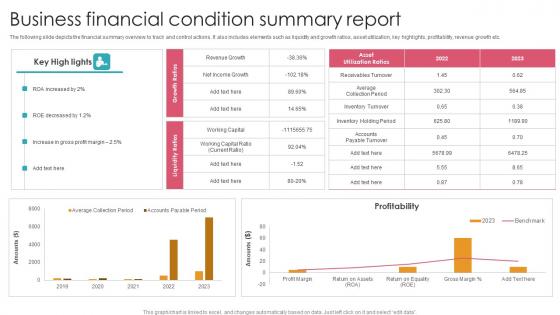
Business Financial Condition Summary Report Graphics Pdf
The following slide depicts the financial summary overview to track and control actions. It also includes elements such as liquidity and growth ratios, asset utilization, key highlights, profitability, revenue growth etc. Pitch your topic with ease and precision using this Business Financial Condition Summary Report Graphics Pdf. This layout presents information on Profitability, Increase Gross Profit Margin, Roe Decreased. It is also available for immediate download and adjustment. So, changes can be made in the color, design, graphics or any other component to create a unique layout. The following slide depicts the financial summary overview to track and control actions. It also includes elements such as liquidity and growth ratios, asset utilization, key highlights, profitability, revenue growth etc.
Tracking Departure Metrics For Employee Exit Interview Dashboard Portrait Pdf
This slide exhibits KPI dashboard of exit interview for visual representation and consolidated data aggregation. It include metrics such as Current employee, Forms submitted, Moving new position, etc. Showcasing this set of slides titled Tracking Departure Metrics For Employee Exit Interview Dashboard Portrait Pdf The topics addressed in these templates are Exit Interview Dashboard, Forms Submitted, Moving New Position All the content presented in this PPT design is completely editable. Download it and make adjustments in color, background, font etc. as per your unique business setting. This slide exhibits KPI dashboard of exit interview for visual representation and consolidated data aggregation. It include metrics such as Current employee, Forms submitted, Moving new position, etc.
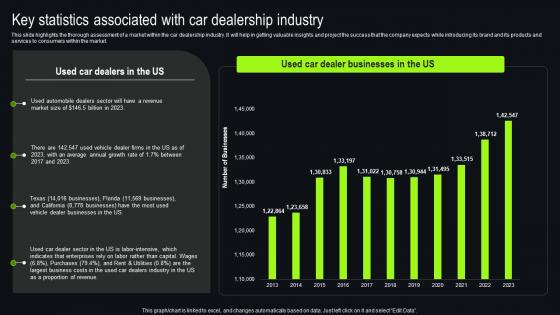
Key Statistics Associated With Car Dealership Industry New And Used Car Dealership Brochure Pdf
This slide highlights the thorough assessment of a market within the car dealership industry. It will help in getting valuable insights and project the success that the company expects while introducing its brand and its products and services to consumers within the market. The Key Statistics Associated With Car Dealership Industry New And Used Car Dealership Brochure Pdf is a compilation of the most recent design trends as a series of slides. It is suitable for any subject or industry presentation, containing attractive visuals and photo spots for businesses to clearly express their messages. This template contains a variety of slides for the user to input data, such as structures to contrast two elements, bullet points, and slides for written information. Slidegeeks is prepared to create an impression. This slide highlights the thorough assessment of a market within the car dealership industry. It will help in getting valuable insights and project the success that the company expects while introducing its brand and its products and services to consumers within the market.
Dashboard For Tracking Onboarding Email Campaign Results Designs Pdf
The purpose of this slide is to represent a dashboard for welcome email campaign result to analyse the success rate. It includes component such as click through rate, click to open ratio, soft bounce rate, unsubscribe rate, hard bounce rate etc. Pitch your topic with ease and precision using this Dashboard For Tracking Onboarding Email Campaign Results Designs Pdf. This layout presents information on Monthly Total Subscribers, Monthly Open Rate, Unsubscribe Rate . It is also available for immediate download and adjustment. So, changes can be made in the color, design, graphics or any other component to create a unique layout. The purpose of this slide is to represent a dashboard for welcome email campaign result to analyse the success rate. It includes component such as click through rate, click to open ratio, soft bounce rate, unsubscribe rate, hard bounce rate etc.
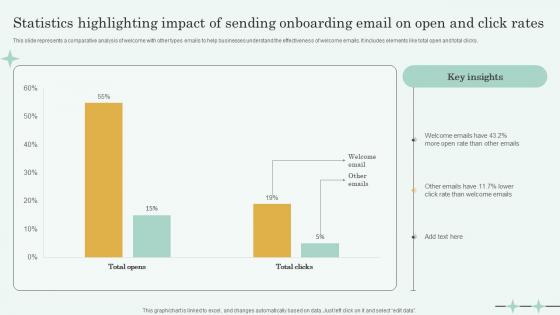
Statistics Highlighting Impact Of Sending Onboarding Email On Open And Click Rates Sample Pdf
This slide represents a comparative analysis of welcome with other types emails to help businesses understand the effectiveness of welcome emails. It includes elements like total open and total clicks. Pitch your topic with ease and precision using this Statistics Highlighting Impact Of Sending Onboarding Email On Open And Click Rates Sample Pdf. This layout presents information on Welcome Emails, Open Rate, Sending Onboarding Email. It is also available for immediate download and adjustment. So, changes can be made in the color, design, graphics or any other component to create a unique layout. This slide represents a comparative analysis of welcome with other types emails to help businesses understand the effectiveness of welcome emails. It includes elements like total open and total clicks.
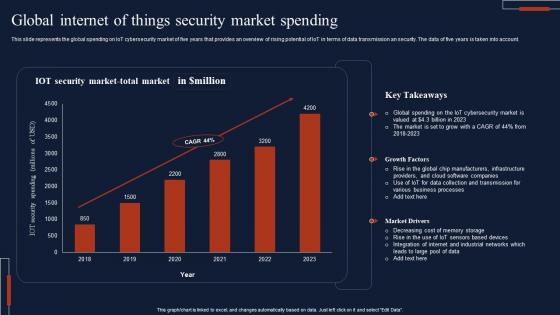
Global Internet Of Things Security Market Spending Download Pdf
This slide represents the global spending on IoT cybersecurity market of five years that provides an overview of rising potential of IoT in terms of data transmission an security. The data of five years is taken into account. Pitch your topic with ease and precision using this Global Internet Of Things Security Market Spending Download Pdf This layout presents information on IOT Security, Market Total, Key Takeaways It is also available for immediate download and adjustment. So, changes can be made in the color, design, graphics or any other component to create a unique layout. This slide represents the global spending on IoT cybersecurity market of five years that provides an overview of rising potential of IoT in terms of data transmission an security. The data of five years is taken into account.
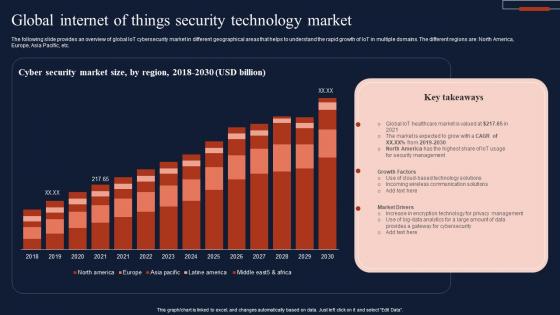
Global Internet Of Things Security Technology Market Infographics Pdf
The following slide provides an overview of global IoT cybersecurity market in different geographical areas that helps to understand the rapid growth of IoT in multiple domains. The different regions are North America, Europe, Asia Pacific, etc. Showcasing this set of slides titled Global Internet Of Things Security Technology Market Infographics Pdf The topics addressed in these templates are Cyber Security, Market Size, Technology Market All the content presented in this PPT design is completely editable. Download it and make adjustments in color, background, font etc. as per your unique business setting. The following slide provides an overview of global IoT cybersecurity market in different geographical areas that helps to understand the rapid growth of IoT in multiple domains. The different regions are North America, Europe, Asia Pacific, etc.
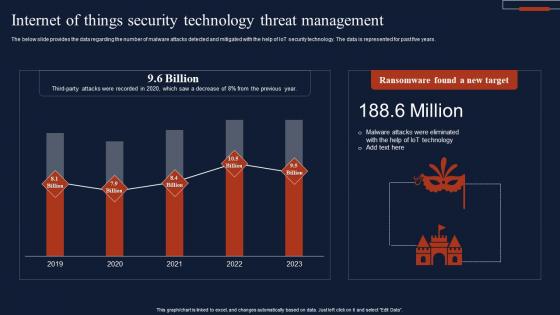
Internet Of Things Security Technology Threat Management Summary Pdf
The below slide provides the data regarding the number of malware attacks detected and mitigated with the help of IoT security technology. The data is represented for past five years. Pitch your topic with ease and precision using this Internet Of Things Security Technology Threat Management Summary Pdf This layout presents information on Ransomware Found, New Target, Threat Management It is also available for immediate download and adjustment. So, changes can be made in the color, design, graphics or any other component to create a unique layout. The below slide provides the data regarding the number of malware attacks detected and mitigated with the help of IoT security technology. The data is represented for past five years.
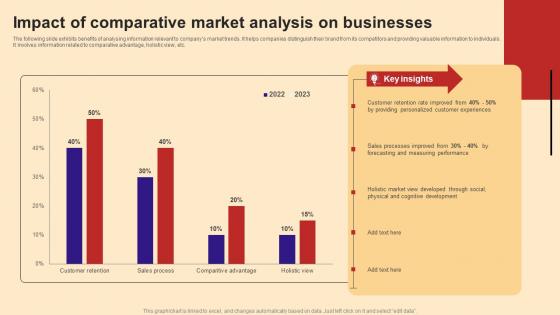
Impact Of Comparative Market Analysis On Businesses Designs Pdf
The following slide exhibits benefits of analysing information relevant to companys market trends. It helps companies distinguish their brand from its competitors and providing valuable information to individuals. It involves information related to comparative advantage, holistic view, etc.Showcasing this set of slides titled Impact Of Comparative Market Analysis On Businesses Designs Pdf The topics addressed in these templates are Measuring Performance, Processes Improved, Providing Personalized All the content presented in this PPT design is completely editable. Download it and make adjustments in color, background, font etc. as per your unique business setting. The following slide exhibits benefits of analysing information relevant to companys market trends. It helps companies distinguish their brand from its competitors and providing valuable information to individuals. It involves information related to comparative advantage, holistic view, etc.
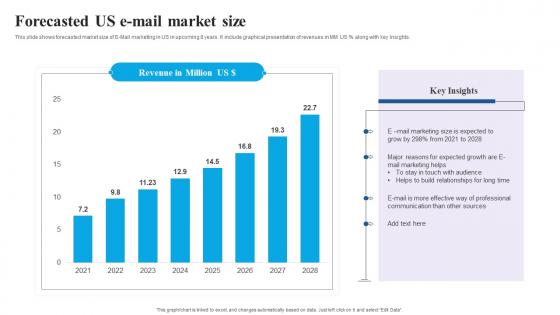
Forecasted Us E Mail Market Size Clipart Pdf
This slide shows forecasted market size of E-Mail marketing in US in upcoming 8 years. It include graphical presentation of revenues in MM US precent along with key insights.Showcasing this set of slides titled Forecasted Us E Mail Market Size Clipart Pdf The topics addressed in these templates are Build Relationships, Communication Other, Effective Professional All the content presented in this PPT design is completely editable. Download it and make adjustments in color, background, font etc. as per your unique business setting. This slide shows forecasted market size of E Mail marketing in US in upcoming 8 years. It include graphical presentation of revenues in MM US precent along with key insights.
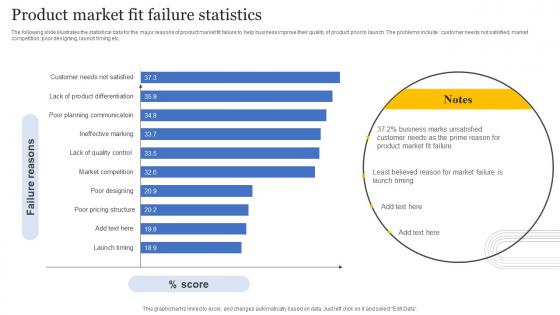
Product Market Fit Failure Statistics Professional Pdf
The following slide illustrates the statistical data for the major reasons of product market fit failure to help business improve their quality of product prior to launch. The problems include customer needs not satisfied, market competition, poor designing, launch timing etc. Pitch your topic with ease and precision using this Product Market Fit Failure Statistics Professional Pdf This layout presents information on Product Market Fit, Failure Statistics It is also available for immediate download and adjustment. So, changes can be made in the color, design, graphics or any other component to create a unique layout. The following slide illustrates the statistical data for the major reasons of product market fit failure to help business improve their quality of product prior to launch. The problems include customer needs not satisfied, market competition, poor designing, launch timing etc.
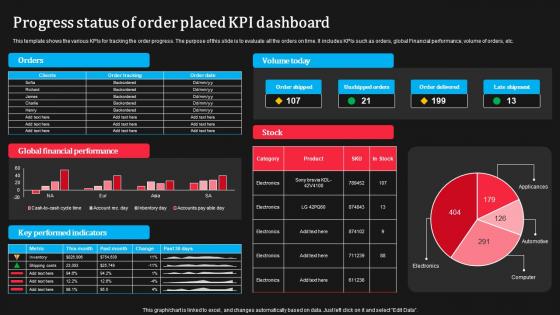
Progress Status Of Order Placed KPI Dashboard Sample Pdf
This template shows the various KPIs for tracking the order progress. The purpose of this slide is to evaluate all the orders on time. It includes KPIs such as orders, global Financial performance, volume of orders, etc.Pitch your topic with ease and precision using this Progress Status Of Order Placed KPI Dashboard Sample Pdf This layout presents information on Progress Status, Order Placed, KPI Dashboard It is also available for immediate download and adjustment. So, changes can be made in the color, design, graphics or any other component to create a unique layout. This template shows the various KPIs for tracking the order progress. The purpose of this slide is to evaluate all the orders on time. It includes KPIs such as orders, global Financial performance, volume of orders, etc.
Dashboard For Tracking Impact Leveraging Logistics Automation Inspiration Pdf
This slide covers the dashboard for tracking vehicle efficiency after transport automation. It include KPIs such as truck turnaround time, average revenue per hour, truckload capacity, transit time, on-time pickup, and average revenue per mile.Do you have to make sure that everyone on your team knows about any specific topic I yes, then you should give Dashboard For Tracking Impact Leveraging Logistics Automation Inspiration Pdf a try. Our experts have put a lot of knowledge and effort into creating this impeccable Dashboard For Tracking Impact Leveraging Logistics Automation Inspiration Pdf. You can use this template for your upcoming presentations, as the slides are perfect to represent even the tiniest detail. You can download these templates from the Slidegeeks website and these are easy to edit. So grab these today. This slide covers the dashboard for tracking vehicle efficiency after transport automation. It include KPIs such as truck turnaround time, average revenue per hour, truckload capacity, transit time, on time pickup, and average revenue per mile.
Dashboard For Tracking Impact Of Warehouse Leveraging Logistics Automation Information Pdf
This slide covers the dashboard with after automation warehouse overview. It include KPIs such as autonomous robots status, robotic arms status, battery level, performance, time to return, etc.Get a simple yet stunning designed Dashboard For Tracking Impact Of Warehouse Leveraging Logistics Automation Information Pdf. It is the best one to establish the tone in your meetings. It is an excellent way to make your presentations highly effective. So, download this PPT today from Slidegeeks and see the positive impacts. Our easy-to-edit Dashboard For Tracking Impact Of Warehouse Leveraging Logistics Automation Information Pdf can be your go-to option for all upcoming conferences and meetings. So, what are you waiting for Grab this template today. This slide covers the dashboard with after automation warehouse overview. It include KPIs such as autonomous robots status, robotic arms status, battery level, performance, time to return, etc.
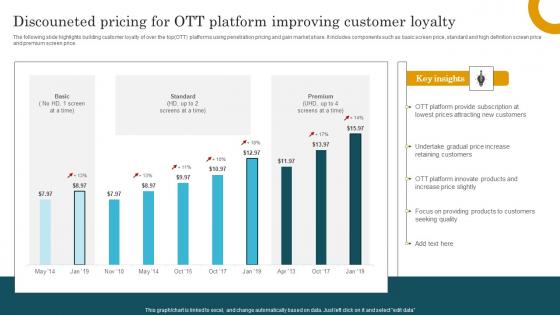
Discouneted Pricing For Ott Platform Improving Customer Loyalty Graphics Pdf
The following slide highlights building customer loyalty of over the topOTT platforms using penetration pricing and gain market share. It includes components such as basic screen price, standard and high definition screen price and premium screen price. Showcasing this set of slides titled Discouneted Pricing For Ott Platform Improving Customer Loyalty Graphics Pdf The topics addressed in these templates are Discouneted Pricing, Platform Improving, Customer Loyalty All the content presented in this PPT design is completely editable. Download it and make adjustments in color, background, font etc. as per your unique business setting. The following slide highlights building customer loyalty of over the topOTT platforms using penetration pricing and gain market share. It includes components such as basic screen price, standard and high definition screen price and premium screen price.
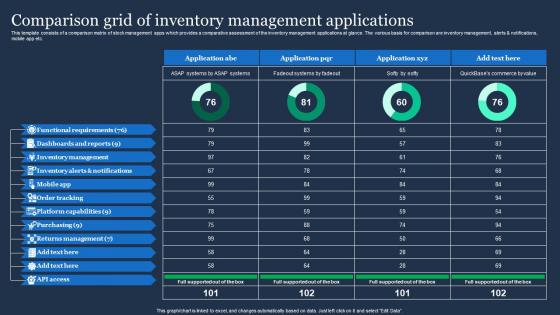
Comparison Grid Of Inventory Management Applications Clipart Pdf
This template consists of a comparison matrix of stock management apps which provides a comparative assessment of the inventory management applications at glance. The various basis for comparison are inventory management, alerts and notifications, mobile app etc. Showcasing this set of slides titled Comparison Grid Of Inventory Management Applications Clipart Pdf. The topics addressed in these templates are Functional Requirements, Dashboards And Reports, Inventory Management. All the content presented in this PPT design is completely editable. Download it and make adjustments in color, background, font etc. as per your unique business setting. This template consists of a comparison matrix of stock management apps which provides a comparative assessment of the inventory management applications at glance. The various basis for comparison are inventory management, alerts and notifications, mobile app etc.
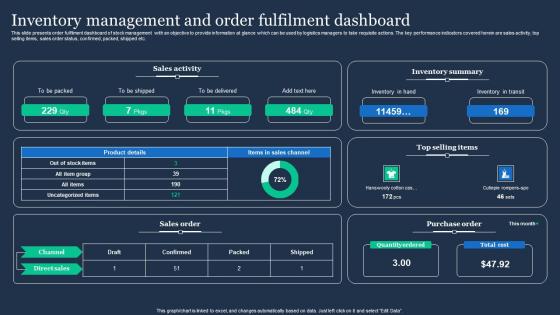
Inventory Management And Order Fulfilment Dashboard Slides Pdf
This slide presents order fulfilment dashboard of stock management with an objective to provide information at glance which can be used by logistics managers to take requisite actions. The key performance indicators covered herein are sales activity, top selling items, sales order status, confirmed, packed, shipped etc. Pitch your topic with ease and precision using this Inventory Management And Order Fulfilment Dashboard Slides Pdf. This layout presents information on Sales Activity, Inventory Summary, Sales Order. It is also available for immediate download and adjustment. So, changes can be made in the color, design, graphics or any other component to create a unique layout. This slide presents order fulfilment dashboard of stock management with an objective to provide information at glance which can be used by logistics managers to take requisite actions. The key performance indicators covered herein are sales activity, top selling items, sales order status, confirmed, packed, shipped etc.
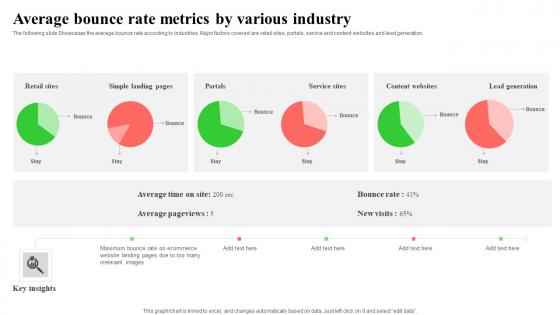
Average Bounce Rate Metrics By Various Industry Mockup Pdf
The following slide Showcases the average bounce rate according to industries. Major factors covered are retail sites, portals, service and content websites and lead generation. Showcasing this set of slides titled Average Bounce Rate Metrics By Various Industry Mockup Pdf. The topics addressed in these templates are Portals, Service,Content Websites. All the content presented in this PPT design is completely editable. Download it and make adjustments in color, background, font etc. as per your unique business setting. The following slide Showcases the average bounce rate according to industries. Major factors covered are retail sites, portals, service and content websites and lead generation.
Bounce Rate KPI Tracking Dashboard With Average Pages And Time Inspiration Pdf
The following slide showcases dashboard that helps to identify the average time spent on page by visitors and the bounce rate. It also includes page load time, bounce rate by browser and details on internet explorer. Pitch your topic with ease and precision using this Bounce Rate KPI Tracking Dashboard With Average Pages And Time Inspiration Pdf. This layout presents information on Page Load Time, Bounce Rate, Internet Explorer. It is also available for immediate download and adjustment. So, changes can be made in the color, design, graphics or any other component to create a unique layout. The following slide showcases dashboard that helps to identify the average time spent on page by visitors and the bounce rate. It also includes page load time, bounce rate by browser and details on internet explorer.
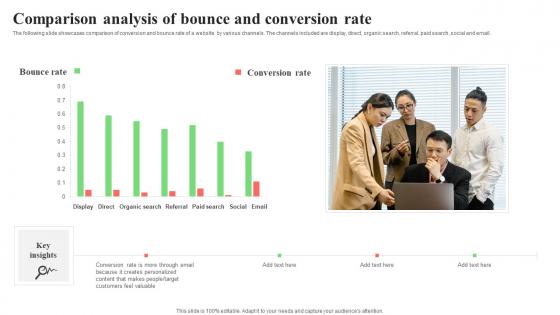
Comparison Analysis Of Bounce And Conversion Rate Topics Pdf
The following slide showcases comparison of conversion and bounce rate of a website by various channels. The channels included are display, direct, organic search, referral, paid search, social and email. Pitch your topic with ease and precision using this Comparison Analysis Of Bounce And Conversion Rate Topics Pdf. This layout presents information on Organic Search, Referral, Paid Search. It is also available for immediate download and adjustment. So, changes can be made in the color, design, graphics or any other component to create a unique layout. The following slide showcases comparison of conversion and bounce rate of a website by various channels. The channels included are display, direct, organic search, referral, paid search, social and email.
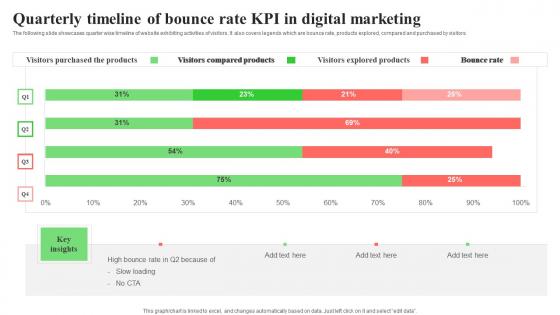
Quarterly Timeline Of Bounce Rate KPI In Digital Marketing Template Pdf
The following slide showcases quarter wise timeline of website exhibiting activities of visitors. It also covers legends which are bounce rate, products explored, compared and purchased by visitors. Showcasing this set of slides titled Quarterly Timeline Of Bounce Rate KPI In Digital Marketing Template Pdf. The topics addressed in these templates are Visitors Compared Products, Bounce Rate. All the content presented in this PPT design is completely editable. Download it and make adjustments in color, background, font etc. as per your unique business setting. The following slide showcases quarter wise timeline of website exhibiting activities of visitors. It also covers legends which are bounce rate, products explored, compared and purchased by visitors.
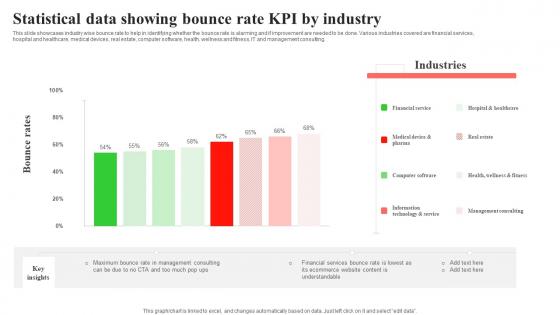
Statistical Data Showing Bounce Rate KPI By Industry Ideas Pdf
This slide showcases industry wise bounce rate to help in identifying whether the bounce rate is alarming and if improvement are needed to be done. Various industries covered are financial services, hospital and healthcare, medical devices, real estate, computer software, health, wellness and fitness, IT and management consulting. Showcasing this set of slides titled Statistical Data Showing Bounce Rate KPI By Industry Ideas Pdf. The topics addressed in these templates are Financial Services, Hospital And Healthcare, Medical Devices. All the content presented in this PPT design is completely editable. Download it and make adjustments in color, background, font etc. as per your unique business setting. This slide showcases industry wise bounce rate to help in identifying whether the bounce rate is alarming and if improvement are needed to be done. Various industries covered are financial services, hospital and healthcare, medical devices, real estate, computer software, health, wellness and fitness, IT and management consulting.
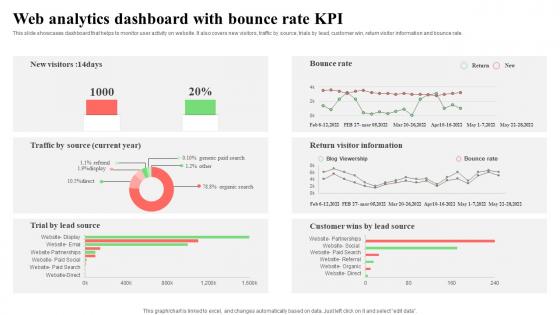
Web Analytics Dashboard With Bounce Rate KPI Elements Pdf
This slide showcases dashboard that helps to monitor user activity on website. It also covers new visitors, traffic by source, trials by lead, customer win, return visitor information and bounce rate. Showcasing this set of slides titled Web Analytics Dashboard With Bounce Rate KPI Elements Pdf. The topics addressed in these templates are Lead, Customer Win, Return Visitor Information. All the content presented in this PPT design is completely editable. Download it and make adjustments in color, background, font etc. as per your unique business setting. This slide showcases dashboard that helps to monitor user activity on website. It also covers new visitors, traffic by source, trials by lead, customer win, return visitor information and bounce rate.
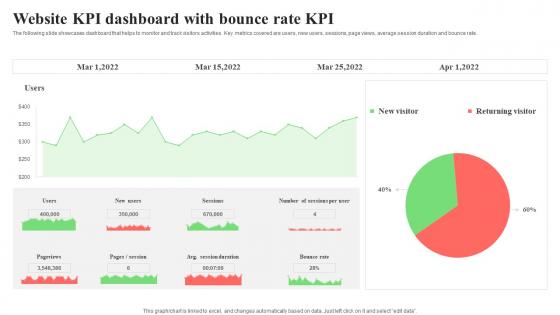
Website KPI Dashboard With Bounce Rate KPI Formats Pdf
The following slide showcases dashboard that helps to monitor and track visitors activities. Key metrics covered are users, new users, sessions, page views, average session duration and bounce rate. Pitch your topic with ease and precision using this Website KPI Dashboard With Bounce Rate KPI Formats Pdf. This layout presents information on Page Views, Average Session Duration, Bounce Rate. It is also available for immediate download and adjustment. So, changes can be made in the color, design, graphics or any other component to create a unique layout. The following slide showcases dashboard that helps to monitor and track visitors activities. Key metrics covered are users, new users, sessions, page views, average session duration and bounce rate.
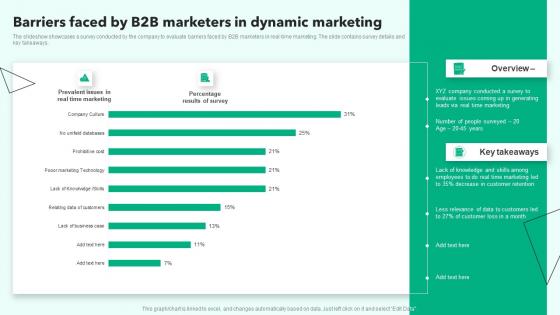
Barriers Faced By B2B Marketers In Dynamic Marketing Ideas Pdf
The slideshow showcases a survey conducted by the company to evaluate barriers faced by B2B marketers in real time marketing. The slide contains survey details and key takeaways. Showcasing this set of slides titled Barriers Faced By B2B Marketers In Dynamic Marketing Ideas Pdf. The topics addressed in these templates are Evaluate, Key Takeaways, Customer Retention. All the content presented in this PPT design is completely editable. Download it and make adjustments in color, background, font etc. as per your unique business setting. The slideshow showcases a survey conducted by the company to evaluate barriers faced by B2B marketers in real time marketing. The slide contains survey details and key takeaways.
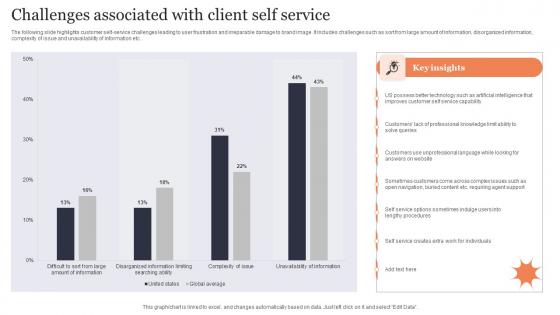
Challenges Associated With Client Self Service Designs Pdf
The following slide highlights customer self-service challenges leading to user frustration and irreparable damage to brand image. It includes challenges such as sort from large amount of information, disorganized information, complexity of issue and unavailability of information etc. Pitch your topic with ease and precision using this Challenges Associated With Client Self Service Designs Pdf. This layout presents information on Challenges Associated, Client Self Service. It is also available for immediate download and adjustment. So, changes can be made in the color, design, graphics or any other component to create a unique layout. The following slide highlights customer self-service challenges leading to user frustration and irreparable damage to brand image. It includes challenges such as sort from large amount of information, disorganized information, complexity of issue and unavailability of information etc.
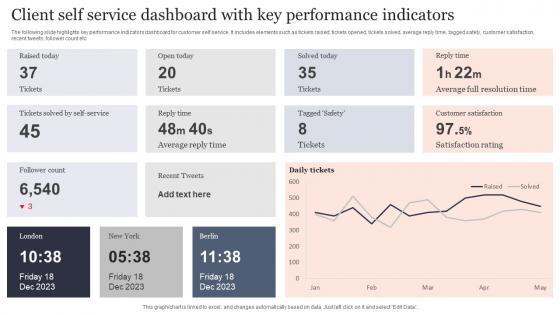
Client Self Service Dashboard With Key Performance Indicators Pictures Pdf
The following slide highlights key performance indicators dashboard for customer self service. It includes elements such as tickets raised, tickets opened, tickets solved, average reply time, tagged safety, customer satisfaction, recent tweets, follower count etc. Showcasing this set of slides titled Client Self Service Dashboard With Key Performance Indicators Pictures Pdf. The topics addressed in these templates are Open Today, Reply Time. All the content presented in this PPT design is completely editable. Download it and make adjustments in color, background, font etc. as per your unique business setting. The following slide highlights key performance indicators dashboard for customer self service. It includes elements such as tickets raised, tickets opened, tickets solved, average reply time, tagged safety, customer satisfaction, recent tweets, follower count etc.

Client Self Service Metric Dashboard Brochure Pdf
The following slide highlights dashboard for customer self service to limit repetitive questions and facilitate support staff to handle complex issues. It includes components such as self service score, unique customers who survey help content, unique customers who produced tickets etc. Pitch your topic with ease and precision using this Client Self Service Metric Dashboard Brochure Pdf. This layout presents information on Self Service Score, Published, Content Type. It is also available for immediate download and adjustment. So, changes can be made in the color, design, graphics or any other component to create a unique layout. The following slide highlights dashboard for customer self service to limit repetitive questions and facilitate support staff to handle complex issues. It includes components such as self service score, unique customers who survey help content, unique customers who produced tickets etc.
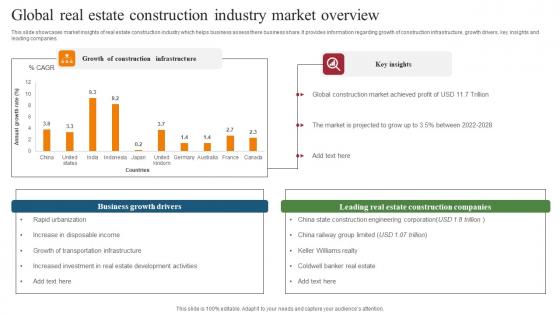
Global Real Estate Construction Industry Market Overview Formats Pdf
This slide showcases market insights of real estate construction industry which helps business assess there business share. It provides information regarding growth of construction infrastructure, growth drivers, key insights and leading companies. Pitch your topic with ease and precision using this Global Real Estate Construction Industry Market Overview Formats Pdf. This layout presents information on Business Growth Drivers, Construction Companies. It is also available for immediate download and adjustment. So, changes can be made in the color, design, graphics or any other component to create a unique layout. This slide showcases market insights of real estate construction industry which helps business assess there business share. It provides information regarding growth of construction infrastructure, growth drivers, key insights and leading companies.
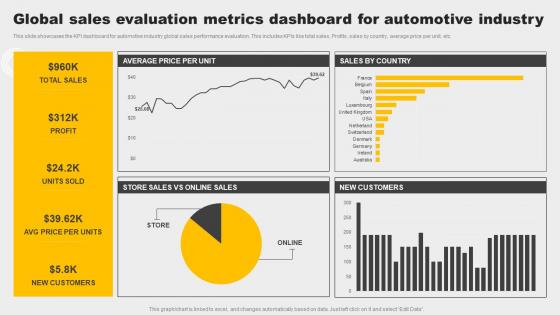
Global Sales Evaluation Metrics Dashboard For Automotive Industry Demonstration Pdf
This slide showcases the KPI dashboard for automotive industry global sales performance evaluation. This includes KPIs like total sales, Profits, sales by country, average price per unit, etc. Pitch your topic with ease and precision using this Global Sales Evaluation Metrics Dashboard For Automotive Industry Demonstration Pdf. This layout presents information on Customers, Profit, Sales. It is also available for immediate download and adjustment. So, changes can be made in the color, design, graphics or any other component to create a unique layout. This slide showcases the KPI dashboard for automotive industry global sales performance evaluation. This includes KPIs like total sales, Profits, sales by country, average price per unit, etc.
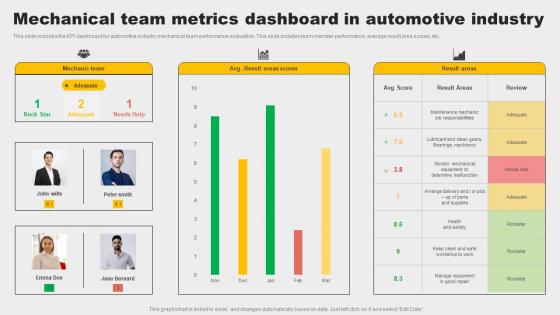
Mechanical Team Metrics Dashboard In Automotive Industry Rules Pdf
This slide includes the KPI dashboard for automotive industry mechanical team performance evaluation. This slide includes team member performance, average result area scores, etc. Showcasing this set of slides titled Mechanical Team Metrics Dashboard In Automotive Industry Rules Pdf. The topics addressed in these templates are Determine Malfunction, Automotive Industry, Mechanical Team Metrics Dashboard. All the content presented in this PPT design is completely editable. Download it and make adjustments in color, background, font etc. as per your unique business setting. This slide includes the KPI dashboard for automotive industry mechanical team performance evaluation. This slide includes team member performance, average result area scores, etc.
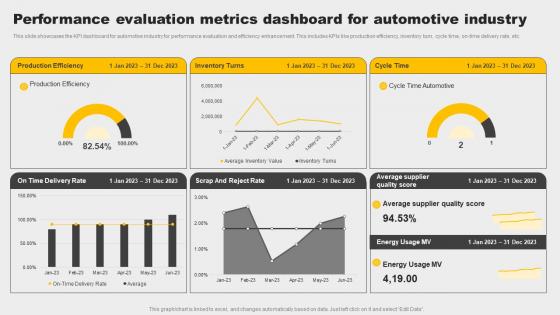
Performance Evaluation Metrics Dashboard For Automotive Industry Mockup Pdf
This slide showcases the KPI dashboard for automotive industry for performance evaluation and efficiency enhancement. This includes KPIs like production efficiency, inventory turn, cycle time, on time delivery rate, etc. Pitch your topic with ease and precision using this Performance Evaluation Metrics Dashboard For Automotive Industry Mockup Pdf. This layout presents information on Production Efficiency, Inventory Turns, Automotive Industry. It is also available for immediate download and adjustment. So, changes can be made in the color, design, graphics or any other component to create a unique layout. This slide showcases the KPI dashboard for automotive industry for performance evaluation and efficiency enhancement. This includes KPIs like production efficiency, inventory turn, cycle time, on time delivery rate, etc.
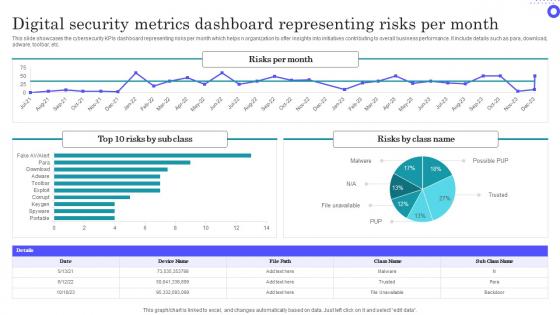
Digital Security Metrics Dashboard Representing Risks Per Month Themes Pdf
Showcasing this set of slides titled Digital Security Metrics Dashboard Representing Risks Per Month Themes Pdf The topics addressed in these templates are Digital Security, Metrics Dashboard, Representing Risks All the content presented in this PPT design is completely editable. Download it and make adjustments in color, background, font etc. as per your unique business setting. This slide showcases the cybersecurity KPIs dashboard representing risks per month which helps n organization to offer insights into initiatives contributing to overall business performance. It include details such as para, download, adware, toolbar, etc.
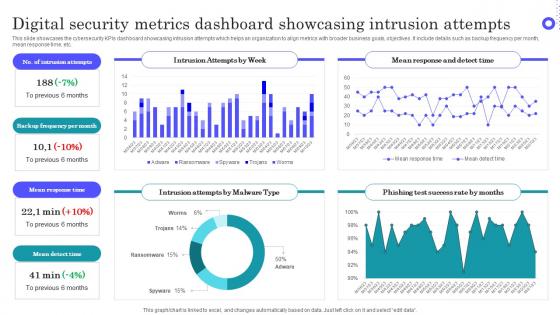
Digital Security Metrics Dashboard Showcasing Intrusion Attempts Topics Pdf
Pitch your topic with ease and precision using this Digital Security Metrics Dashboard Showcasing Intrusion Attempts Topics Pdf This layout presents information on Intrusion Attempts, Frequency Per Month, Mean Response Time It is also available for immediate download and adjustment. So, changes can be made in the color, design, graphics or any other component to create a unique layout. This slide showcases the cybersecurity KPIs dashboard showcasing intrusion attempts which helps an organization to align metrics with broader business goals, objectives. It include details such as backup frequency per month, mean response time, etc.
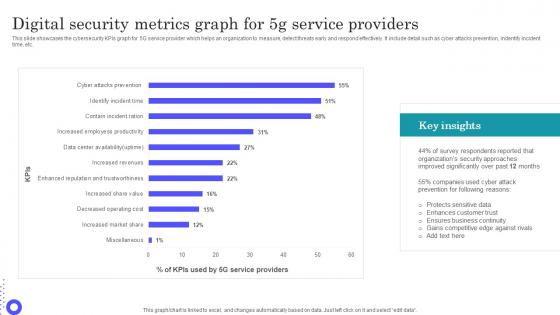
Digital Security Metrics Graph For 5g Service Providers Guidelines Pdf
Showcasing this set of slides titled Digital Security Metrics Graph For 5g Service Providers Guidelines Pdf The topics addressed in these templates are Protects Sensitive, Enhances Customer, Ensures Business Continuity All the content presented in this PPT design is completely editable. Download it and make adjustments in color, background, font etc. as per your unique business setting. This slide showcases the cybersecurity KPIs graph for 5G service provider which helps an organization to measure, detect threats early and respond effectively. It include detail such as cyber attacks prevention, indentify incident time, etc.
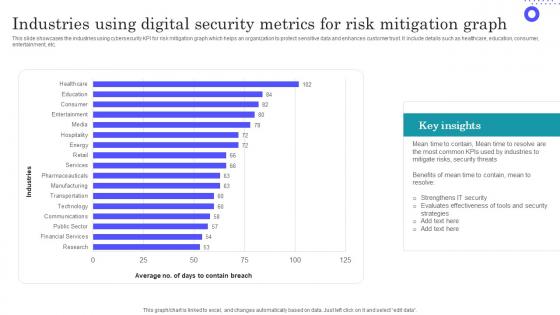
Industries Using Digital Security Metrics For Risk Mitigation Graph Inspiration Pdf
Showcasing this set of slides titled Industries Using Digital Security Metrics For Risk Mitigation Graph Inspiration Pdf The topics addressed in these templates are Evaluates Effectiveness, Most Common, Key Insights All the content presented in this PPT design is completely editable. Download it and make adjustments in color, background, font etc. as per your unique business setting. This slide showcases the industries using cybersecurity KPI for risk mitigation graph which helps an organization to protect sensitive data and enhances customer trust. It include details such as healthcare, education, consumer, entertainment, etc.

Statistics Highlighting Monthly Goals Achieved By Production Department Graphics Pdf
Mentioned slide demonstrates monthly production goals accomplished by production and operations department. It includes key elements such as target units to be produced and actual goods produced by business. Showcasing this set of slides titled Statistics Highlighting Monthly Goals Achieved By Production Department Graphics Pdf. The topics addressed in these templates are Goods Produced. All the content presented in this PPT design is completely editable. Download it and make adjustments in color, background, font etc. as per your unique business setting. Mentioned slide demonstrates monthly production goals accomplished by production and operations department. It includes key elements such as target units to be produced and actual goods produced by business.
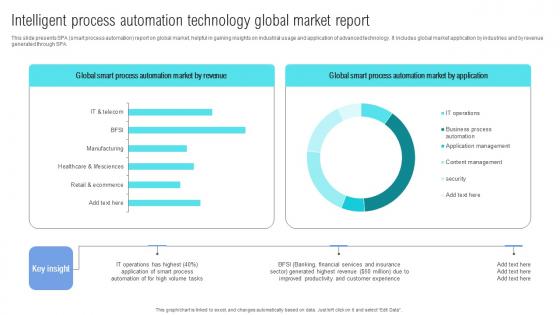
Intelligent Process Automation Technology Global Market Report Mockup Pdf
This slide presents SPA smart process automation report on global market, helpful in gaining insights on industrial usage and application of advanced technology. It includes global market application by industries and by revenue generated through SPA. Pitch your topic with ease and precision using this Intelligent Process Automation Technology Global Market Report Mockup Pdf. This layout presents information on Intelligent Process, Automation Technology, Global Market Report. It is also available for immediate download and adjustment. So, changes can be made in the color, design, graphics or any other component to create a unique layout. This slide presents SPA smart process automation report on global market, helpful in gaining insights on industrial usage and application of advanced technology. It includes global market application by industries and by revenue generated through SPA.
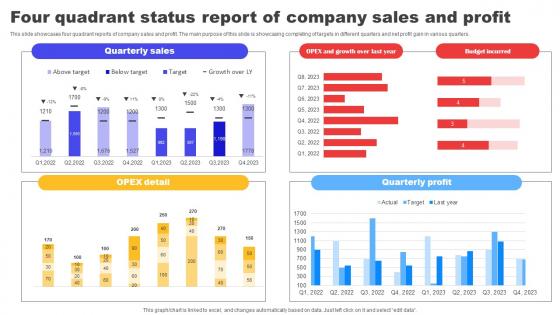
Four Quadrant Status Report Of Company Sales And Profit Pictures pdf
This slide showcases four quadrant reports of company sales and profit. The main purpose of this slide is showcasing completing of targets in different quarters and net profit gain in various quarters. Showcasing this set of slides titled Four Quadrant Status Report Of Company Sales And Profit Pictures pdf. The topics addressed in these templates are Quarterly Sales,OPEX Detail,Quarterly Profit. All the content presented in this PPT design is completely editable. Download it and make adjustments in color, background, font etc. as per your unique business setting. This slide showcases four quadrant reports of company sales and profit. The main purpose of this slide is showcasing completing of targets in different quarters and net profit gain in various quarters.
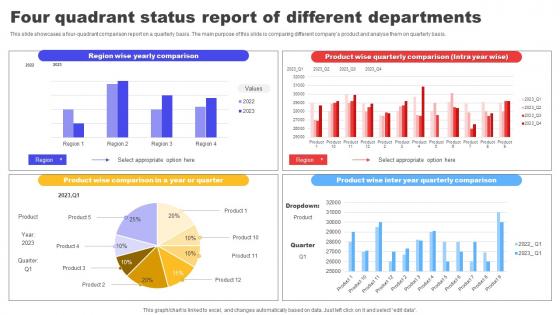
Four Quadrant Status Report Of Different Departments Clipart pdf
This slide showcases a four-quadrant comparison report on a quarterly basis. The main purpose of this slide is comparing different companys product and analyse them on quarterly basis. Pitch your topic with ease and precision using this Four Quadrant Status Report Of Different Departments Clipart pdf. This layout presents information on Region Wise,Yearly Comparison,Product Wise Compariso. It is also available for immediate download and adjustment. So, changes can be made in the color, design, graphics or any other component to create a unique layout. This slide showcases a four-quadrant comparison report on a quarterly basis. The main purpose of this slide is comparing different companys product and analyse them on quarterly basis.
Devops For Infrastructure Management Dashboard Showcasing Performance Tracking Portrait Pdf
This slide showcases the devops infrastructure dashboard showcasing performance tracking which helps an organization to carefully access the task completed. It include details such as work in progress, viruses, assigned items, etc. Pitch your topic with ease and precision using this Devops For Infrastructure Management Dashboard Showcasing Performance Tracking Portrait Pdf This layout presents information on Work In Progress, Backlog Work, Uncompleted Work It is also available for immediate download and adjustment. So, changes can be made in the color, design, graphics or any other component to create a unique layout. This slide showcases the devops infrastructure dashboard showcasing performance tracking which helps an organization to carefully access the task completed. It include details such as work in progress, viruses, assigned items, etc.
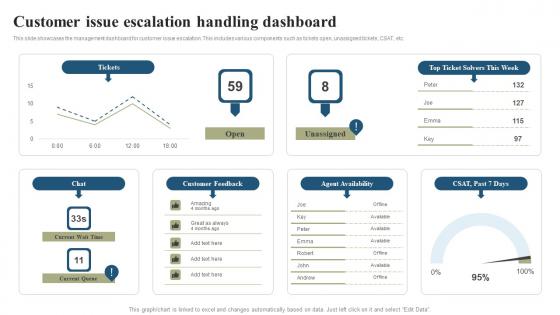
Customer Issue Escalation Handling Dashboard Download Pdf
This slide showcases the management dashboard for customer issue escalation. This includes various components such as tickets open, unassigned tickets, CSAT, etc. Pitch your topic with ease and precision using this Customer Issue Escalation Handling Dashboard Download Pdf This layout presents information on Customer Feedback, Agent Availability, Customer Issue It is also available for immediate download and adjustment. So, changes can be made in the color, design, graphics or any other component to create a unique layout. This slide showcases the management dashboard for customer issue escalation. This includes various components such as tickets open, unassigned tickets, CSAT, etc.
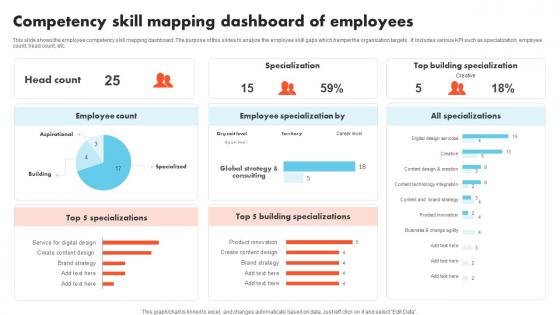
Competency Skill Mapping Dashboard Of Employees Formats Pdf
This slide shows the employee competency skill mapping dashboard .The purpose of this slides to analyze the employee skill gaps which hamper the organization targets .It includes various KPI such as specialization, employee count, head count, etc. Pitch your topic with ease and precision using this Competency Skill Mapping Dashboard Of Employees Formats Pdf This layout presents information on Employee Specialization, Building Specializations, Specialization It is also available for immediate download and adjustment. So, changes can be made in the color, design, graphics or any other component to create a unique layout. This slide shows the employee competency skill mapping dashboard .The purpose of this slides to analyze the employee skill gaps which hamper the organization targets .It includes various KPI such as specialization, employee count, head count, etc.
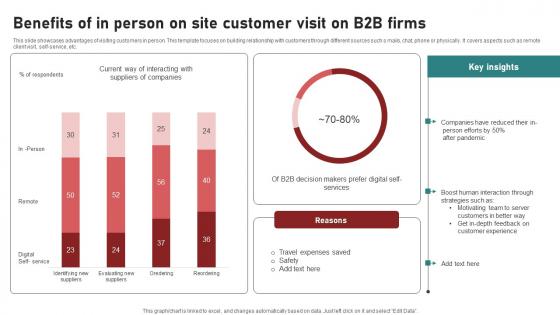
Benefits Of In Person On Site Customer Visit On B2B Firms Ppt Model Objects pdf
This slide showcases advantages of visiting customers in person. This template focuses on building relationship with customers through different sources such s mails, chat, phone or physically. It covers aspects such as remote client visit, self-service, etc. Showcasing this set of slides titled Benefits Of In Person On Site Customer Visit On B2B Firms Ppt Model Objects pdf. The topics addressed in these templates are Customer Experience, Motivating Team, Boost Human Interaction. All the content presented in this PPT design is completely editable. Download it and make adjustments in color, background, font etc. as per your unique business setting. This slide showcases advantages of visiting customers in person. This template focuses on building relationship with customers through different sources such s mails, chat, phone or physically. It covers aspects such as remote client visit, self-service, etc.
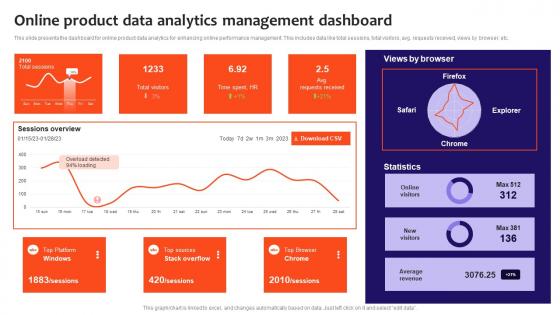
Online Product Data Analytics Management Dashboard Information Pdf
This slide presents the dashboard for online product data analytics for enhancing online performance management. This includes data like total sessions, total visitors, avg. requests received, views by browser, etc. Showcasing this set of slides titled Online Product Data Analytics Management Dashboard Information Pdf. The topics addressed in these templates are Online Product Data Analytics, Management Dashboard. All the content presented in this PPT design is completely editable. Download it and make adjustments in color, background, font etc. as per your unique business setting. This slide presents the dashboard for online product data analytics for enhancing online performance management. This includes data like total sessions, total visitors, avg. requests received, views by browser, etc.
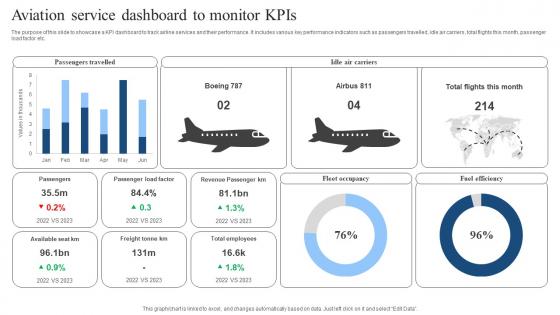
Aviation Service Dashboard To Monitor KPIs Download Pdf
The purpose of this slide to showcase a KPI dashboard to track airline services and their performance. It includes various key performance indicators such as passengers travelled, idle air carriers, total flights this month, passenger load factor etc. Pitch your topic with ease and precision using this Aviation Service Dashboard To Monitor KPIs Download Pdf. This layout presents information on Fleet Occupancy, Fuel Efficiency, Passengers Travelled. It is also available for immediate download and adjustment. So, changes can be made in the color, design, graphics or any other component to create a unique layout. The purpose of this slide to showcase a KPI dashboard to track airline services and their performance. It includes various key performance indicators such as passengers travelled, idle air carriers, total flights this month, passenger load factor etc.
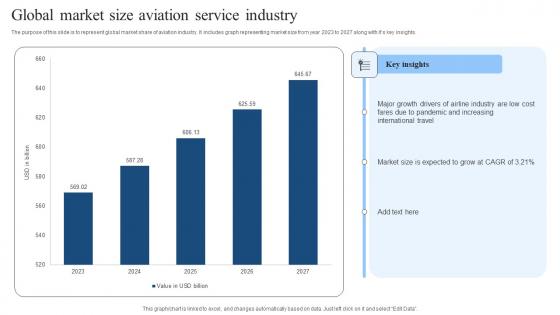
Global Market Size Aviation Service Industry Background Pdf
The purpose of this slide is to represent global market share of aviation industry. It includes graph representing market size from year 2023 to 2027 along with its key insights. Pitch your topic with ease and precision using this Global Market Size Aviation Service Industry Background Pdf. This layout presents information on Global Market Size, Aviation Service Industry. It is also available for immediate download and adjustment. So, changes can be made in the color, design, graphics or any other component to create a unique layout. The purpose of this slide is to represent global market share of aviation industry. It includes graph representing market size from year 2023 to 2027 along with its key insights.
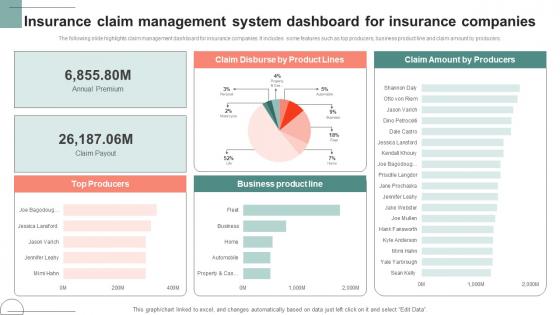
Insurance Claim Management System Dashboard For Insurance Companies Demonstration Pdf
The following slide highlights claim management dashboard for insurance companies. It includes some features such as top producers, business product line and claim amount by producers. Showcasing this set of slides titled Insurance Claim Management System Dashboard For Insurance Companies Demonstration Pdf The topics addressed in these templates are Claim Disburse, Product Lines, Business Product All the content presented in this PPT design is completely editable. Download it and make adjustments in color, background, font etc. as per your unique business setting. The following slide highlights claim management dashboard for insurance companies. It includes some features such as top producers, business product line and claim amount by producers.
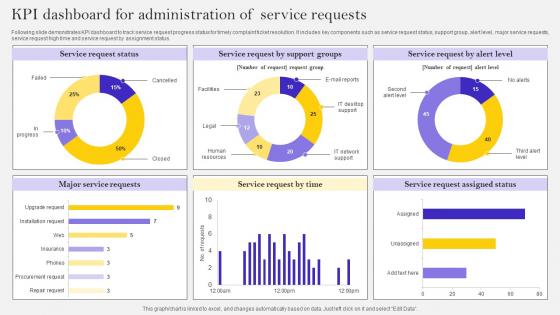
KPI Dashboard For Administration Of Service Requests Ppt Show Inspiration Pdf
Following slide demonstrates KPI dashboard to track service request progress status for timely complaint ticket resolution. It includes key components such as service request status, support group, alert level, major service requests, service request high time and service request by assignment status. Showcasing this set of slides titled KPI Dashboard For Administration Of Service Requests Ppt Show Inspiration Pdf. The topics addressed in these templates are Major Service Requests, Service Request, High Time. All the content presented in this PPT design is completely editable. Download it and make adjustments in color, background, font etc. as per your unique business setting. Following slide demonstrates KPI dashboard to track service request progress status for timely complaint ticket resolution. It includes key components such as service request status, support group, alert level, major service requests, service request high time and service request by assignment status.
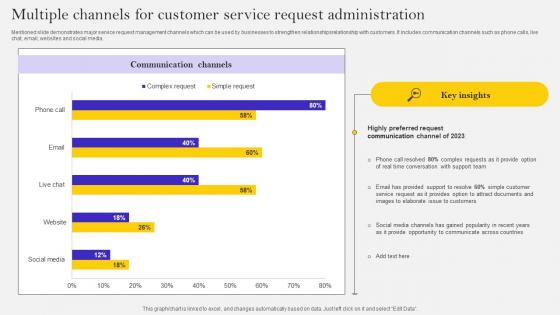
Multiple Channels For Customer Service Request Administration Ppt Ideas Themes Pdf
Mentioned slide demonstrates major service request management channels which can be used by businesses to strengthen relationshipsrelationship with customers. It includes communication channels such as phone calls, live chat, email, websites and social media. Showcasing this set of slides titled Multiple Channels For Customer Service Request Administration Ppt Ideas Themes Pdf. The topics addressed in these templates are Communication Channels, Phone Calls, Live Chat, Email. All the content presented in this PPT design is completely editable. Download it and make adjustments in color, background, font etc. as per your unique business setting. Mentioned slide demonstrates major service request management channels which can be used by businesses to strengthen relationshipsrelationship with customers. It includes communication channels such as phone calls, live chat, email, websites and social media.
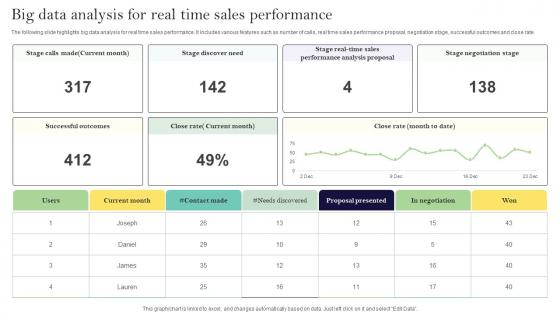
Big Data Analysis For Real Time Sales Performance Ppt Show Format Ideas Pdf
The following slide highlights big data analysis for real time sales performance. It includes various features such as number of calls, real time sales performance proposal, negotiation stage, successful outcomes and close rate. Showcasing this set of slides titled Big Data Analysis For Real Time Sales Performance Ppt Show Format Ideas Pdf. The topics addressed in these templates are Negotiation Stage, Successful Outcomes, Close Rate. All the content presented in this PPT design is completely editable. Download it and make adjustments in color, background, font etc. as per your unique business setting. The following slide highlights big data analysis for real time sales performance. It includes various features such as number of calls, real time sales performance proposal, negotiation stage, successful outcomes and close rate.


 Continue with Email

 Home
Home


