Resource Plan
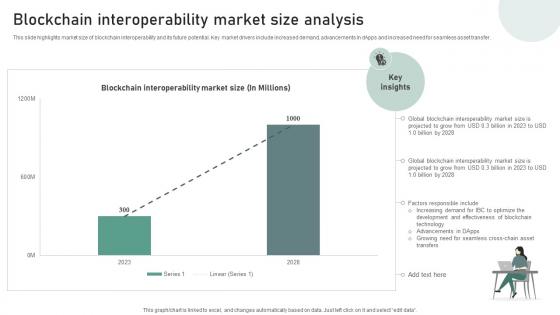
A129 Bridging Blockchains A Deep Dive Blockchain Interoperability Market Size Analysis BCT SS V
This slide highlights market size of blockchain interoperability and its future potential. Key market drivers include increased demand, advancements in dApps and increased need for seamless asset transfer. Find a pre-designed and impeccable A129 Bridging Blockchains A Deep Dive Blockchain Interoperability Market Size Analysis BCT SS V. The templates can ace your presentation without additional effort. You can download these easy-to-edit presentation templates to make your presentation stand out from others. So, what are you waiting for Download the template from Slidegeeks today and give a unique touch to your presentation. This slide highlights market size of blockchain interoperability and its future potential. Key market drivers include increased demand, advancements in dApps and increased need for seamless asset transfer.
Effective Data Migration Cloud Migration And Network Performance Tracking
This slide showcases dashboards for monitoring cloud network performance based on KPI such as on premises data center performance, cloud traffic, private cloud performance. Present like a pro with Effective Data Migration Cloud Migration And Network Performance Tracking. Create beautiful presentations together with your team, using our easy-to-use presentation slides. Share your ideas in real-time and make changes on the fly by downloading our templates. So whether you are in the office, on the go, or in a remote location, you can stay in sync with your team and present your ideas with confidence. With Slidegeeks presentation got a whole lot easier. Grab these presentations today. This slide showcases dashboards for monitoring cloud network performance based on KPI such as on premises data center performance, cloud traffic, private cloud performance.
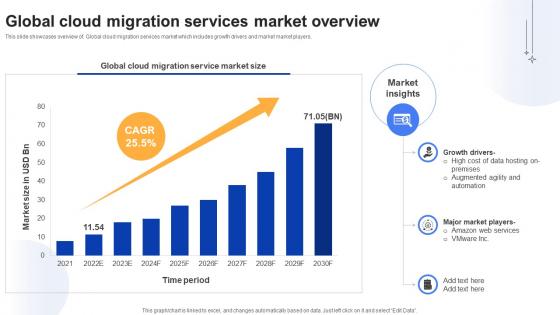
Effective Data Migration Global Cloud Migration Services Market Overview
This slide showcases overview of. Global cloud migration services market which includes growth drivers and market market players. This modern and well-arranged Effective Data Migration Global Cloud Migration Services Market Overview provides lots of creative possibilities. It is very simple to customize and edit with the Powerpoint Software. Just drag and drop your pictures into the shapes. All facets of this template can be edited with Powerpoint, no extra software is necessary. Add your own material, put your images in the places assigned for them, adjust the colors, and then you can show your slides to the world, with an animated slide included. This slide showcases overview of. Global cloud migration services market which includes growth drivers and market market players.
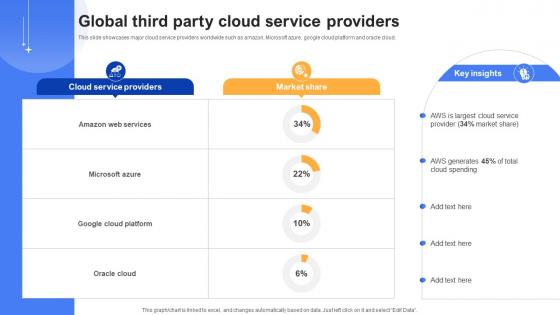
Effective Data Migration Global Third Party Cloud Service Providers
This slide showcases major cloud service providers worldwide such as amazon, Microsoft azure, google cloud platform and oracle cloud. This Effective Data Migration Global Third Party Cloud Service Providers is perfect for any presentation, be it in front of clients or colleagues. It is a versatile and stylish solution for organizing your meetings. The Effective Data Migration Global Third Party Cloud Service Providers features a modern design for your presentation meetings. The adjustable and customizable slides provide unlimited possibilities for acing up your presentation. Slidegeeks has done all the homework before launching the product for you. So, do not wait, grab the presentation templates today This slide showcases major cloud service providers worldwide such as amazon, Microsoft azure, google cloud platform and oracle cloud.
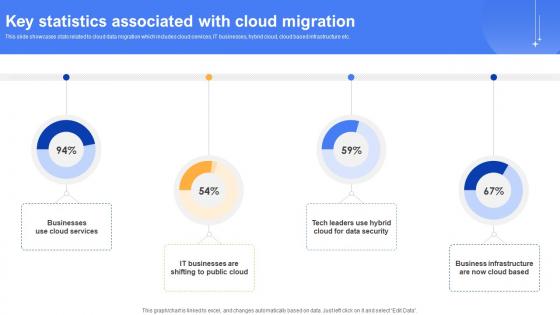
Effective Data Migration Key Statistics Associated With Cloud Migration
This slide showcases stats related to cloud data migration which includes cloud services, IT businesses, hybrid cloud, cloud based infrastructure etc. Presenting this PowerPoint presentation, titled Effective Data Migration Key Statistics Associated With Cloud Migration, with topics curated by our researchers after extensive research. This editable presentation is available for immediate download and provides attractive features when used. Download now and captivate your audience. Presenting this Effective Data Migration Key Statistics Associated With Cloud Migration. Our researchers have carefully researched and created these slides with all aspects taken into consideration. This is a completely customizable Effective Data Migration Key Statistics Associated With Cloud Migration that is available for immediate downloading. Download now and make an impact on your audience. Highlight the attractive features available with our PPTs. This slide showcases stats related to cloud data migration which includes cloud services, IT businesses, hybrid cloud, cloud based infrastructure etc.
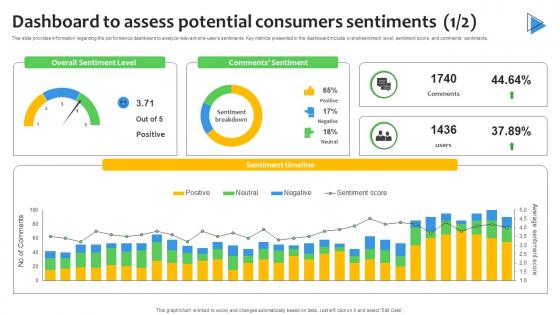
Dashboard To Assess Potential Consumers Sentiment Analysis Demystified Understanding AI SS V
This slide provides information regarding the performance dashboard to analyze relevant end-users sentiments. Key metrics presented in the dashboard include overall sentiment level, sentiment score, and comments sentiments. Do you have an important presentation coming up Are you looking for something that will make your presentation stand out from the rest Look no further than Dashboard To Assess Potential Consumers Sentiment Analysis Demystified Understanding AI SS V. With our professional designs, you can trust that your presentation will pop and make delivering it a smooth process. And with Slidegeeks, you can trust that your presentation will be unique and memorable. So why wait Grab Dashboard To Assess Potential Consumers Sentiment Analysis Demystified Understanding AI SS V today and make your presentation stand out from the rest This slide provides information regarding the performance dashboard to analyze relevant end-users sentiments. Key metrics presented in the dashboard include overall sentiment level, sentiment score, and comments sentiments.
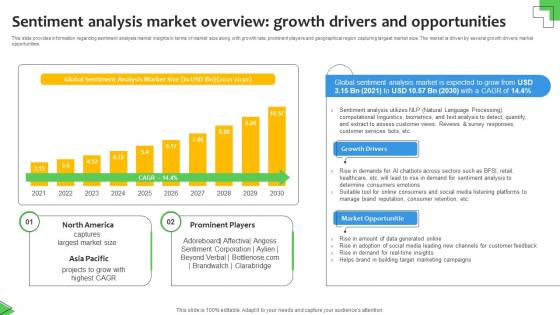
Sentiment Analysis Market Overview Growth Sentiment Analysis Demystified Understanding AI SS V
This slide provides information regarding sentiment analysis market insights in terms of market size along with growth rate, prominent players and geographical region capturing largest market size. The market is driven by several growth drivers, market opportunities. Do you have an important presentation coming up Are you looking for something that will make your presentation stand out from the rest Look no further than Sentiment Analysis Market Overview Growth Sentiment Analysis Demystified Understanding AI SS V. With our professional designs, you can trust that your presentation will pop and make delivering it a smooth process. And with Slidegeeks, you can trust that your presentation will be unique and memorable. So why wait Grab Sentiment Analysis Market Overview Growth Sentiment Analysis Demystified Understanding AI SS V today and make your presentation stand out from the rest This slide provides information regarding sentiment analysis market insights in terms of market size along with growth rate, prominent players and geographical region capturing largest market size. The market is driven by several growth drivers, market opportunities.
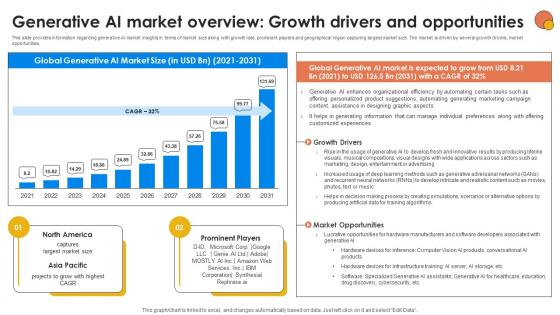
Generative AI Market Overview Growth Generative AI For Better Productivity AI SS V
This slide provides information regarding generative AI market insights in terms of market size along with growth rate, prominent players and geographical region capturing largest market size. The market is driven by several growth drivers, market opportunities. Explore a selection of the finest Generative AI Market Overview Growth Generative AI For Better Productivity AI SS V here. With a plethora of professionally designed and pre-made slide templates, you can quickly and easily find the right one for your upcoming presentation. You can use our Generative AI Market Overview Growth Generative AI For Better Productivity AI SS V to effectively convey your message to a wider audience. Slidegeeks has done a lot of research before preparing these presentation templates. The content can be personalized and the slides are highly editable. Grab templates today from Slidegeeks. This slide provides information regarding generative AI market insights in terms of market size along with growth rate, prominent players and geographical region capturing largest market size. The market is driven by several growth drivers, market opportunities.
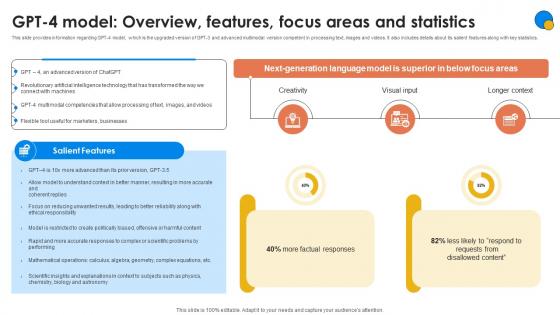
GPT 4 Model Overview Features Focus Generative AI For Better Productivity AI SS V
This slide provides information regarding GPT-4 model, which is the upgraded version of GPT-3 and advanced multimodal version competent in processing text, images and videos. It also includes details about its salient features along with key statistics. The GPT 4 Model Overview Features Focus Generative AI For Better Productivity AI SS V is a compilation of the most recent design trends as a series of slides. It is suitable for any subject or industry presentation, containing attractive visuals and photo spots for businesses to clearly express their messages. This template contains a variety of slides for the user to input data, such as structures to contrast two elements, bullet points, and slides for written information. Slidegeeks is prepared to create an impression. This slide provides information regarding GPT-4 model, which is the upgraded version of GPT-3 and advanced multimodal version competent in processing text, images and videos. It also includes details about its salient features along with key statistics.

Decreasing Profit Margins Over Quarters Implementing Personnel Downsizing Initiative
This slide shows decreasing profit margins over the quarters of the year for the organization along with the key insights highlighting the major reasons for the same. There are so many reasons you need a Decreasing Profit Margins Over Quarters Implementing Personnel Downsizing Initiative. The first reason is you can not spend time making everything from scratch, Thus, Slidegeeks has made presentation templates for you too. You can easily download these templates from our website easily. This slide shows decreasing profit margins over the quarters of the year for the organization along with the key insights highlighting the major reasons for the same
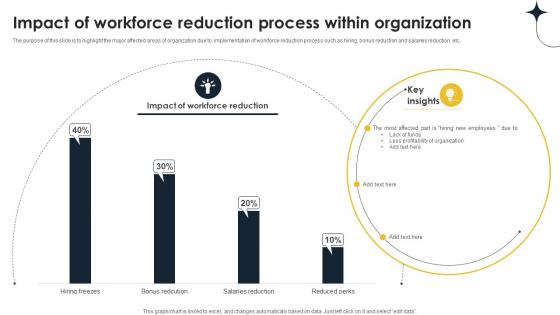
Impact Of Workforce Reduction Process Within Implementing Personnel Downsizing Initiative
The purpose of this slide is to highlight the major affected areas of organization due to implementation of workforce reduction process such as hiring, bonus reduction and salaries reduction, etc. Crafting an eye-catching presentation has never been more straightforward. Let your presentation shine with this tasteful yet straightforward Impact Of Workforce Reduction Process Within Implementing Personnel Downsizing Initiative template. It offers a minimalistic and classy look that is great for making a statement. The colors have been employed intelligently to add a bit of playfulness while still remaining professional. Construct the ideal Impact Of Workforce Reduction Process Within Implementing Personnel Downsizing Initiative that effortlessly grabs the attention of your audience Begin now and be certain to wow your customers The purpose of this slide is to highlight the major affected areas of organization due to implementation of workforce reduction process such as hiring, bonus reduction and salaries reduction, etc.

Increasing Employee Turnover Expenses Over Implementing Personnel Downsizing Initiative
This slide shows increasing employee turnover rates due to increase in project management conflicts in the organization over the four quarters in a year Formulating a presentation can take up a lot of effort and time, so the content and message should always be the primary focus. The visuals of the PowerPoint can enhance the presenters message, so our Increasing Employee Turnover Expenses Over Implementing Personnel Downsizing Initiative was created to help save time. Instead of worrying about the design, the presenter can concentrate on the message while our designers work on creating the ideal templates for whatever situation is needed. Slidegeeks has experts for everything from amazing designs to valuable content, we have put everything into Increasing Employee Turnover Expenses Over Implementing Personnel Downsizing Initiative This slide shows increasing employee turnover rates due to increase in project management conflicts in the organization over the four quarters in a year
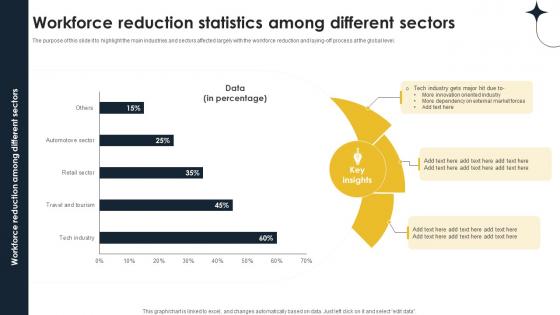
Workforce Reduction Statistics Among Different Implementing Personnel Downsizing Initiative
The purpose of this slide it to highlight the main industries and sectors affected largely with the workforce reduction and laying-off process at the global level. Take your projects to the next level with our ultimate collection of Workforce Reduction Statistics Among Different Implementing Personnel Downsizing Initiative. Slidegeeks has designed a range of layouts that are perfect for representing task or activity duration, keeping track of all your deadlines at a glance. Tailor these designs to your exact needs and give them a truly corporate look with your own brand colors they will make your projects stand out from the rest The purpose of this slide it to highlight the main industries and sectors affected largely with the workforce reduction and laying-off process at the global level.
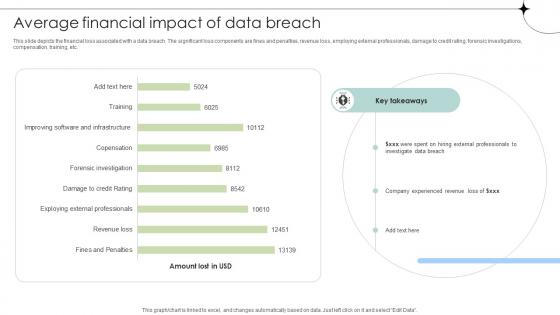
Average Financial Impact Of Data Breach Data Fortification Strengthening Defenses
This slide depicts the financial loss associated with a data breach. The significant loss components are fines and penalties, revenue loss, employing external professionals, damage to credit rating, forensic investigations, compensation, training, etc.There are so many reasons you need a Average Financial Impact Of Data Breach Data Fortification Strengthening Defenses. The first reason is you can not spend time making everything from scratch, Thus, Slidegeeks has made presentation templates for you too. You can easily download these templates from our website easily. This slide depicts the financial loss associated with a data breach. The significant loss components are fines and penalties, revenue loss, employing external professionals, damage to credit rating, forensic investigations, compensation, training, etc.
Data Breach Prevention Status Tracking Dashboard Data Fortification Strengthening Defenses
This slide represents the critical cyber security performance indicators for the organization. The key components include application health, encryption status, license consumption, windows defender, etc.Are you in need of a template that can accommodate all of your creative concepts This one is crafted professionally and can be altered to fit any style. Use it with Google Slides or PowerPoint. Include striking photographs, symbols, depictions, and other visuals. Fill, move around, or remove text boxes as desired. Test out color palettes and font mixtures. Edit and save your work, or work with colleagues. Download Data Breach Prevention Status Tracking Dashboard Data Fortification Strengthening Defenses and observe how to make your presentation outstanding. Give an impeccable presentation to your group and make your presentation unforgettable. This slide represents the critical cyber security performance indicators for the organization. The key components include application health, encryption status, license consumption, windows defender, etc.
Security Breach Events Tracking Dashboard Data Fortification Strengthening Defenses
This slide represents the dashboard to track data breach attacks. The purpose of this slide is to provide a graphical representation of cyber attacks that occurred in a specific period. It also depicts the overview of different types of attacks.Create an editable Security Breach Events Tracking Dashboard Data Fortification Strengthening Defenses that communicates your idea and engages your audience. Whether you are presenting a business or an educational presentation, pre-designed presentation templates help save time. Security Breach Events Tracking Dashboard Data Fortification Strengthening Defenses is highly customizable and very easy to edit, covering many different styles from creative to business presentations. Slidegeeks has creative team members who have crafted amazing templates. So, go and get them without any delay. This slide represents the dashboard to track data breach attacks. The purpose of this slide is to provide a graphical representation of cyber attacks that occurred in a specific period. It also depicts the overview of different types of attacks.
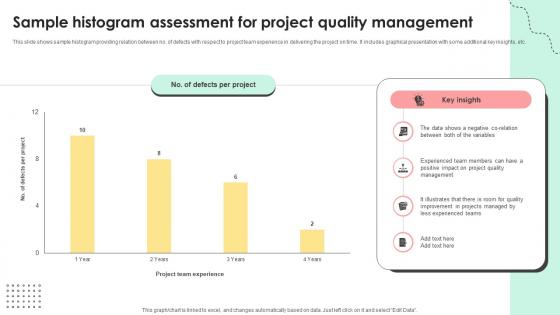
Administering Quality Assurance Sample Histogram Assessment For Project Quality Management PM SS V
This slide shows sample histogram providing relation between no. of defects with respect to project team experience in delivering the project on time. It includes graphical presentation with some additional key insights, etc. Present like a pro with Administering Quality Assurance Sample Histogram Assessment For Project Quality Management PM SS V. Create beautiful presentations together with your team, using our easy-to-use presentation slides. Share your ideas in real-time and make changes on the fly by downloading our templates. So whether you are in the office, on the go, or in a remote location, you can stay in sync with your team and present your ideas with confidence. With Slidegeeks presentation got a whole lot easier. Grab these presentations today. This slide shows sample histogram providing relation between no. of defects with respect to project team experience in delivering the project on time. It includes graphical presentation with some additional key insights, etc.

Global Data Security Industry Report Geographical Analysis For Cybersecurity Industry IR SS V
The slide highlights the geographical summary of current state of cybersecurity industry. The purpose of the slide is to provide insights on cybersecurity landscape, trends, development at regional levels. It helps stakeholders in understanding the market dynamics, regulatory environments and potential growth opportunities. If your project calls for a presentation, then Slidegeeks is your go-to partner because we have professionally designed, easy-to-edit templates that are perfect for any presentation. After downloading, you can easily edit Global Data Security Industry Report Geographical Analysis For Cybersecurity Industry IR SS V and make the changes accordingly. You can rearrange slides or fill them with different images. Check out all the handy templates The slide highlights the geographical summary of current state of cybersecurity industry. The purpose of the slide is to provide insights on cybersecurity landscape, trends, development at regional levels. It helps stakeholders in understanding the market dynamics, regulatory environments and potential growth opportunities.
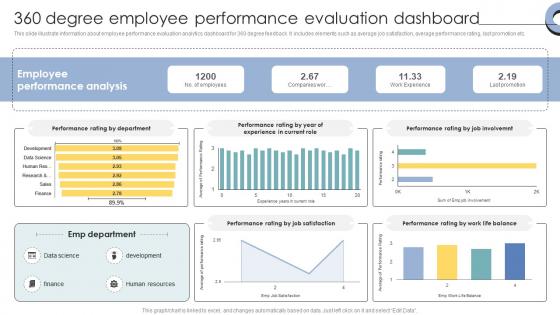
Skill Enhancement Performance 360 Degree Employee Performance Evaluation Dashboard
This slide illustrate information about employee performance evaluation analytics dashboard for 360 degree feedback. It includes elements such as average job satisfaction, average performance rating, last promotion etc. If your project calls for a presentation, then Slidegeeks is your go-to partner because we have professionally designed, easy-to-edit templates that are perfect for any presentation. After downloading, you can easily edit Skill Enhancement Performance 360 Degree Employee Performance Evaluation Dashboard and make the changes accordingly. You can rearrange slides or fill them with different images. Check out all the handy templates This slide illustrate information about employee performance evaluation analytics dashboard for 360 degree feedback. It includes elements such as average job satisfaction, average performance rating, last promotion etc.
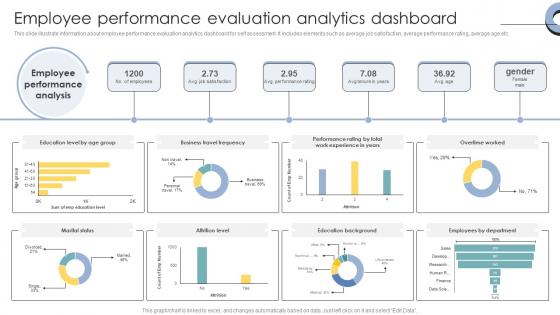
Skill Enhancement Performance Employee Performance Evaluation Analytics Dashboard
This slide illustrate information about employee performance evaluation analytics dashboard for self assessment. It includes elements such as average job satisfaction, average performance rating, average age etc. Presenting this PowerPoint presentation, titled Skill Enhancement Performance Employee Performance Evaluation Analytics Dashboard, with topics curated by our researchers after extensive research. This editable presentation is available for immediate download and provides attractive features when used. Download now and captivate your audience. Presenting this Skill Enhancement Performance Employee Performance Evaluation Analytics Dashboard. Our researchers have carefully researched and created these slides with all aspects taken into consideration. This is a completely customizable Skill Enhancement Performance Employee Performance Evaluation Analytics Dashboard that is available for immediate downloading. Download now and make an impact on your audience. Highlight the attractive features available with our PPTs. This slide illustrate information about employee performance evaluation analytics dashboard for self assessment. It includes elements such as average job satisfaction, average performance rating, average age etc.
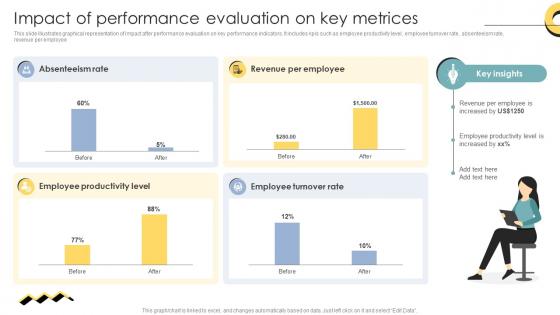
Skill Enhancement Performance Impact Of Performance Evaluation On Key Metrices
This slide illustrates graphical representation of impact after performance evaluation on key performance indicators. It includes kpis such as employee productivity level, employee turnover rate, absenteeism rate, revenue per employee. Do you have to make sure that everyone on your team knows about any specific topic I yes, then you should give Skill Enhancement Performance Impact Of Performance Evaluation On Key Metrices a try. Our experts have put a lot of knowledge and effort into creating this impeccable Skill Enhancement Performance Impact Of Performance Evaluation On Key Metrices. You can use this template for your upcoming presentations, as the slides are perfect to represent even the tiniest detail. You can download these templates from the Slidegeeks website and these are easy to edit. So grab these today This slide illustrates graphical representation of impact after performance evaluation on key performance indicators. It includes kpis such as employee productivity level, employee turnover rate, absenteeism rate, revenue per employee.
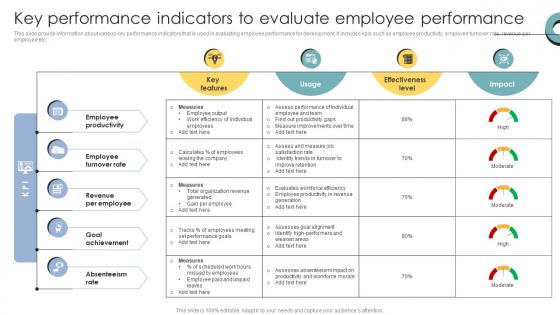
Skill Enhancement Performance Key Performance Indicators To Evaluate Employee Performance
This slide provide information about various key performance indicators that is used in evaluating employee performance for development. It includes kpis such as employee productivity, employee turnover rate, revenue per employee etc. Get a simple yet stunning designed Skill Enhancement Performance Key Performance Indicators To Evaluate Employee Performance. It is the best one to establish the tone in your meetings. It is an excellent way to make your presentations highly effective. So, download this PPT today from Slidegeeks and see the positive impacts. Our easy-to-edit Skill Enhancement Performance Key Performance Indicators To Evaluate Employee Performance can be your go-to option for all upcoming conferences and meetings. So, what are you waiting for Grab this template today. This slide provide information about various key performance indicators that is used in evaluating employee performance for development. It includes kpis such as employee productivity, employee turnover rate, revenue per employee etc.

Skill Enhancement Performance Organization Staff Performance Evaluation Dashboard
This slide illustrate dashboard for staff performance evaluation for boosting performance level. it includes elements such as average employee age, average employee tenure, gender diversity ratio etc. Slidegeeks is here to make your presentations a breeze with Skill Enhancement Performance Organization Staff Performance Evaluation Dashboard With our easy-to-use and customizable templates, you can focus on delivering your ideas rather than worrying about formatting. With a variety of designs to choose from, you are sure to find one that suits your needs. And with animations and unique photos, illustrations, and fonts, you can make your presentation pop. So whether you are giving a sales pitch or presenting to the board, make sure to check out Slidegeeks first This slide illustrate dashboard for staff performance evaluation for boosting performance level. it includes elements such as average employee age, average employee tenure, gender diversity ratio etc.
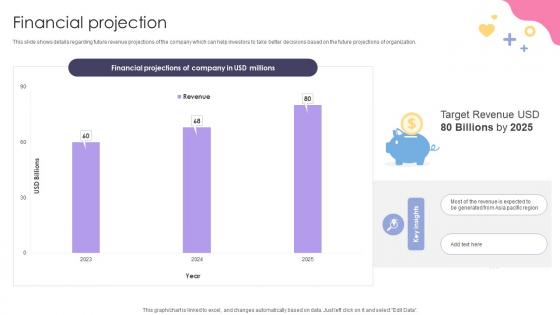
Financial Projection Social Media Application Development Company Fundraising Pitch Deck
This slide shows details regarding future revenue projections of the company which can help investors to take better decisions based on the future projections of organization. Slidegeeks is here to make your presentations a breeze with Financial Projection Social Media Application Development Company Fundraising Pitch Deck With our easy-to-use and customizable templates, you can focus on delivering your ideas rather than worrying about formatting. With a variety of designs to choose from, you are sure to find one that suits your needs. And with animations and unique photos, illustrations, and fonts, you can make your presentation pop. So whether you are giving a sales pitch or presenting to the board, make sure to check out Slidegeeks first This slide shows details regarding future revenue projections of the company which can help investors to take better decisions based on the future projections of organization.

Market Potential Social Media Application Development Company Fundraising Pitch Deck
This slide shows information regarding the market potential or opportunity for the company available in current market. It also includes details regarding compound annual growth rate. Are you in need of a template that can accommodate all of your creative concepts This one is crafted professionally and can be altered to fit any style. Use it with Google Slides or PowerPoint. Include striking photographs, symbols, depictions, and other visuals. Fill, move around, or remove text boxes as desired. Test out color palettes and font mixtures. Edit and save your work, or work with colleagues. Download Market Potential Social Media Application Development Company Fundraising Pitch Deck and observe how to make your presentation outstanding. Give an impeccable presentation to your group and make your presentation unforgettable. This slide shows information regarding the market potential or opportunity for the company available in current market. It also includes details regarding compound annual growth rate.
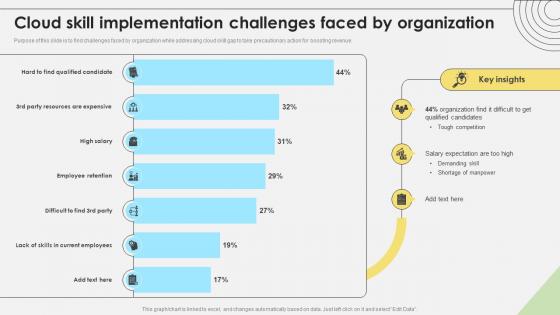
Workforce Competency Enhancement Cloud Skill Implementation Challenges Faced By Organization DTE SS V
Purpose of this slide is to find challenges faced by organization while addressing cloud skill gap to take precautionary action for boosting revenue. Present like a pro with Workforce Competency Enhancement Cloud Skill Implementation Challenges Faced By Organization DTE SS V. Create beautiful presentations together with your team, using our easy-to-use presentation slides. Share your ideas in real-time and make changes on the fly by downloading our templates. So whether you are in the office, on the go, or in a remote location, you can stay in sync with your team and present your ideas with confidence. With Slidegeeks presentation got a whole lot easier. Grab these presentations today. Purpose of this slide is to find challenges faced by organization while addressing cloud skill gap to take precautionary action for boosting revenue.
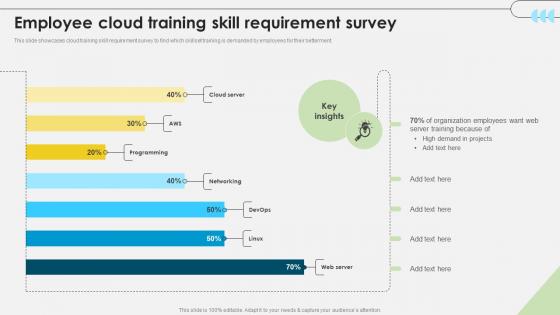
Workforce Competency Enhancement Employee Cloud Training Skill Requirement Survey DTE SS V
This slide showcases cloud training skill requirement survey to find which skillset training is demanded by employees for their betterment. Are you in need of a template that can accommodate all of your creative concepts This one is crafted professionally and can be altered to fit any style. Use it with Google Slides or PowerPoint. Include striking photographs, symbols, depictions, and other visuals. Fill, move around, or remove text boxes as desired. Test out color palettes and font mixtures. Edit and save your work, or work with colleagues. Download Workforce Competency Enhancement Employee Cloud Training Skill Requirement Survey DTE SS V and observe how to make your presentation outstanding. Give an impeccable presentation to your group and make your presentation unforgettable. This slide showcases cloud training skill requirement survey to find which skillset training is demanded by employees for their betterment.

Workforce Competency Enhancement Impact Of Cloud Training On Organization Performance DTE SS V
This slide illustrate impact of cloud training on organization performance such as decrease in project delays, high conversion rate etc. Formulating a presentation can take up a lot of effort and time, so the content and message should always be the primary focus. The visuals of the PowerPoint can enhance the presenters message, so our Workforce Competency Enhancement Impact Of Cloud Training On Organization Performance DTE SS V was created to help save time. Instead of worrying about the design, the presenter can concentrate on the message while our designers work on creating the ideal templates for whatever situation is needed. Slidegeeks has experts for everything from amazing designs to valuable content, we have put everything into Workforce Competency Enhancement Impact Of Cloud Training On Organization Performance DTE SS V This slide illustrate impact of cloud training on organization performance such as decrease in project delays, high conversion rate etc.
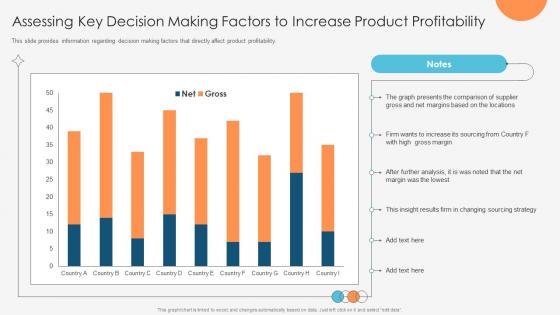
Enhancing Profitability Modelling Assessing Key Decision Making Factors To Increase Product Profitability
This slide provides information regarding decision making factors that directly affect product profitability. There are so many reasons you need a Enhancing Profitability Modelling Assessing Key Decision Making Factors To Increase Product Profitability. The first reason is you can not spend time making everything from scratch, Thus, Slidegeeks has made presentation templates for you too. You can easily download these templates from our website easily. This slide provides information regarding decision making factors that directly affect product profitability.
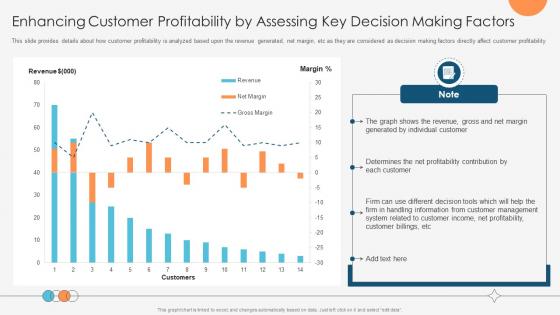
Enhancing Profitability Modelling Enhancing Customer Profitability By Assessing Key Decision Making
This slide provides details about how customer profitability is analyzed based upon the revenue generated, net margin, etc as they are considered as decision making factors directly affect customer profitability. Find highly impressive Enhancing Profitability Modelling Enhancing Customer Profitability By Assessing Key Decision Making on Slidegeeks to deliver a meaningful presentation. You can save an ample amount of time using these presentation templates. No need to worry to prepare everything from scratch because Slidegeeks experts have already done a huge research and work for you. You need to download Enhancing Profitability Modelling Enhancing Customer Profitability By Assessing Key Decision Making for your upcoming presentation. All the presentation templates are 100 percent editable and you can change the color and personalize the content accordingly. Download now This slide provides details about how customer profitability is analyzed based upon the revenue generated, net margin, etc as they are considered as decision making factors directly affect customer profitability
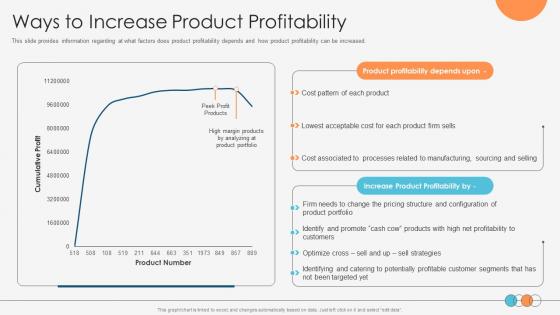
Enhancing Profitability Modelling Ways To Increase Product Profitability
This slide provides information regarding at what factors does product profitability depends and how product profitability can be increased. This modern and well-arranged Enhancing Profitability Modelling Ways To Increase Product Profitability provides lots of creative possibilities. It is very simple to customize and edit with the Powerpoint Software. Just drag and drop your pictures into the shapes. All facets of this template can be edited with Powerpoint, no extra software is necessary. Add your own material, put your images in the places assigned for them, adjust the colors, and then you can show your slides to the world, with an animated slide included. This slide provides information regarding at what factors does product profitability depends and how product profitability can be increased.
A136 Vendor Management Audit KPI Dashboard For Tracking Supplier Compliance
Mentioned slide demonstrates KPI dashboard for evaluating supplier compliance and performance. It includes key components such as total suppliers, contracts, unlisted, contact compliance rate. Find a pre-designed and impeccable A136 Vendor Management Audit KPI Dashboard For Tracking Supplier Compliance. The templates can ace your presentation without additional effort. You can download these easy-to-edit presentation templates to make your presentation stand out from others. So, what are you waiting for Download the template from Slidegeeks today and give a unique touch to your presentation. Mentioned slide demonstrates KPI dashboard for evaluating supplier compliance and performance. It includes key components such as total suppliers, contracts, unlisted, contact compliance rate.
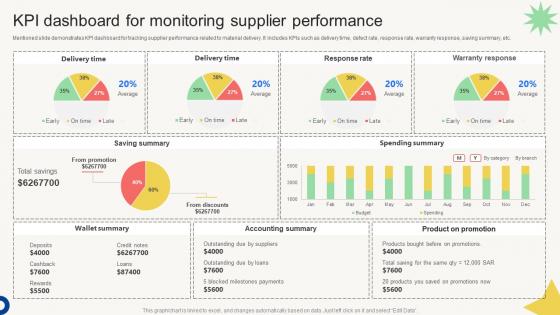
Vendor Management Audit KPI Dashboard For Monitoring Supplier Performance
Mentioned slide demonstrates KPI dashboard for tracking supplier performance related to material delivery. It includes KPIs such as delivery time, defect rate, response rate, warranty response, saving summary, etc. This modern and well-arranged Vendor Management Audit KPI Dashboard For Monitoring Supplier Performance provides lots of creative possibilities. It is very simple to customize and edit with the Powerpoint Software. Just drag and drop your pictures into the shapes. All facets of this template can be edited with Powerpoint, no extra software is necessary. Add your own material, put your images in the places assigned for them, adjust the colors, and then you can show your slides to the world, with an animated slide included. Mentioned slide demonstrates KPI dashboard for tracking supplier performance related to material delivery. It includes KPIs such as delivery time, defect rate, response rate, warranty response, saving summary, etc.
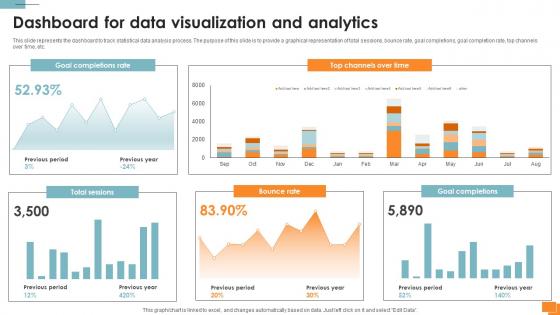
Statistical Tools For Evidence Dashboard For Data Visualization And Analytics
This slide represents the dashboard to track statistical data analysis process. The purpose of this slide is to provide a graphical representation of total sessions, bounce rate, goal completions, goal completion rate, top channels over time, etc. Are you in need of a template that can accommodate all of your creative concepts This one is crafted professionally and can be altered to fit any style. Use it with Google Slides or PowerPoint. Include striking photographs, symbols, depictions, and other visuals. Fill, move around, or remove text boxes as desired. Test out color palettes and font mixtures. Edit and save your work, or work with colleagues. Download Statistical Tools For Evidence Dashboard For Data Visualization And Analytics and observe how to make your presentation outstanding. Give an impeccable presentation to your group and make your presentation unforgettable. This slide represents the dashboard to track statistical data analysis process. The purpose of this slide is to provide a graphical representation of total sessions, bounce rate, goal completions, goal completion rate, top channels over time, etc.
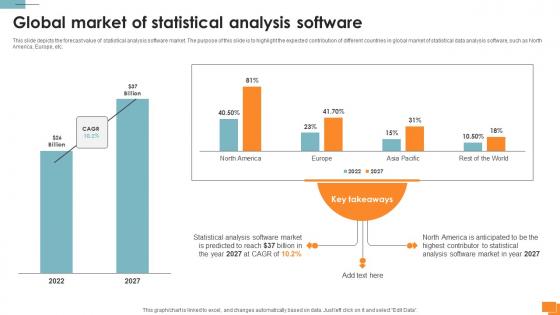
Statistical Tools For Evidence Global Market Of Statistical Analysis Software
This slide depicts the forecast value of statistical analysis software market. The purpose of this slide is to highlight the expected contribution of different countries in global market of statistical data analysis software, such as North America, Europe, etc. This modern and well-arranged Statistical Tools For Evidence Global Market Of Statistical Analysis Software provides lots of creative possibilities. It is very simple to customize and edit with the Powerpoint Software. Just drag and drop your pictures into the shapes. All facets of this template can be edited with Powerpoint, no extra software is necessary. Add your own material, put your images in the places assigned for them, adjust the colors, and then you can show your slides to the world, with an animated slide included. This slide depicts the forecast value of statistical analysis software market. The purpose of this slide is to highlight the expected contribution of different countries in global market of statistical data analysis software, such as North America, Europe, etc.
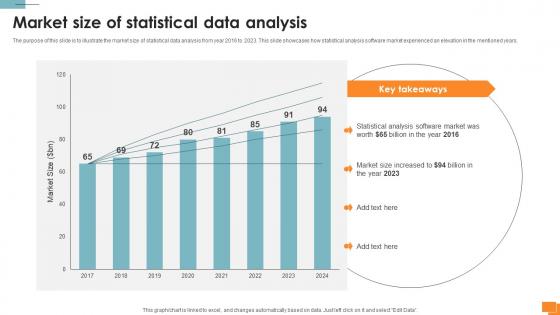
Statistical Tools For Evidence Market Size Of Statistical Data Analysis
The purpose of this slide is to illustrate the market size of statistical data analysis from year 2016 to 2023. This slide showcases how statistical analysis software market experienced an elevation in the mentioned years. Retrieve professionally designed Statistical Tools For Evidence Market Size Of Statistical Data Analysis to effectively convey your message and captivate your listeners. Save time by selecting pre-made slideshows that are appropriate for various topics, from business to educational purposes. These themes come in many different styles, from creative to corporate, and all of them are easily adjustable and can be edited quickly. Access them as PowerPoint templates or as Google Slides themes. You do not have to go on a hunt for the perfect presentation because Slidegeeks got you covered from everywhere. The purpose of this slide is to illustrate the market size of statistical data analysis from year 2016 to 2023. This slide showcases how statistical analysis software market experienced an elevation in the mentioned years.
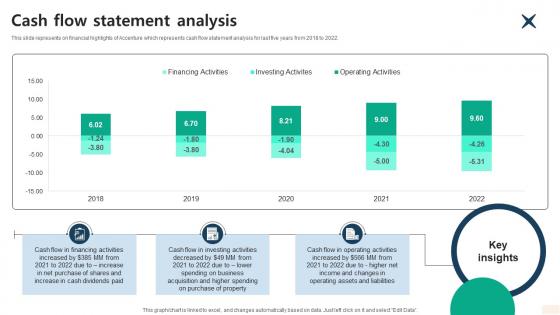
Cash Flow Statement Analysis Global Consulting And Technology Services Company Profile CP SS V
This slide represents on financial highlights of Accenture which represents cash flow statement analysis for last five years from 2018 to 2022.There are so many reasons you need a Cash Flow Statement Analysis Global Consulting And Technology Services Company Profile CP SS V. The first reason is you can not spend time making everything from scratch, Thus, Slidegeeks has made presentation templates for you too. You can easily download these templates from our website easily. This slide represents on financial highlights of Accenture which represents cash flow statement analysis for last five years from 2018 to 2022.

Cultural Diversity Global Consulting And Technology Services Company Profile CP SS V
This slide represents cultural diversity overview for Accenture highlighting company board diversity and board tenure. It also covers information such as board committee members, diverse directors and average age for director nominee.Slidegeeks is here to make your presentations a breeze with Cultural Diversity Global Consulting And Technology Services Company Profile CP SS V With our easy-to-use and customizable templates, you can focus on delivering your ideas rather than worrying about formatting. With a variety of designs to choose from, you are sure to find one that suits your needs. And with animations and unique photos, illustrations, and fonts, you can make your presentation pop. So whether you are giving a sales pitch or presenting to the board, make sure to check out Slidegeeks first This slide represents cultural diversity overview for Accenture highlighting company board diversity and board tenure. It also covers information such as board committee members, diverse directors and average age for director nominee.
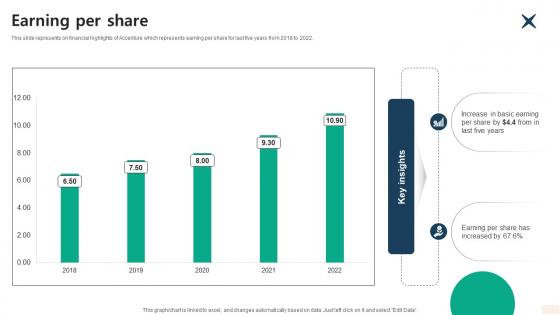
Earning Per Share Global Consulting And Technology Services Company Profile CP SS V
This slide represents on financial highlights of Accenture which represents earning per share for last five years from 2018 to 2022.Do you have an important presentation coming up Are you looking for something that will make your presentation stand out from the rest Look no further than Earning Per Share Global Consulting And Technology Services Company Profile CP SS V. With our professional designs, you can trust that your presentation will pop and make delivering it a smooth process. And with Slidegeeks, you can trust that your presentation will be unique and memorable. So why wait Grab Earning Per Share Global Consulting And Technology Services Company Profile CP SS V today and make your presentation stand out from the rest This slide represents on financial highlights of Accenture which represents earning per share for last five years from 2018 to 2022.

Employee Count Trend Global Consulting And Technology Services Company Profile CP SS V
This slide represents the employee count trend of Accenture from 2018 to 2022 year. It also covers information regarding new members added to workforce, total training hours etc.Find highly impressive Employee Count Trend Global Consulting And Technology Services Company Profile CP SS V on Slidegeeks to deliver a meaningful presentation. You can save an ample amount of time using these presentation templates. No need to worry to prepare everything from scratch because Slidegeeks experts have already done a huge research and work for you. You need to download Employee Count Trend Global Consulting And Technology Services Company Profile CP SS V for your upcoming presentation. All the presentation templates are 100 percent editable and you can change the color and personalize the content accordingly. Download now This slide represents the employee count trend of Accenture from 2018 to 2022 year. It also covers information regarding new members added to workforce, total training hours etc.

Shareholders Equity Global Consulting And Technology Services Company Profile CP SS V
This slide represents on financial highlights of Accenture, which represents shareholders equity for last five years from 2018 to 2022.The Shareholders Equity Global Consulting And Technology Services Company Profile CP SS V is a compilation of the most recent design trends as a series of slides. It is suitable for any subject or industry presentation, containing attractive visuals and photo spots for businesses to clearly express their messages. This template contains a variety of slides for the user to input data, such as structures to contrast two elements, bullet points, and slides for written information. Slidegeeks is prepared to create an impression. This slide represents on financial highlights of Accenture, which represents shareholders equity for last five years from 2018 to 2022.
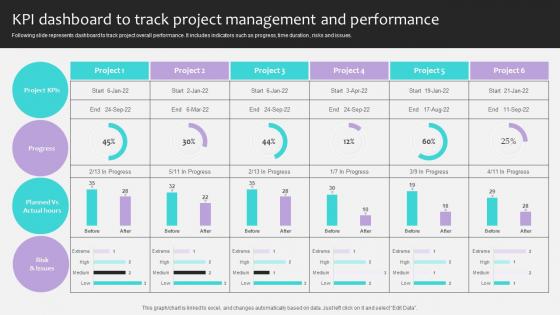
Project Stakeholders Management KPI Dashboard To Track Project Management Ppt Presentation
Following slide represents dashboard to track project overall performance. It includes indicators such as progress, time duration , risks and issues. Slidegeeks has constructed Project Stakeholders Management KPI Dashboard To Track Project Management Ppt Presentation after conducting extensive research and examination. These presentation templates are constantly being generated and modified based on user preferences and critiques from editors. Here, you will find the most attractive templates for a range of purposes while taking into account ratings and remarks from users regarding the content. This is an excellent jumping-off point to explore our content and will give new users an insight into our top-notch PowerPoint Templates. Following slide represents dashboard to track project overall performance. It includes indicators such as progress, time duration , risks and issues.
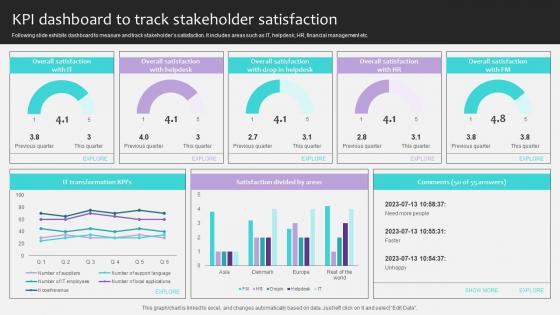
Project Stakeholders Management KPI Dashboard To Track Stakeholder Satisfaction Ppt Powerpoint
Following slide exhibits dashboard to measure and track stakeholders satisfaction. It includes areas such as IT, helpdesk, HR, financial management etc. Presenting this PowerPoint presentation, titled Project Stakeholders Management KPI Dashboard To Track Stakeholder Satisfaction Ppt Powerpoint, with topics curated by our researchers after extensive research. This editable presentation is available for immediate download and provides attractive features when used. Download now and captivate your audience. Presenting this Project Stakeholders Management KPI Dashboard To Track Stakeholder Satisfaction Ppt Powerpoint. Our researchers have carefully researched and created these slides with all aspects taken into consideration. This is a completely customizable Project Stakeholders Management KPI Dashboard To Track Stakeholder Satisfaction Ppt Powerpoint that is available for immediate downloading. Download now and make an impact on your audience. Highlight the attractive features available with our PPTs. Following slide exhibits dashboard to measure and track stakeholders satisfaction. It includes areas such as IT, helpdesk, HR, financial management etc.
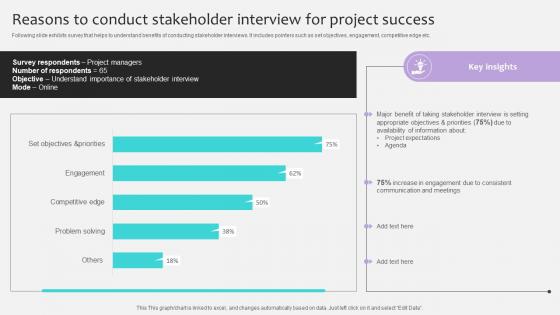
Project Stakeholders Management Reasons To Conduct Stakeholder Interview Ppt Sample
Following slide exhibits survey that helps to understand benefits of conducting stakeholder interviews. It includes pointers such as set objectives, engagement, competitive edge etc. Here you can discover an assortment of the finest PowerPoint and Google Slides templates. With these templates, you can create presentations for a variety of purposes while simultaneously providing your audience with an eye-catching visual experience. Download Project Stakeholders Management Reasons To Conduct Stakeholder Interview Ppt Sample to deliver an impeccable presentation. These templates will make your job of preparing presentations much quicker, yet still, maintain a high level of quality. Slidegeeks has experienced researchers who prepare these templates and write high-quality content for you. Later on, you can personalize the content by editing the Project Stakeholders Management Reasons To Conduct Stakeholder Interview Ppt Sample. Following slide exhibits survey that helps to understand benefits of conducting stakeholder interviews. It includes pointers such as set objectives, engagement, competitive edge etc.
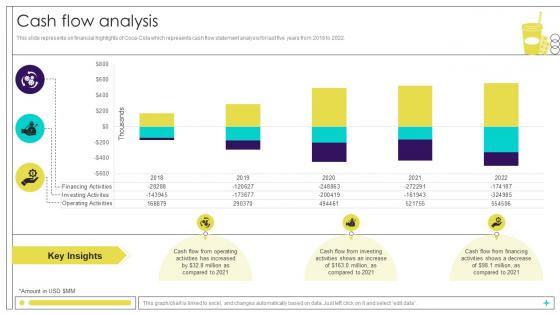
Cash Flow Analysis Beverage Manufacturer Company Profile Ppt Example CP SS V
This slide represents on financial highlights of Coca-Cola which represents cash flow statement analysis for last five years from 2018 to 2022. Do you have an important presentation coming up Are you looking for something that will make your presentation stand out from the rest Look no further than Cash Flow Analysis Beverage Manufacturer Company Profile Ppt Example CP SS V. With our professional designs, you can trust that your presentation will pop and make delivering it a smooth process. And with Slidegeeks, you can trust that your presentation will be unique and memorable. So why wait Grab Cash Flow Analysis Beverage Manufacturer Company Profile Ppt Example CP SS V today and make your presentation stand out from the rest This slide represents on financial highlights of Coca-Cola which represents cash flow statement analysis for last five years from 2018 to 2022.
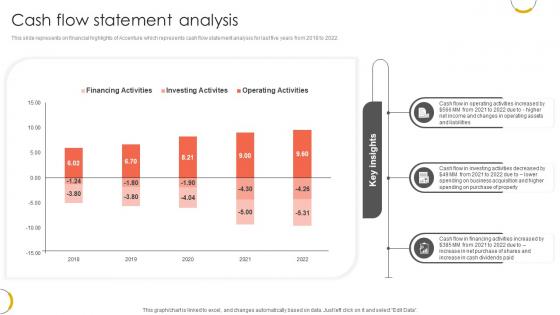
Cash Flow Statement Analysis Professional Services And Technology Consulting Ppt Example CP SS V
This slide represents on financial highlights of Accenture which represents cash flow statement analysis for last five years from 2018 to 2022. Find highly impressive Cash Flow Statement Analysis Professional Services And Technology Consulting Ppt Example CP SS V on Slidegeeks to deliver a meaningful presentation. You can save an ample amount of time using these presentation templates. No need to worry to prepare everything from scratch because Slidegeeks experts have already done a huge research and work for you. You need to download Cash Flow Statement Analysis Professional Services And Technology Consulting Ppt Example CP SS V for your upcoming presentation. All the presentation templates are 100 percent editable and you can change the color and personalize the content accordingly. Download now This slide represents on financial highlights of Accenture which represents cash flow statement analysis for last five years from 2018 to 2022.
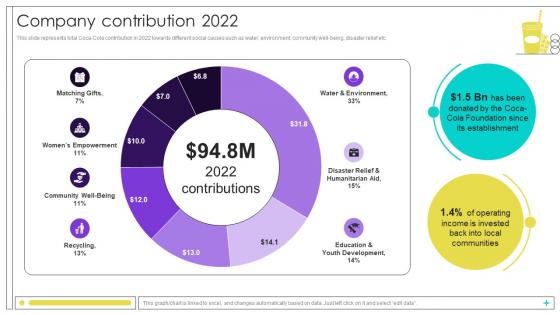
Company Contribution 2022 Beverage Manufacturer Company Profile Ppt Powerpoint CP SS V
This slide represents total Coca-Cola contribution in 2022 towards different social causes such as water, environment, community well-being, disaster relief etc. Are you in need of a template that can accommodate all of your creative concepts This one is crafted professionally and can be altered to fit any style. Use it with Google Slides or PowerPoint. Include striking photographs, symbols, depictions, and other visuals. Fill, move around, or remove text boxes as desired. Test out color palettes and font mixtures. Edit and save your work, or work with colleagues. Download Company Contribution 2022 Beverage Manufacturer Company Profile Ppt Powerpoint CP SS V and observe how to make your presentation outstanding. Give an impeccable presentation to your group and make your presentation unforgettable. This slide represents total Coca-Cola contribution in 2022 towards different social causes such as water, environment, community well-being, disaster relief etc.
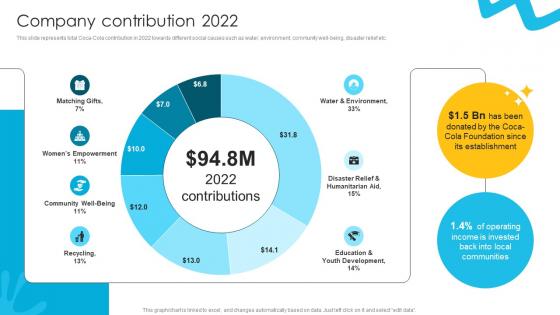
Company Contribution 2022 Liquid Refreshment Manufacturer Company Profile Ppt Template CP SS V
This slide represents total Coca-Cola contribution in 2022 towards different social causes such as water, environment, community well-being, disaster relief etc. Crafting an eye-catching presentation has never been more straightforward. Let your presentation shine with this tasteful yet straightforward Company Contribution 2022 Liquid Refreshment Manufacturer Company Profile Ppt Template CP SS V template. It offers a minimalistic and classy look that is great for making a statement. The colors have been employed intelligently to add a bit of playfulness while still remaining professional. Construct the ideal Company Contribution 2022 Liquid Refreshment Manufacturer Company Profile Ppt Template CP SS V that effortlessly grabs the attention of your audience Begin now and be certain to wow your customers This slide represents total Coca-Cola contribution in 2022 towards different social causes such as water, environment, community well-being, disaster relief etc.

Cultural Diversity Professional Services And Technology Consulting Ppt Template CP SS V
This slide represents cultural diversity overview for Accenture highlighting company board diversity and board tenure. It also covers information such as board committee members, diverse directors and average age for director nominee. Explore a selection of the finest Cultural Diversity Professional Services And Technology Consulting Ppt Template CP SS V here. With a plethora of professionally designed and pre-made slide templates, you can quickly and easily find the right one for your upcoming presentation. You can use our Cultural Diversity Professional Services And Technology Consulting Ppt Template CP SS V to effectively convey your message to a wider audience. Slidegeeks has done a lot of research before preparing these presentation templates. The content can be personalized and the slides are highly editable. Grab templates today from Slidegeeks. This slide represents cultural diversity overview for Accenture highlighting company board diversity and board tenure. It also covers information such as board committee members, diverse directors and average age for director nominee.
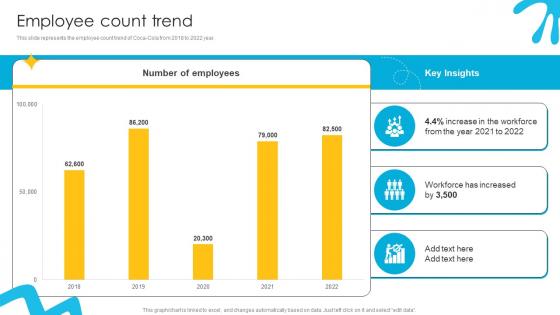
Employee Count Trend Liquid Refreshment Manufacturer Company Profile Ppt Template CP SS V
This slide represents the employee count trend of Coca-Cola from 2018 to 2022 year. Retrieve professionally designed Employee Count Trend Liquid Refreshment Manufacturer Company Profile Ppt Template CP SS V to effectively convey your message and captivate your listeners. Save time by selecting pre-made slideshows that are appropriate for various topics, from business to educational purposes. These themes come in many different styles, from creative to corporate, and all of them are easily adjustable and can be edited quickly. Access them as PowerPoint templates or as Google Slides themes. You do not have to go on a hunt for the perfect presentation because Slidegeeks got you covered from everywhere. This slide represents the employee count trend of Coca-Cola from 2018 to 2022 year.

Employee Count Trend Professional Services And Technology Consulting Ppt Template CP SS V
This slide represents the employee count trend of Accenture from 2018 to 2022 year. It also covers information regarding new members added to workforce, total training hours etc. Slidegeeks has constructed Employee Count Trend Professional Services And Technology Consulting Ppt Template CP SS V after conducting extensive research and examination. These presentation templates are constantly being generated and modified based on user preferences and critiques from editors. Here, you will find the most attractive templates for a range of purposes while taking into account ratings and remarks from users regarding the content. This is an excellent jumping-off point to explore our content and will give new users an insight into our top-notch PowerPoint Templates. This slide represents the employee count trend of Accenture from 2018 to 2022 year. It also covers information regarding new members added to workforce, total training hours etc.
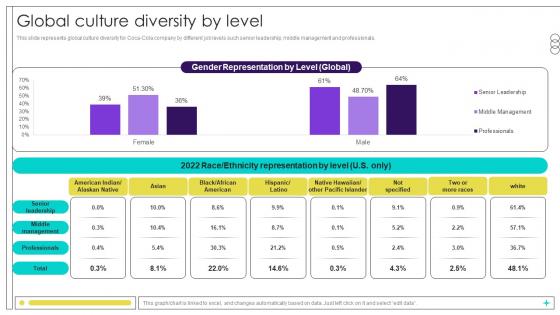
Global Culture Diversity By Level Beverage Manufacturer Company Profile Ppt Slides CP SS V
This slide represents global culture diversity for Coca-Cola company by different job levels such senior leadership, middle management and professionals. Do you know about Slidesgeeks Global Culture Diversity By Level Beverage Manufacturer Company Profile Ppt Slides CP SS V These are perfect for delivering any kind od presentation. Using it, create PowerPoint presentations that communicate your ideas and engage audiences. Save time and effort by using our pre-designed presentation templates that are perfect for a wide range of topic. Our vast selection of designs covers a range of styles, from creative to business, and are all highly customizable and easy to edit. Download as a PowerPoint template or use them as Google Slides themes. This slide represents global culture diversity for Coca-Cola company by different job levels such senior leadership, middle management and professionals.
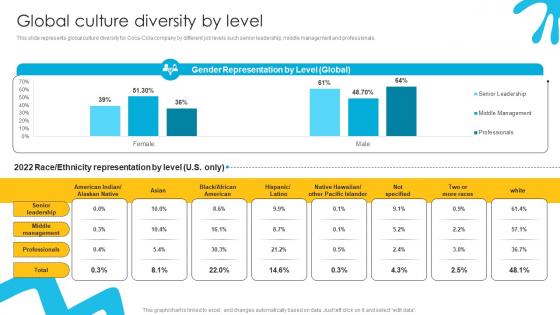
Global Culture Diversity By Level Liquid Refreshment Manufacturer Company Profile Ppt Powerpoint CP SS V
This slide represents global culture diversity for Coca-Cola company by different job levels such senior leadership, middle management and professionals. Find a pre-designed and impeccable Global Culture Diversity By Level Liquid Refreshment Manufacturer Company Profile Ppt Powerpoint CP SS V. The templates can ace your presentation without additional effort. You can download these easy-to-edit presentation templates to make your presentation stand out from others. So, what are you waiting for Download the template from Slidegeeks today and give a unique touch to your presentation. This slide represents global culture diversity for Coca-Cola company by different job levels such senior leadership, middle management and professionals.
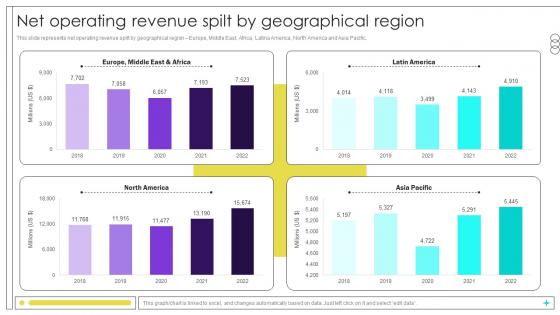
Net Operating Revenue Spilt By Geographical Region Beverage Manufacturer Company Profile Ppt Template CP SS V
This slide represents net operating revenue spilt by geographical region Europe, Middle East, Africa, Latina America, North America and Asia Pacific. Are you in need of a template that can accommodate all of your creative concepts This one is crafted professionally and can be altered to fit any style. Use it with Google Slides or PowerPoint. Include striking photographs, symbols, depictions, and other visuals. Fill, move around, or remove text boxes as desired. Test out color palettes and font mixtures. Edit and save your work, or work with colleagues. Download Net Operating Revenue Spilt By Geographical Region Beverage Manufacturer Company Profile Ppt Template CP SS V and observe how to make your presentation outstanding. Give an impeccable presentation to your group and make your presentation unforgettable. This slide represents net operating revenue spilt by geographical region Europe, Middle East, Africa, Latina America, North America and Asia Pacific.
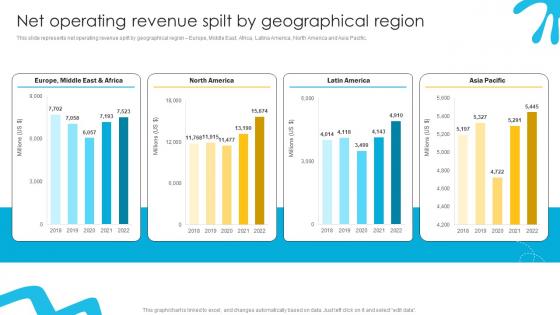
Net Operating Revenue Spilt By Liquid Refreshment Manufacturer Company Profile Ppt Example CP SS V
This slide represents net operating revenue spilt by geographical region Europe, Middle East, Africa, Latina America, North America and Asia Pacific. Crafting an eye-catching presentation has never been more straightforward. Let your presentation shine with this tasteful yet straightforward Net Operating Revenue Spilt By Liquid Refreshment Manufacturer Company Profile Ppt Example CP SS V template. It offers a minimalistic and classy look that is great for making a statement. The colors have been employed intelligently to add a bit of playfulness while still remaining professional. Construct the ideal Net Operating Revenue Spilt By Liquid Refreshment Manufacturer Company Profile Ppt Example CP SS V that effortlessly grabs the attention of your audience Begin now and be certain to wow your customers This slide represents net operating revenue spilt by geographical region Europe, Middle East, Africa, Latina America, North America and Asia Pacific.
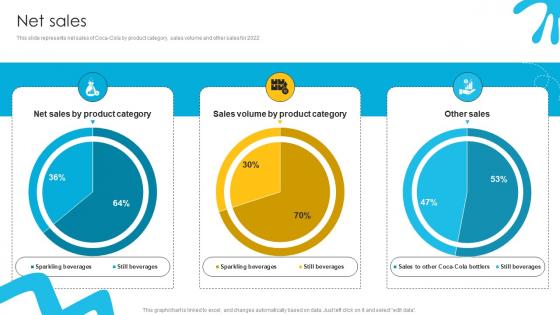
Net Sales Liquid Refreshment Manufacturer Company Profile Ppt Slides CP SS V
This slide represents net sales of Coca-Cola by product category, sales volume and other sales for 2022Formulating a presentation can take up a lot of effort and time, so the content and message should always be the primary focus. The visuals of the PowerPoint can enhance the presenters message, so our Net Sales Liquid Refreshment Manufacturer Company Profile Ppt Slides CP SS V was created to help save time. Instead of worrying about the design, the presenter can concentrate on the message while our designers work on creating the ideal templates for whatever situation is needed. Slidegeeks has experts for everything from amazing designs to valuable content, we have put everything into Net Sales Liquid Refreshment Manufacturer Company Profile Ppt Slides CP SS V. This slide represents net sales of Coca-Cola by product category, sales volume and other sales for 2022
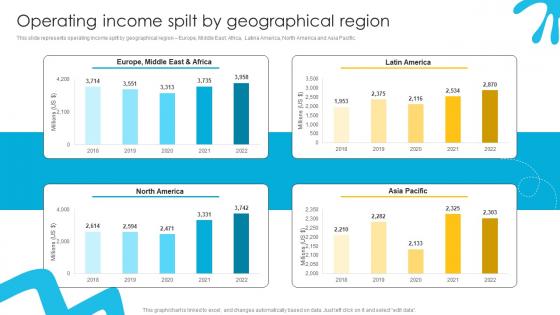
Operating Income Spilt By Geographical Liquid Refreshment Manufacturer Company Profile Ppt Example CP SS V
This slide represents operating income spilt by geographical region Europe, Middle East, Africa, Latina America, North America and Asia Pacific. Explore a selection of the finest Operating Income Spilt By Geographical Liquid Refreshment Manufacturer Company Profile Ppt Example CP SS V here. With a plethora of professionally designed and pre-made slide templates, you can quickly and easily find the right one for your upcoming presentation. You can use our Operating Income Spilt By Geographical Liquid Refreshment Manufacturer Company Profile Ppt Example CP SS V to effectively convey your message to a wider audience. Slidegeeks has done a lot of research before preparing these presentation templates. The content can be personalized and the slides are highly editable. Grab templates today from Slidegeeks. This slide represents operating income spilt by geographical region Europe, Middle East, Africa, Latina America, North America and Asia Pacific.
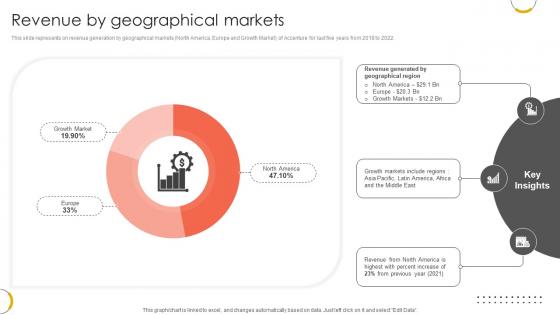
Revenue By Geographical Markets Professional Services And Technology Consulting Ppt Template CP SS V
This slide represents on revenue generation by geographical markets North America, Europe and Growth Market of Accenture for last five years from 2018 to 2022. Presenting this PowerPoint presentation, titled Revenue By Geographical Markets Professional Services And Technology Consulting Ppt Template CP SS V, with topics curated by our researchers after extensive research. This editable presentation is available for immediate download and provides attractive features when used. Download now and captivate your audience. Presenting this Revenue By Geographical Markets Professional Services And Technology Consulting Ppt Template CP SS V. Our researchers have carefully researched and created these slides with all aspects taken into consideration. This is a completely customizable Revenue By Geographical Markets Professional Services And Technology Consulting Ppt Template CP SS V that is available for immediate downloading. Download now and make an impact on your audience. Highlight the attractive features available with our PPTs. This slide represents on revenue generation by geographical markets North America, Europe and Growth Market of Accenture for last five years from 2018 to 2022.
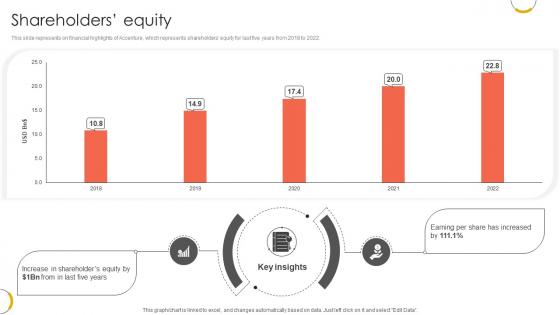
Shareholders Equity Professional Services And Technology Consulting Ppt Powerpoint CP SS V
This slide represents on financial highlights of Accenture, which represents shareholders equity for last five years from 2018 to 2022. Here you can discover an assortment of the finest PowerPoint and Google Slides templates. With these templates, you can create presentations for a variety of purposes while simultaneously providing your audience with an eye-catching visual experience. Download Shareholders Equity Professional Services And Technology Consulting Ppt Powerpoint CP SS V to deliver an impeccable presentation. These templates will make your job of preparing presentations much quicker, yet still, maintain a high level of quality. Slidegeeks has experienced researchers who prepare these templates and write high-quality content for you. Later on, you can personalize the content by editing the Shareholders Equity Professional Services And Technology Consulting Ppt Powerpoint CP SS V. This slide represents on financial highlights of Accenture, which represents shareholders equity for last five years from 2018 to 2022.
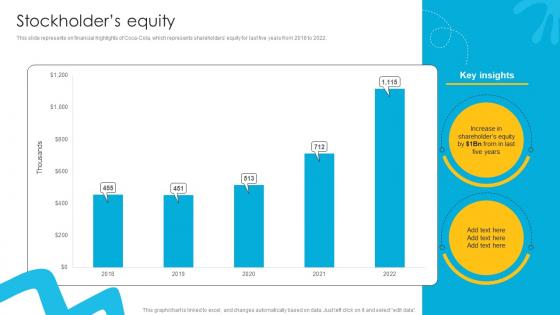
Stockholders Equity Liquid Refreshment Manufacturer Company Profile Ppt Example CP SS V
This slide represents on financial highlights of Coca-Cola, which represents shareholders equity for last five years from 2018 to 2022. Create an editable Stockholders Equity Liquid Refreshment Manufacturer Company Profile Ppt Example CP SS V that communicates your idea and engages your audience. Whether you are presenting a business or an educational presentation, pre-designed presentation templates help save time. Stockholders Equity Liquid Refreshment Manufacturer Company Profile Ppt Example CP SS V is highly customizable and very easy to edit, covering many different styles from creative to business presentations. Slidegeeks has creative team members who have crafted amazing templates. So, go and get them without any delay. This slide represents on financial highlights of Coca-Cola, which represents shareholders equity for last five years from 2018 to 2022.


 Continue with Email

 Home
Home


