Resource Plan
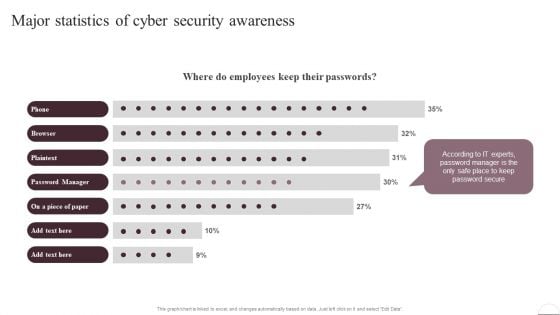
Prevention Of Information Major Statistics Of Cyber Security Awareness Pictures PDF
This graph or chart is linked to excel, and changes automatically based on data. Just left click on it and select Edit Data. There are so many reasons you need a Prevention Of Information Major Statistics Of Cyber Security Awareness Pictures PDF. The first reason is you cant spend time making everything from scratch, Thus, Slidegeeks has made presentation templates for you too. You can easily download these templates from our website easily.
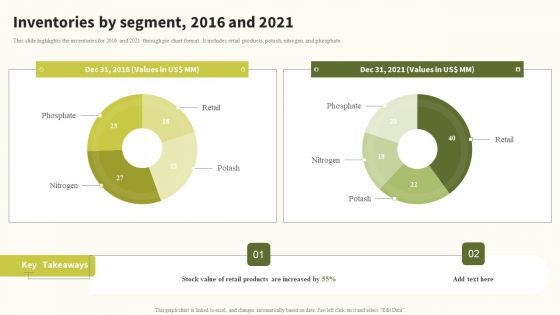
Inventories By Segment 2016 And 2021 Global Food Products Company Profile Summary PDF
This slide highlights the inventories for 2016 and 2021 through pie chart format. It includes retail products, potash, nitrogen, and phosphateFind a pre-designed and impeccable Inventories By Segment 2016 And 2021 Global Food Products Company Profile Summary PDF. The templates can ace your presentation without additional effort. You can download these easy-to-edit presentation templates to make your presentation stand out from others. So, what are you waiting for Download the template from Slidegeeks today and give a unique touch to your presentation.
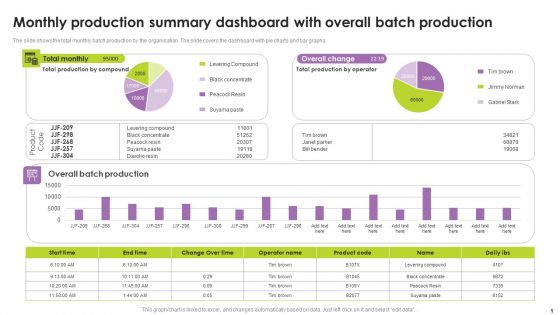
Monthly Production Summary Dashboard With Overall Batch Production Portrait PDF
The slide shows the total monthly batch production by the organisation. The slide covers the dashboard with pie charts and bar graphs. Showcasing this set of slides titled Monthly Production Summary Dashboard With Overall Batch Production Portrait PDF. The topics addressed in these templates are Monthly Production Summary Dashboard, Overall Batch Production. All the content presented in this PPT design is completely editable. Download it and make adjustments in color, background, font etc. as per your unique business setting.
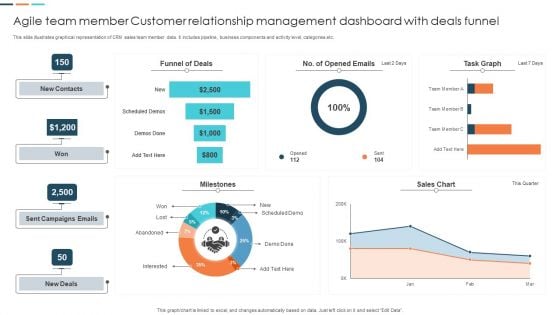
Agile Team Member Customer Relationship Management Dashboard With Deals Funnel Mockup PDF
This slide illustrates graphical representation of CRM sales team member data. It includes pipeline, business components and activity level, categories etc. Pitch your topic with ease and precision using this Agile Team Member Customer Relationship Management Dashboard With Deals Funnel Mockup PDF. This layout presents information on Funnel Of Deals, Sent Campaigns Emails, Sales Chart. It is also available for immediate download and adjustment. So, changes can be made in the color, design, graphics or any other component to create a unique layout.
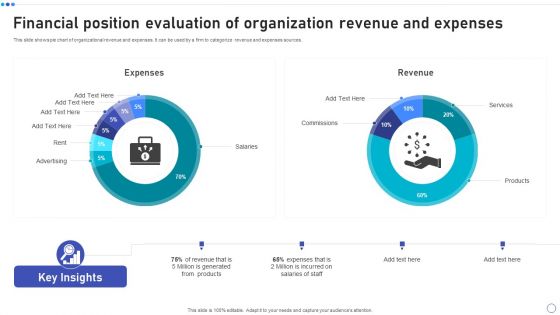
Financial Position Evaluation Of Organization Revenue And Expenses Slides PDF
This slide shows pie chart of organizational revenue and expenses. It can be used by a firm to categorize revenue and expenses sources. Showcasing this set of slides titled Financial Position Evaluation Of Organization Revenue And Expenses Slides PDF. The topics addressed in these templates are Expenses, Revenue, Commissions, Services, Products. All the content presented in this PPT design is completely editable. Download it and make adjustments in color, background, font etc. as per your unique business setting.
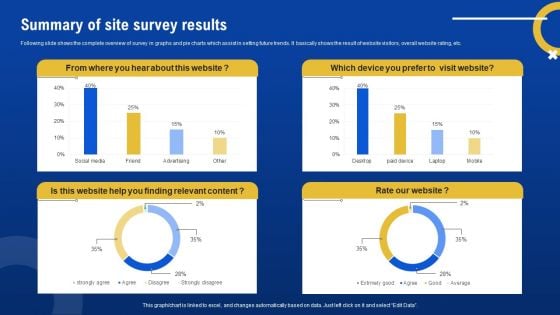
Summary Of Site Survey Results Survey SS
Following slide shows the complete overview of survey in graphs and pie charts which assist in setting future trends. It basically shows the result of website visitors, overall website rating, etc. Showcasing this set of slides titled Summary Of Site Survey Results Survey SS. The topics addressed in these templates are Summary, Site Survey Results. All the content presented in this PPT design is completely editable. Download it and make adjustments in color, background, font etc. as per your unique business setting.
Implementing Client Onboarding Process Customer Reviews And Ratings For Product Evaluation Icons PDF
This slide provides glimpse about client reviews about the product offered by the brand so the customers can check reviews of products users and realize the products value. It includes multiple KPIs such as quality, effectiveness, fragrance, etc. If you are looking for a format to display your unique thoughts, then the professionally designed Implementing Client Onboarding Process Customer Reviews And Ratings For Product Evaluation Icons PDF is the one for you. You can use it as a Google Slides template or a PowerPoint template. Incorporate impressive visuals, symbols, images, and other charts. Modify or reorganize the text boxes as you desire. Experiment with shade schemes and font pairings. Alter, share or cooperate with other people on your work. Download Implementing Client Onboarding Process Customer Reviews And Ratings For Product Evaluation Icons PDF and find out how to give a successful presentation. Present a perfect display to your team and make your presentation unforgettable.
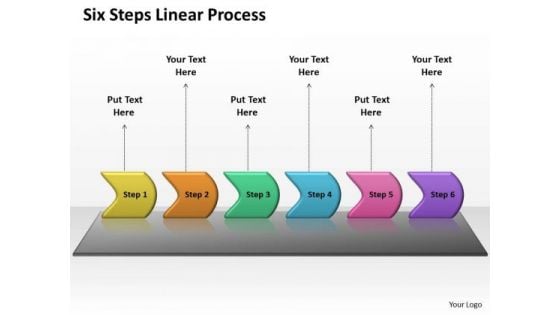
Usa Ppt Background Six Practice The PowerPoint Macro Steps Linear Process 1 Graphic
USA PPT Background six practice the powerpoint macro steps linear process 1 Graphic-This PowerPoint diagram shows six steps of a process. Demonstrate to your audience how the best and most refined ideas pass through. Use this slide to highlight your thought process.-USA PPT Background six practice the powerpoint macro steps linear process 1 Graphic-Account, Arrow, Arrows, Away, Box, Business, Chart, Choice, Choose, Concept, Concepts, Consultation, Corporate, Design, Diagram, Direction, Elements, Flow, Follow, Follows, Future, Group, Grow, Increase, Lines, Many, Month, Move, Past, Period, Phase, Project, Report, Rise, Row, Step, Success Overcome resistance with our Usa Ppt Background Six Practice The PowerPoint Macro Steps Linear Process 1 Graphic. You will come out on top.
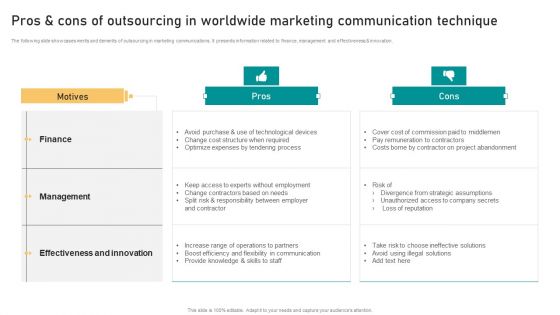
Pros And Cons Of Outsourcing In Worldwide Marketing Communication Technique Formats PDF
The following slide showcases merits and demerits of outsourcing in marketing communications. It presents information related to finance, management and effectiveness and innovation. Pitch your topic with ease and precision using this Pros And Cons Of Outsourcing In Worldwide Marketing Communication Technique Formats PDF. This layout presents information on Finance, Management, Pros, Cons. It is also available for immediate download and adjustment. So, changes can be made in the color, design, graphics or any other component to create a unique layout.
Bar And Pie Chart For Result Analysis PowerPoint Templates Ppt Backgrounds For Slides 0513
Our Great Team Has Conjured Up A Web Of business Power Point Templates. Use Them To String Together Your Glistening Ideas. Think Of It And Be Sure We Have It. Our pie charts Power Point Templates Offer You The Widest Possible Range Of Options. Venture into the unknown with our Bar And Pie Chart For Result Analysis PowerPoint Templates Ppt Backgrounds For Slides 0513. Your thoughts will move ahead sure-footedly.
Pie Chart For Business Income Growth PowerPoint Templates Ppt Backgrounds For Slides 0613
Drive confidently over all the bumps. Our Pie Chart For Business Income Growth PowerPoint Templates PPT Backgrounds For Slides will absorb the shocks. Take a drive into unknown territory. Our Success PowerPoint Templates will provide the co-ordinates. Drive out of difficulty with our Marketing PowerPoint Templates. They will steer you to safety. Become an oracle with our Pie Chart For Business Income Growth PowerPoint Templates Ppt Backgrounds For Slides 0613. You will come out on top.
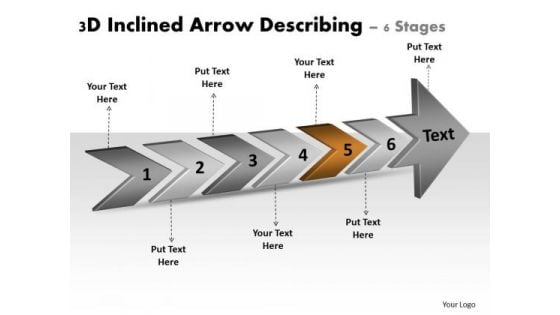
3d Inclined Arrow Describing 6 Stages Basic Process Flow Chart PowerPoint Templates
We present our 3d inclined arrow describing 6 stages basic process flow chart PowerPoint templates.Use our Finance PowerPoint Templates because,Let this slide illustrates others piggyback on you to see well over the horizon Use our Process and Flows PowerPoint Templates because, You are the star of your enlightened team. Use our Arrows PowerPoint Templates because,This Slide offers an excellent background to build up the various stages of your business process. Use our Shapes PowerPoint Templates because,You can Churn the wheels of the brains of your colleagues. Use our Business PowerPoint Templates because, It illustrates the city with a lasting tryst with resilience. You epitomise the qualities that give your city its fameUse these PowerPoint slides for presentations relating to Advertising, arrow, background, banner, bookmark, card, choice, concept, creative, design, direction, flow, idea, illustration, infographic, instruction, label, layout, manual, marketing, modern, next, number, offer, options, order, paper, process, product, promotion, sequence, simple, step, symbol, template, triangle, tutorial, vector, version, web. The prominent colors used in the PowerPoint template are Brown, Gray, Black Go get 'em with our 3d Inclined Arrow Describing 6 Stages Basic Process Flow Chart PowerPoint Templates.Be sure there will be no false bravado.
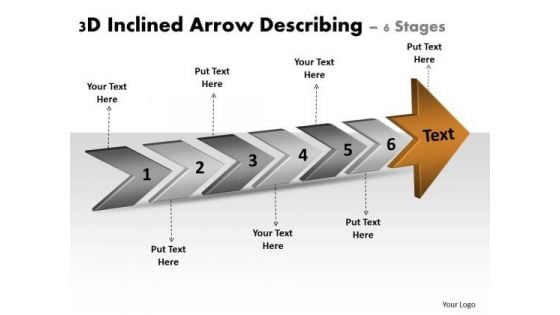
3d Inclined Arrow Describing 6 Stages Flow Chart Creator Online PowerPoint Templates
We present our 3d inclined arrow describing 6 stages flow chart creator online PowerPoint templates.Use our Finance PowerPoint Templates because,It shows how one can contribute to the overall feeling of well-being. Use our Process and Flows PowerPoint Templates because,This Slide offers an excellent background to build up the various stages of your business process. Use our Arrows PowerPoint Templates because,This diagram helps in examine each brilliant thought in thorough detail highlighting all the pros and cons as minutely as possible. Use our Shapes PowerPoint Templates because,you have the ability to judge Which out of late have been proving to be a hassle. Use our Business PowerPoint Templates because,You have selected your team man for manUse these PowerPoint slides for presentations relating to Advertising, arrow, background, banner, bookmark, card, choice, concept, creative, design, direction, flow, idea, illustration, infographic, instruction, label, layout, manual, marketing, modern, next, number, offer, options, order, paper, process, product, promotion, sequence, simple, step, symbol, template, triangle, tutorial, vector, version, web. The prominent colors used in the PowerPoint template are Brown, Gray, Black Build on your dreams with our 3d Inclined Arrow Describing 6 Stages Flow Chart Creator Online PowerPoint Templates. They provide a cementing factor.

Search Engine Marketing Existing Sem Challenges Faced By Team Information PDF
The following slide depicts some major challenges faced by organization in the absence of optimized SEM strategy to analyze and formulate improvement actions. It includes elements such as ineffective landing pages, poor website tracking, low website traffic etc. Boost your pitch with our creative Search Engine Marketing Existing Sem Challenges Faced By Team Information PDF. Deliver an awe-inspiring pitch that will mesmerize everyone. Using these presentation templates you will surely catch everyones attention. You can browse the ppts collection on our website. We have researchers who are experts at creating the right content for the templates. So you dont have to invest time in any additional work. Just grab the template now and use them.
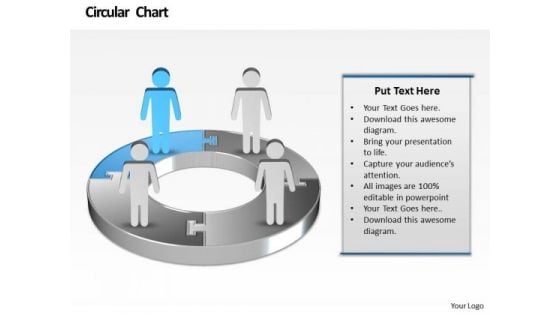
Ppt Animated Men Standing On Colorful Pie Chart Presentation PowerPoint Tips Templates
PPT animated men standing on colorful pie chart presentation powerpoint tips Templates-Emphatically define your message with our above template which contains a graphic 3d pie chart with animated men.This image represents the concept of Business Meetings, Conferences etc.This Diagram is designed to attract the attention of your audience.-PPT animated men standing on colorful pie chart presentation powerpoint tips Templates-Abstract, Access, Arrow, Background, Business, Chart, Circle, Concept, Conceptual, Connection, Corporate, Creative, Cycle, Design, Different, Element, Empty, Form, Frame, Graphic, Group, Idea, Illustration, Part, Piece, People, Place, Process, Red, Shapes, Solution, Special, Speech, Strategy, Symbol Map out your strategy with our Ppt Animated Men Standing On Colorful Pie Chart Presentation PowerPoint Tips Templates. Download without worries with our money back guaranteee.
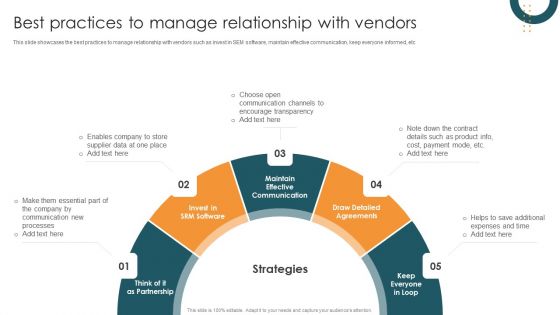
Vendor Relation Management Techniques Best Practices To Manage Relationship With Vendors Template PDF
This slide showcases the best practices to manage relationship with vendors such as invest in SEM software, maintain effective communication, keep everyone informed, etc Here you can discover an assortment of the finest PowerPoint and Google Slides templates. With these templates, you can create presentations for a variety of purposes while simultaneously providing your audience with an eye catching visual experience. Download Vendor Relation Management Techniques Best Practices To Manage Relationship With Vendors Template PDF to deliver an impeccable presentation. These templates will make your job of preparing presentations much quicker, yet still, maintain a high level of quality. Slidegeeks has experienced researchers who prepare these templates and write high quality content for you. Later on, you can personalize the content by editing the Vendor Relation Management Techniques Best Practices To Manage Relationship With Vendors Template PDF.
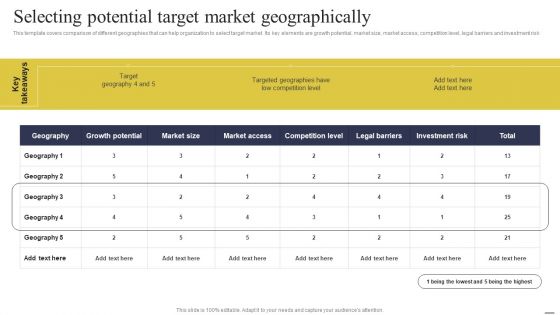
Defining Generic Target Marketing Techniques Selecting Potential Target Market Geographically Ideas PDF
This template covers comparison of different geographies that can help organization to select target market. Its key elements are growth potential, market size, market access, competition level, legal barriers and investment risk. Do you have to make sure that everyone on your team knows about any specific topic I yes, then you should give Defining Generic Target Marketing Techniques Selecting Potential Target Market Geographically Ideas PDF a try. Our experts have put a lot of knowledge and effort into creating this impeccable Defining Generic Target Marketing Techniques Selecting Potential Target Market Geographically Ideas PDF. You can use this template for your upcoming presentations, as the slides are perfect to represent even the tiniest detail. You can download these templates from the Slidegeeks website and these are easy to edit. So grab these today.
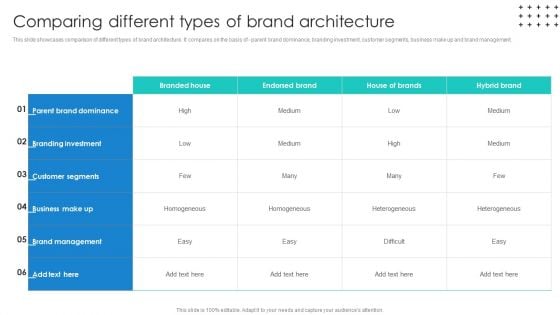
Promotional Techniques To Market Several Brands Among Target Groups Comparing Summary PDF
This slide showcases comparison of different types of brand architecture. It compares on the basis of - parent brand dominance, branding investment, customer segments, business make up and brand management. Create an editable Promotional Techniques To Market Several Brands Among Target Groups Comparing Summary PDF that communicates your idea and engages your audience. Whether youre presenting a business or an educational presentation, pre-designed presentation templates help save time. Promotional Techniques To Market Several Brands Among Target Groups Comparing Summary PDF is highly customizable and very easy to edit, covering many different styles from creative to business presentations. Slidegeeks has creative team members who have crafted amazing templates. So, go and get them without any delay.
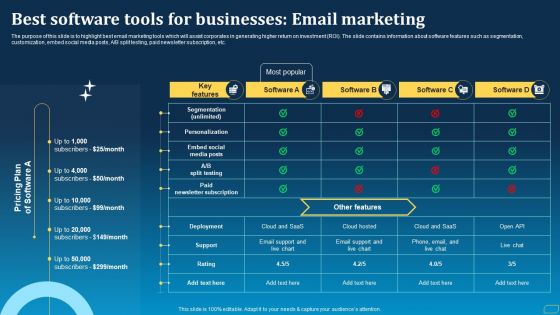
Direct Marketing Techniques To Enhance Business Presence Best Software Tools For Businesses Email Marketing Inspiration PDF
The purpose of this slide is to highlight best email marketing tools which will assist corporates in generating higher return on investment ROI. The slide contains information about software features such as segmentation, customization, embed social media posts, A B split testing, paid newsletter subscription, etc. Create an editable Direct Marketing Techniques To Enhance Business Presence Best Software Tools For Businesses Email Marketing Inspiration PDF that communicates your idea and engages your audience. Whether youre presenting a business or an educational presentation, pre designed presentation templates help save time. Direct Marketing Techniques To Enhance Business Presence Best Software Tools For Businesses Email Marketing Inspiration PDF is highly customizable and very easy to edit, covering many different styles from creative to business presentations. Slidegeeks has creative team members who have crafted amazing templates. So, go and get them without any delay.
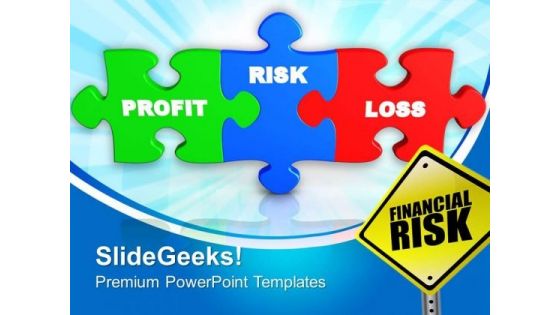
Financial Risk Business PowerPoint Templates Ppt Backgrounds For Slides 0113
We present our Financial Risk Business PowerPoint Templates PPT Backgrounds For Slides 0113.Use our Puzzles or Jigsaws PowerPoint Templates because you should once Tap the ingenuity of our PowerPoint Templates and Slides. They are programmed to succeed. Use our Finance PowerPoint Templates because Our PowerPoint Templates and Slides will let you meet your Deadlines. Download and present our Business PowerPoint Templates because It will mark the footprints of your journey. Illustrate how they will lead you to your desired destination. Present our Shapes PowerPoint Templates because Our PowerPoint Templates and Slides provide you with a vast range of viable options. Select the appropriate ones and just fill in your text. Download and present our Success PowerPoint Templates because Our PowerPoint Templates and Slides will effectively help you save your valuable time. They are readymade to fit into any presentation structure. Use these PowerPoint slides for presentations relating to Financial risk, business, finance, puzzles or jigsaws, shapes, success. The prominent colors used in the PowerPoint template are Red, Green, Blue. Customers tell us our Financial Risk Business PowerPoint Templates PPT Backgrounds For Slides 0113 are designed by a team of presentation professionals. PowerPoint presentation experts tell us our finance PowerPoint templates and PPT Slides are second to none. You can be sure our Financial Risk Business PowerPoint Templates PPT Backgrounds For Slides 0113 are designed by professionals Customers tell us our or PowerPoint templates and PPT Slides are aesthetically designed to attract attention. We guarantee that they will grab all the eyeballs you need. Professionals tell us our Financial Risk Business PowerPoint Templates PPT Backgrounds For Slides 0113 are designed by a team of presentation professionals. You can be sure our shapes PowerPoint templates and PPT Slides are designed by a team of presentation professionals. Earn accolades with our Financial Risk Business PowerPoint Templates Ppt Backgrounds For Slides 0113. Download without worries with our money back guaranteee.
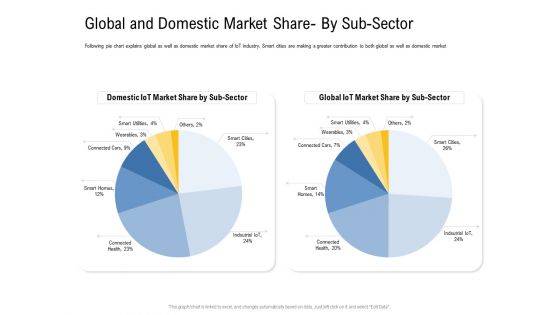
IOT Industry Assessment Global And Domestic Market Share By Sub Sector Ppt Layouts Graphics PDF
Following pie chart explains global as well as domestic market share of IoT industry. Smart cities are making a greater contribution to both global as well as domestic market. Deliver an awe inspiring pitch with this creative iot industry assessment global and domestic market share by sub sector ppt layouts graphics pdf bundle. Topics like global and domestic market share by sub sector can be discussed with this completely editable template. It is available for immediate download depending on the needs and requirements of the user.
Customer Relationship Management Dashboard CRM Application Dashboard Quarter Icons PDF
This graph or chart is linked to excel, and changes automatically based on data. Just left click on it and select Edit Data.Deliver and pitch your topic in the best possible manner with this customer relationship management dashboard crm application dashboard quarter icons pdf. Use them to share invaluable insights on marketing funnel all time, opportunity generation by quarter, active prospects, new prospects, new opportunities and impress your audience. This template can be altered and modified as per your expectations. So, grab it now.
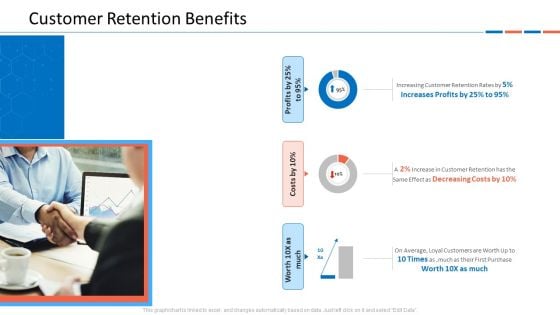
Customer Relationship Management Dashboard Customer Retention Benefits Inspiration PDF
This graph or chart is linked to excel, and changes automatically based on data. Just left click on it and select Edit Data.Deliver an awe inspiring pitch with this creative customer relationship management dashboard customer retention benefits inspiration pdf bundle. Topics like increasing customer retention rates, on average, loyal customers are worth up to 10 times as ,much as their first purchase, profits by 25percent to 95percent can be discussed with this completely editable template. It is available for immediate download depending on the needs and requirements of the user.
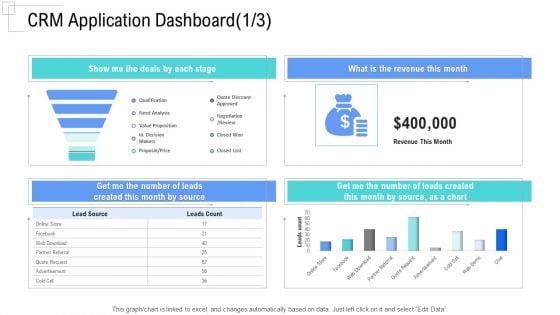
Managing Customer Experience CRM Application Dashboard Month Mockup PDF
This graph or chart is linked to excel, and changes automatically based on data. Just left click on it and select Edit Data.Deliver an awe-inspiring pitch with this creative managing customer experience crm application dashboard month mockup pdf bundle. Topics like show me the deals by each stage, what is the revenue this month, get me the number of leads created this month by source can be discussed with this completely editable template. It is available for immediate download depending on the needs and requirements of the user.

Managing Customer Experience CRM Data Analysis Sales Pictures PDF
This graph or chart is linked to excel, and changes automatically based on data. Just left click on it and select Edit Data.Deliver and pitch your topic in the best possible manner with this managing customer experience crm data analysis sales pictures pdf. Use them to share invaluable insights on entities by rep, completed activities l, biz notes this month, phone calls last 3 months, activity last 3 months and impress your audience. This template can be altered and modified as per your expectations. So, grab it now.
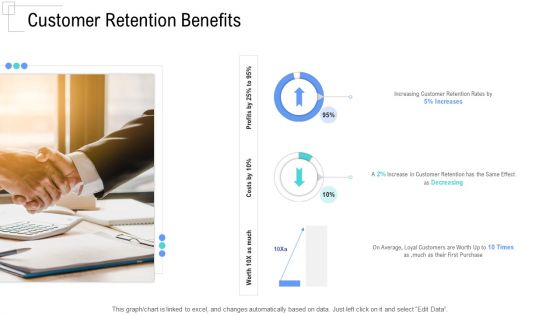
Managing Customer Experience Customer Retention Benefits Template PDF
This graph or chart is linked to excel, and changes automatically based on data. Just left click on it and select Edit Data.Deliver and pitch your topic in the best possible manner with this managing customer experience customer retention benefits template pdf. Use them to share invaluable insights on increasing customer retention rates by, average, loyal customers are worth up to 10 times as much as their first purchase, worth 10x as much and impress your audience. This template can be altered and modified as per your expectations. So, grab it now.
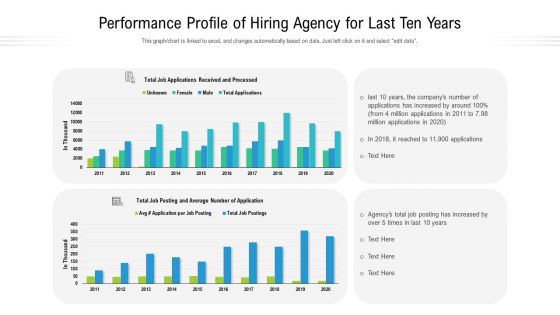
Performance Profile Of Hiring Agency For Last Ten Years Ppt Show Styles PDF
This graph to chart is linked to excel, and changes automatically based on data. Just left click on it and select edit data. Showcasing this set of slides titled performance profile of hiring agency for last ten years ppt show styles pdf. The topics addressed in these templates are performance profile of hiring agency for last ten years. All the content presented in this PPT design is completely editable. Download it and make adjustments in color, background, font etc. as per your unique business setting.
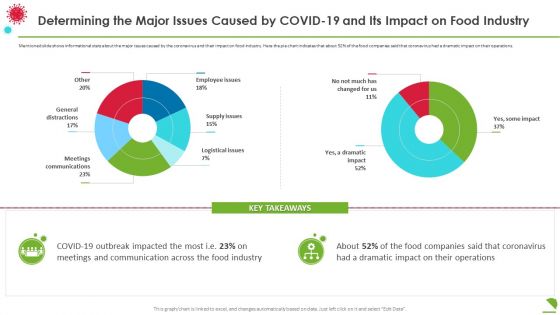
Determining The Major Issues Caused By Covid19 And Its Impact On Food Industry Demonstration PDF
Mentioned slide shows informational stats about the major issues caused by the coronavirus and their impact on food industry. Here the pie chart indicates that about 52 percentage of the food companies said that coronavirus had a dramatic impact on their operations. Deliver and pitch your topic in the best possible manner with this determining the major issues caused by covid19 and its impact on food industry demonstration pdf. Use them to share invaluable insights on communication, industry, dramatic and impress your audience. This template can be altered and modified as per your expectations. So, grab it now.
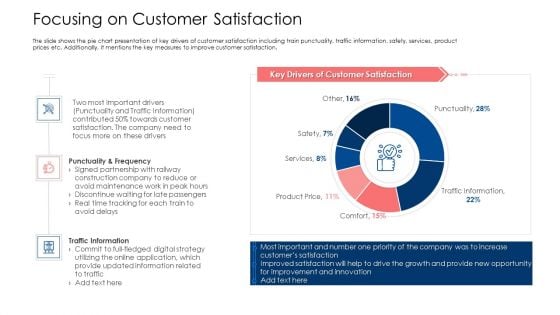
Building Brand Image Of A Railway Firm Focusing On Customer Satisfaction Formats PDF
The slide shows the pie chart presentation of key drivers of customer satisfaction including train punctuality, traffic information, safety, services, product prices etc. Additionally, it mentions the key measures to improve customer satisfaction. Deliver an awe inspiring pitch with this creative building brand image of a railway firm focusing on customer satisfaction formats pdf bundle. Topics like customers satisfaction, opportunity, innovation can be discussed with this completely editable template. It is available for immediate download depending on the needs and requirements of the user.
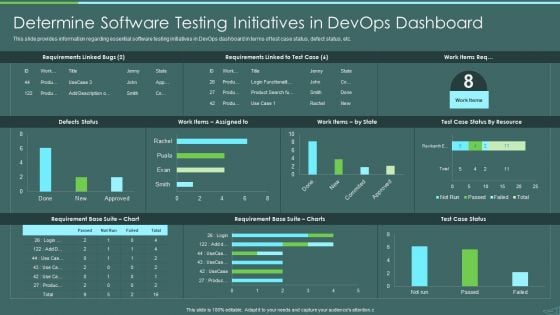
Devops Quality Assurance And Testing To Improve Speed And Quality IT Determine Software Testing Topics PDF
This slide provides information regarding essential software testing initiatives in DevOps dashboard in terms of test case status, defect status, etc. Deliver and pitch your topic in the best possible manner with this devops quality assurance and testing to improve speed and quality it determine software testing topics pdf. Use them to share invaluable insights on defects status, work items by state, requirements linked to test case, requirements linked bugs, test case status, requirement base suite charts and impress your audience. This template can be altered and modified as per your expectations. So, grab it now.
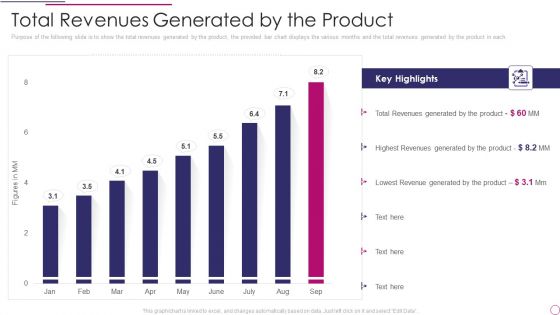
Performance Analysis Of New Product Development Total Revenues Generated By The Product Microsoft PDF
Purpose of the following slide is to show the total revenues generated by the product, the provided bar chart displays the various months and the total revenues generated by the product in each. Deliver and pitch your topic in the best possible manner with this performance analysis of new product development total revenues generated by the product microsoft pdf. Use them to share invaluable insights on total revenues generated by the product and impress your audience. This template can be altered and modified as per your expectations. So, grab it now.
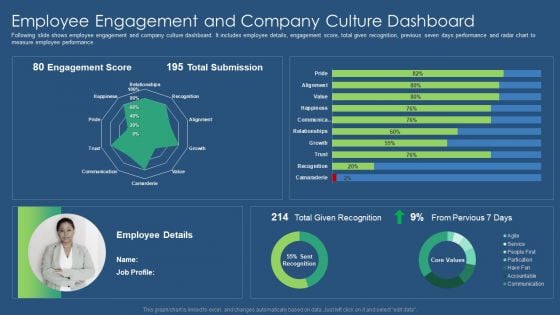
Sustainability Calculation With KPI Employee Engagement And Company Culture Sample PDF Topics PDF
Following slide shows employee engagement and company culture dashboard. It includes employee details, engagement score, total given recognition, previous seven days performance and radar chart to measure employee performance. Deliver and pitch your topic in the best possible manner with this sustainability calculation with kpi employee engagement and company culture sample pdf. Use them to share invaluable insights on employee engagement and company culture dashboard and impress your audience. This template can be altered and modified as per your expectations. So, grab it now.
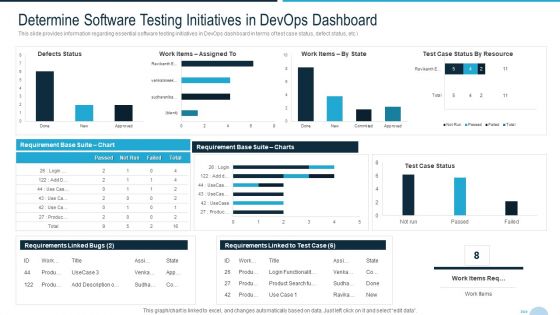
Development And Operations Quality Assurance And Validation IT Determine Software Testing Initiatives Elements PDF
This slide provides information regarding essential software testing initiatives in DevOps dashboard in terms of test case status, defect status, etc.Deliver and pitch your topic in the best possible manner with this development and operations quality assurance and validation it determine software testing initiatives elements pdf Use them to share invaluable insights on requirement base suite charts, requirements linked to test case, requirements linked bugs and impress your audience. This template can be altered and modified as per your expectations. So, grab it now.
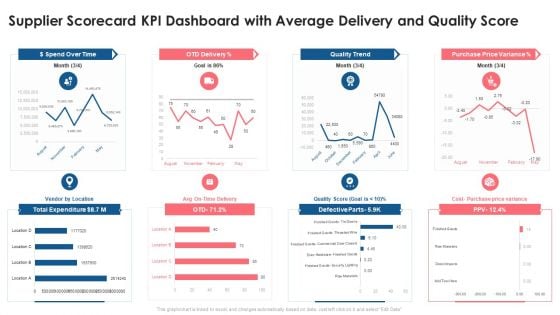
Supplier Scorecard Supplier Scorecard KPI Dashboard With Average Delivery And Quality Score Introduction PDF
This graph or chart is linked to excel, and changes automatically based on data. Just left click on it and select Edit Data. Deliver an awe inspiring pitch with this creative supplier scorecard supplier scorecard kpi dashboard with average delivery and quality score introduction pdf bundle. Topics like dollar spend over time, otd delivery, quality trend, purchase price variance, total expenditure can be discussed with this completely editable template. It is available for immediate download depending on the needs and requirements of the user.
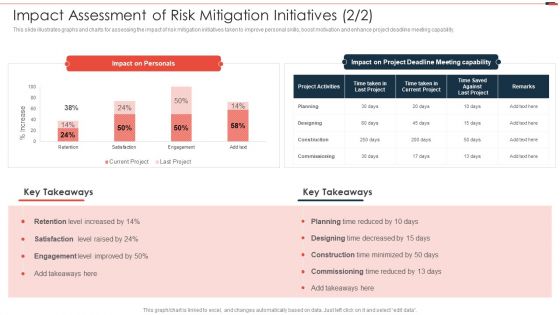
Impact Assessment Of Risk Mitigation Initiatives Commercial Property Development Graphics PDF
This slide illustrates graphs and charts for assessing the impact of risk mitigation initiatives taken to improve personal skills, boost motivation and enhance project deadline meeting capability. Deliver and pitch your topic in the best possible manner with this impact assessment of risk mitigation initiatives commercial property development graphics pdf. Use them to share invaluable insights on impact on personals, engagement level improved, satisfaction level raised, retention level increased and impress your audience. This template can be altered and modified as per your expectations. So, grab it now.
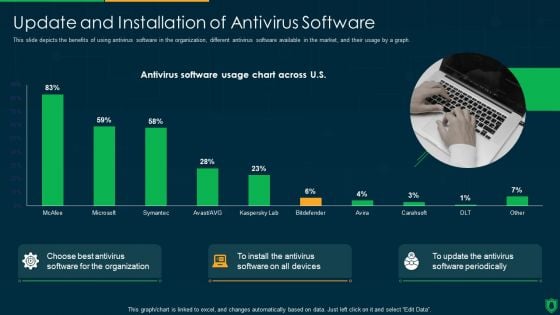
Info Security Update And Installation Of Antivirus Software Ppt PowerPoint Presentation File Designs PDF
This slide depicts the benefits of using antivirus software in the organization, different antivirus software available in the market, and their usage by a graph. Deliver and pitch your topic in the best possible manner with this info security update and installation of antivirus software ppt powerpoint presentation file designs pdf. Use them to share invaluable insights on antivirus software usage chart across us, choose best antivirus, organization and impress your audience. This template can be altered and modified as per your expectations. So, grab it now.
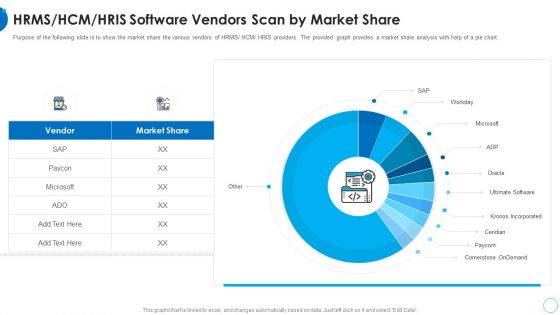
RMS HCM HRIS Software Vendors Scan By Market Share HR Change Management Tools Introduction PDF
Purpose of the following slide is to show the market share the various vendors of HRMS or HCM or HRIS providers. The provided graph provides a market share analysis with help of a pie chart. Deliver and pitch your topic in the best possible manner with this rms hcm hris software vendors scan by market share hr change management tools introduction pdf. Use them to share invaluable insights on hrms or hcm or hris software vendors scan by market share and impress your audience. This template can be altered and modified as per your expectations. So, grab it now.
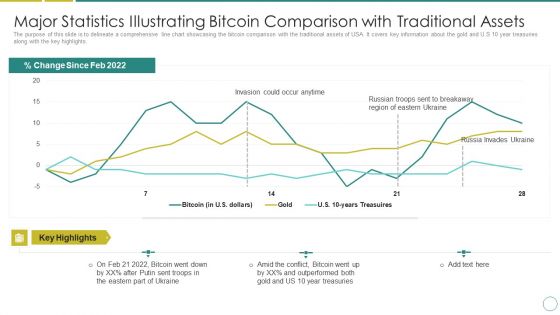
Russia Ukraine Major Statistics Illustrating Bitcoin Comparison With Traditional Assets Guidelines PDF
The purpose of this slide is to delineate a comprehensive line chart showcasing the bitcoin comparison with the traditional assets of USA. It covers key information about the gold and U.S 10 year treasuries along with the key highlights. Deliver an awe inspiring pitch with this creative russia ukraine major statistics illustrating bitcoin comparison with traditional assets guidelines pdf bundle. Topics like invasion could occur anytime, percent change since feb 2022 can be discussed with this completely editable template. It is available for immediate download depending on the needs and requirements of the user.
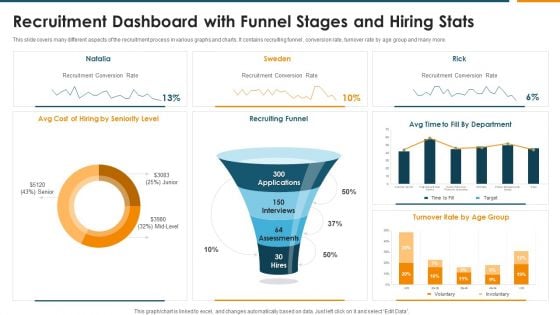
Recruitment Dashboard With Funnel Stages And Hiring Stats Rules PDF
This slide covers many different aspects of the recruitment process in various graphs and charts. It contains recruiting funnel , conversion rate, turnover rate by age group and many more. Pitch your topic with ease and precision using this Recruitment Dashboard With Funnel Stages And Hiring Stats Rules PDF. This layout presents information on Recruiting Funnel, Recruitment Conversion Rate, Seniority Level. It is also available for immediate download and adjustment. So, changes can be made in the color, design, graphics or any other component to create a unique layout.
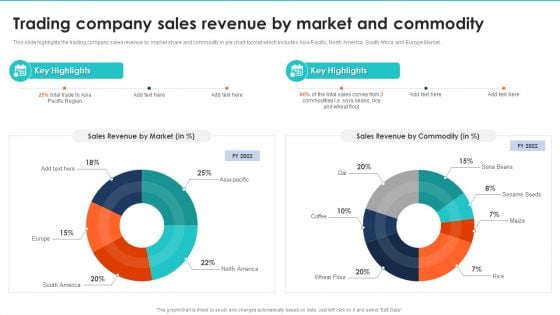
Export Management Company Profile Trading Company Sales Revenue By Market And Commodity Background PDF
This slide highlights the trading company sales revenue by market share and commodity in pie chart format which includes Asia Pacific, North America, South Africa and Europe Market. Deliver and pitch your topic in the best possible manner with this Export Management Company Profile Trading Company Sales Revenue By Market And Commodity Background PDF. Use them to share invaluable insights on Sales Revenue By Market, Sales Revenue By Commodity and impress your audience. This template can be altered and modified as per your expectations. So, grab it now.
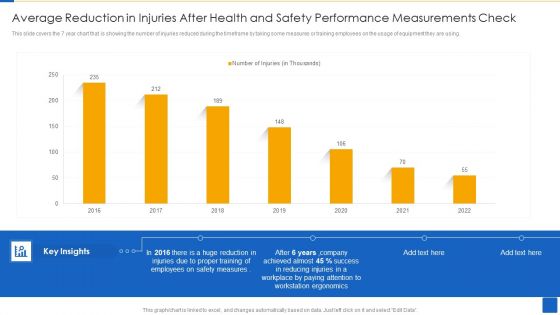
Average Reduction In Injuries After Health And Safety Performance Measurements Check Template PDF
This slide covers the 7 year chart that is showing the number of injuries reduced during the timeframe by taking some measures or training employees on the usage of equipment they are using. Showcasing this set of slides titled Average Reduction In Injuries After Health And Safety Performance Measurements Check Template PDF The topics addressed in these templates are Employees Safety Measures, Workstation Ergonomics, Workplace Paying Attention All the content presented in this PPT design is completely editable. Download it and make adjustments in color, background, font etc. as per your unique business setting.
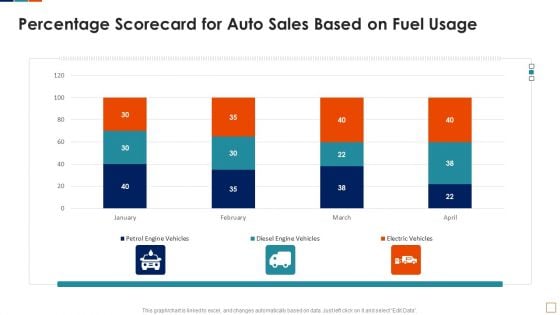
Automobile Sales Scorecard Percentage Scorecard For Auto Sales Based On Fuel Usage Graphics PDF
This graph or chart is linked to excel, and changes automatically based on data. Just left click on it and select Edit Data. Deliver and pitch your topic in the best possible manner with this Automobile Sales Scorecard Percentage Scorecard For Auto Sales Based On Fuel Usage Graphics PDF. Use them to share invaluable insights on Petrol Engine Vehicles, Diesel Engine Vehicles, Electric Vehicles Sales and impress your audience. This template can be altered and modified as per your expectations. So, grab it now.
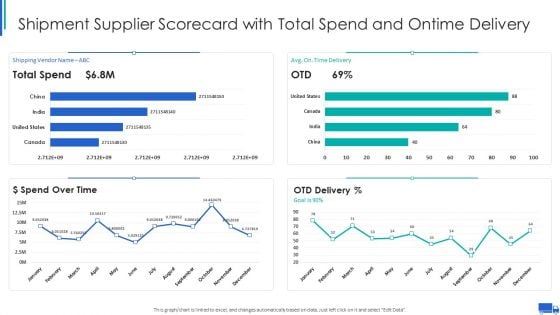
Shipment Supplier Scorecard With Total Spend And Ontime Delivery Ppt Slides Templates PDF
This graph or chart is linked to excel, and changes automatically based on data. Just left click on it and select Edit Data. Deliver and pitch your topic in the best possible manner with this Shipment Supplier Scorecard With Total Spend And Ontime Delivery Ppt Slides Templates PDF. Use them to share invaluable insights on Shipping Vendor Avg, Time Delivery Goal, Spend Over Time, OTD Delivery Percent and impress your audience. This template can be altered and modified as per your expectations. So, grab it now.
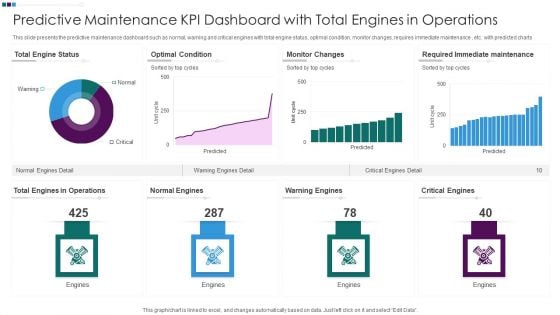
Predictive Maintenance KPI Dashboard With Total Engines In Operations Ppt Professional Inspiration PDF
This slide presents the predictive maintenance dashboard such as normal, warning and critical engines with total engine status, optimal condition, monitor changes, requires immediate maintenance , etc. with predicted charts. Pitch your topic with ease and precision using this Predictive Maintenance KPI Dashboard With Total Engines In Operations Ppt Professional Inspiration PDF. This layout presents information on Total Engine Status, Optimal Condition Monitor, Changes Warning Engines, Required Immediate Maintenance. It is also available for immediate download and adjustment. So, changes can be made in the color, design, graphics or any other component to create a unique layout.
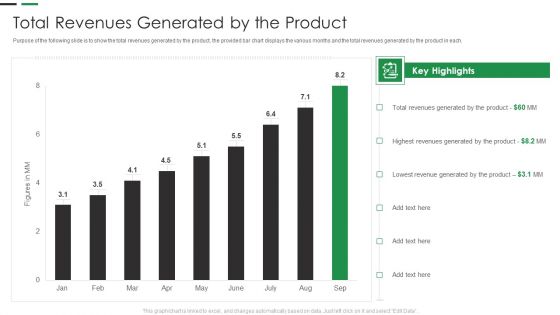
Evaluating New Commodity Impact On Market Total Revenues Generated By The Product Topics PDF
Purpose of the following slide is to show the total revenues generated by the product, the provided bar chart displays the various months and the total revenues generated by the product in each. Deliver an awe inspiring pitch with this creative Evaluating New Commodity Impact On Market Total Revenues Generated By The Product Topics PDF bundle. Topics like Key Highlights, Revenues Generated, Generated Product can be discussed with this completely editable template. It is available for immediate download depending on the needs and requirements of the user.
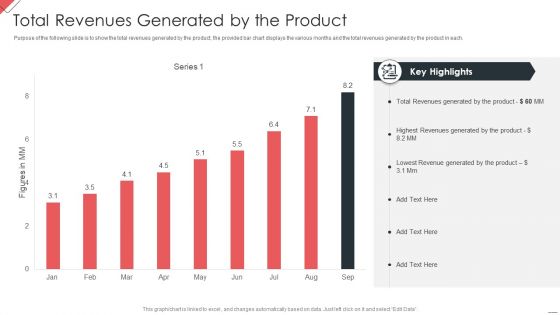
New Commodity Market Viability Review Total Revenues Generated By The Product Information PDF
Purpose of the following slide is to show the total revenues generated by the product, the provided bar chart displays the various months and the total revenues generated by the product in each. Deliver an awe inspiring pitch with this creative New Commodity Market Viability Review Total Revenues Generated By The Product Information PDF bundle. Topics like Revenues Generated, Highest Revenues, Lowest Revenue can be discussed with this completely editable template. It is available for immediate download depending on the needs and requirements of the user.
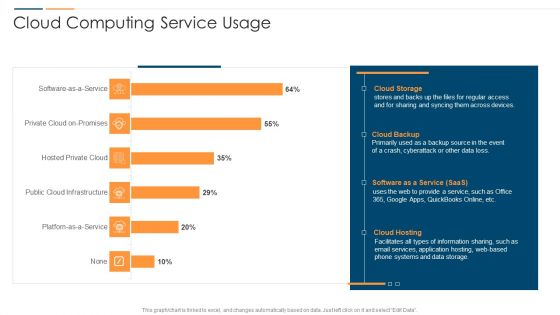
Revolution In Online Business Cloud Computing Service Usage Ppt PowerPoint Presentation File Themes PDF
This graph or chart is linked to excel, and changes automatically based on data. Just left click on it and select Edit Data. Deliver and pitch your topic in the best possible manner with this Revolution In Online Business Cloud Computing Service Usage Ppt PowerPoint Presentation File Themes PDF. Use them to share invaluable insights on Cloud Storage System, Cloud Backup Saas, Cloud Hosting Storage and impress your audience. This template can be altered and modified as per your expectations. So, grab it now.
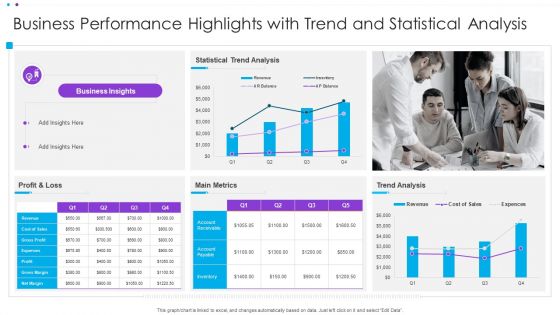
Business Performance Highlights With Trend And Statistical Analysis Ppt Infographic Template Display PDF
This graph or chart is linked to excel, and changes automatically based on data. Just left click on it and select Edit Data. Pitch your topic with ease and precision using this Business Performance Highlights With Trend And Statistical Analysis Ppt Infographic Template Display PDF. This layout presents information on Statistical Trend Analysis, Main Metrics, Profit And Loss. It is also available for immediate download and adjustment. So, changes can be made in the color, design, graphics or any other component to create a unique layout.
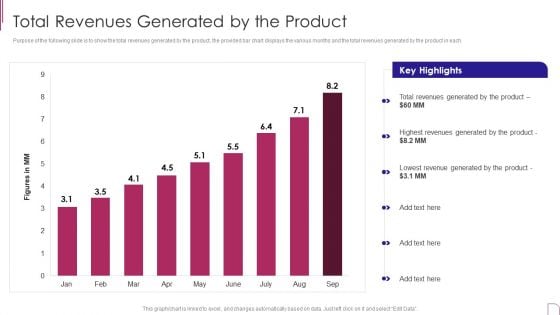
Yearly Product Performance Assessment Repor Total Revenues Generated By The Product Background PDF
Purpose of the following slide is to show the total revenues generated by the product, the provided bar chart displays the various months and the total revenues generated by the product in each. Deliver and pitch your topic in the best possible manner with this Yearly Product Performance Assessment Repor Total Revenues Generated By The Product Background PDF Use them to share invaluable insights on Key Highlights, Revenues Generated, Lowest Revenue and impress your audience. This template can be altered and modified as per your expectations. So, grab it now.
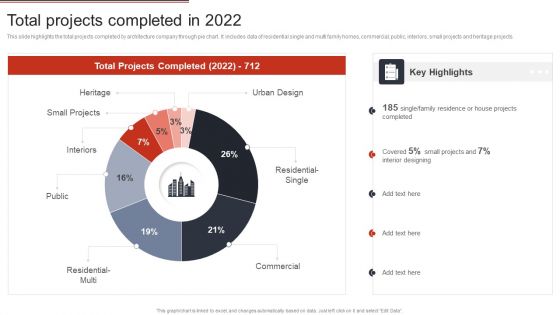
Building Design Firm Details Total Projects Completed In 2022 Ppt Infographic Template Graphics Pictures PDF
This slide highlights the total projects completed by architecture company through pie chart. It includes data of residential single and multi family homes, commercial, public, interiors, small projects and heritage projects. Deliver an awe inspiring pitch with this creative Building Design Firm Details Total Projects Completed In 2022 Ppt Infographic Template Graphics Pictures PDF bundle. Topics like Urban Design, Residential Single, Commercial, Interiors, Small Projects can be discussed with this completely editable template. It is available for immediate download depending on the needs and requirements of the user.
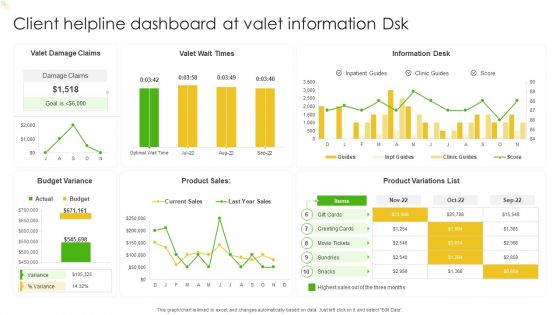
Client Helpline Dashboard At Valet Information Dsk Ppt Gallery Slide Portrait PDF
This graph or chart is linked to excel, and changes automatically based on data. Just left click on it and select Edit Data. Pitch your topic with ease and precision using this Client Helpline Dashboard At Valet Information Dsk Ppt Gallery Slide Portrait PDF. This layout presents information on Valet Damage Claims, Valet Wait Times, Information Desk. It is also available for immediate download and adjustment. So, changes can be made in the color, design, graphics or any other component to create a unique layout.
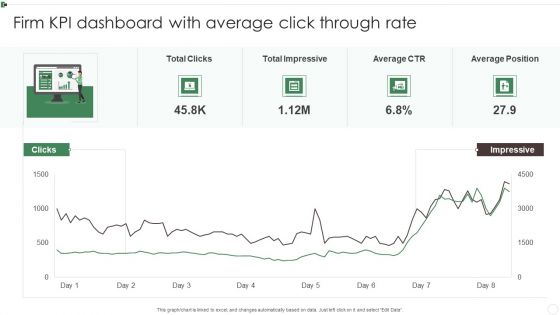
Firm KPI Dashboard With Average Click Through Rate Ppt Inspiration Sample PDF
This graph or chart is linked to excel, and changes automatically based on data. Just left click on it and select Edit Data. Pitch your topic with ease and precision using this Firm KPI Dashboard With Average Click Through Rate Ppt Inspiration Sample PDF. This layout presents information on Total Clicks, Total Impressive, Average CTR, Average Position. It is also available for immediate download and adjustment. So, changes can be made in the color, design, graphics or any other component to create a unique layout.
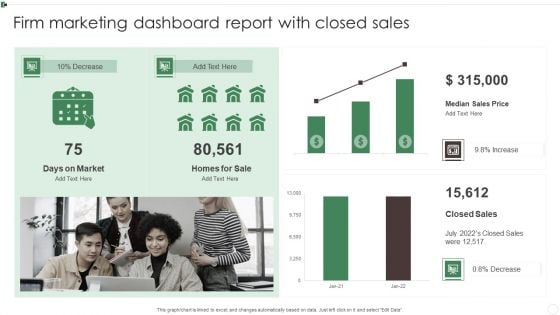
Firm Marketing Dashboard Report With Closed Sales Ppt Slides Graphics Example PDF
This graph or chart is linked to excel, and changes automatically based on data. Just left click on it and select Edit Data. Showcasing this set of slides titled Firm Marketing Dashboard Report With Closed Sales Ppt Slides Graphics Example PDF. The topics addressed in these templates are Days On Market, Homes For Sale, Median Sales Price, Closed Sales. All the content presented in this PPT design is completely editable. Download it and make adjustments in color, background, font etc. as per your unique business setting.
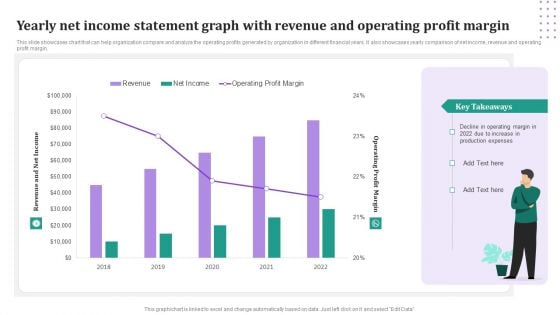
Yearly Net Income Statement Graph With Revenue And Operating Profit Margin Download PDF
This slide showcases chart that can help organization compare and analyze the operating profits generated by organization in different financial years. It also showcases yearly comparison of net income, revenue and operating profit margin. Pitch your topic with ease and precision using this Yearly Net Income Statement Graph With Revenue And Operating Profit Margin Download PDF. This layout presents information on Revenue, Net Income, Operating Profit Margin. It is also available for immediate download and adjustment. So, changes can be made in the color, design, graphics or any other component to create a unique layout.
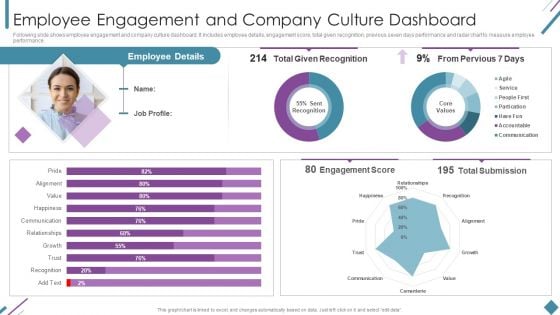
Metrics To Measure Business Performance Employee Engagement And Company Culture Demonstration PDF
Following slide shows employee engagement and company culture dashboard. It includes employee details, engagement score, total given recognition, previous seven days performance and radar chart to measure employee performance. Deliver and pitch your topic in the best possible manner with this Metrics To Measure Business Performance Employee Engagement And Company Culture Demonstration PDF. Use them to share invaluable insights on Employee Details, Total Given Recognition, Engagement Score and impress your audience. This template can be altered and modified as per your expectations. So, grab it now.
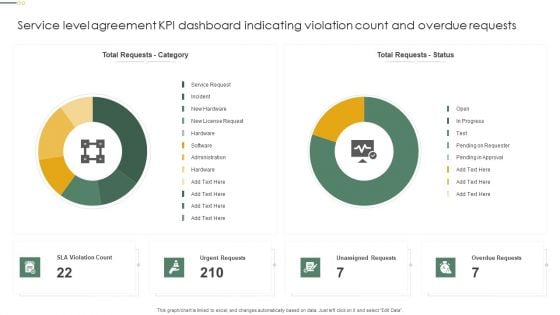
Service Level Agreement KPI Dashboard Indicating Violation Count And Overdue Requests Diagrams PDF
This graph or chart is linked to excel, and changes automatically based on data. Just left click on it and select Edit Data. Showcasing this set of slides titled Service Level Agreement KPI Dashboard Indicating Violation Count And Overdue Requests Diagrams PDF. The topics addressed in these templates are Total Requests Category, Total Requests Status, Urgent Requests. All the content presented in this PPT design is completely editable. Download it and make adjustments in color, background, font etc. as per your unique business setting.
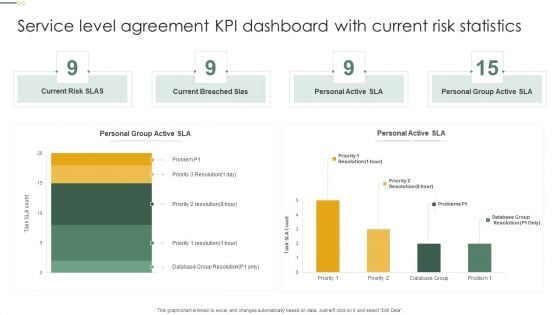
Service Level Agreement KPI Dashboard With Current Risk Statistics Topics PDF
This graph or chart is linked to excel, and changes automatically based on data. Just left click on it and select Edit Data. Pitch your topic with ease and precision using this Service Level Agreement KPI Dashboard With Current Risk Statistics Topics PDF. This layout presents information on Current Risk SLAS, Current Breached Slas, Personal Active SLA It is also available for immediate download and adjustment. So, changes can be made in the color, design, graphics or any other component to create a unique layout.
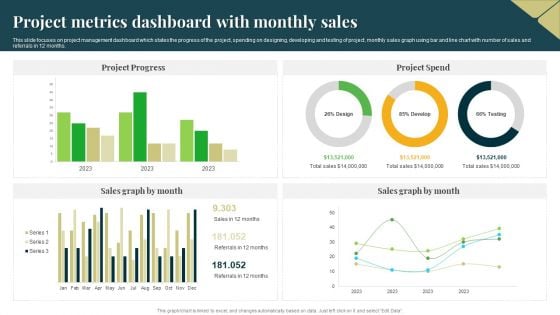
Project Metrics Dashboard With Monthly Sales Professional PDF
This slide focuses on project management dashboard which states the progress of the project, spending on designing, developing and testing of project, monthly sales graph using bar and line chart with number of sales and referrals in 12 months. Pitch your topic with ease and precision using this Project Metrics Dashboard With Monthly Sales Professional PDF. This layout presents information on Project Progress, Project Spend, Sales Graph. It is also available for immediate download and adjustment. So, changes can be made in the color, design, graphics or any other component to create a unique layout.
New Staff Onboarding Process KPI Tracking Dashboard Inspiration PDF
This slide showcase the KPI dashboard for tracking new hire onboarding completion progress. It includes KPIs such as onboarding completion status, employees per office, progress chart, hires starting in current and next week. Showcasing this set of slides titled New Staff Onboarding Process KPI Tracking Dashboard Inspiration PDF. The topics addressed in these templates are New Staff Onboarding Process, KPI Tracking Dashboard. All the content presented in this PPT design is completely editable. Download it and make adjustments in color, background, font etc. as per your unique business setting.
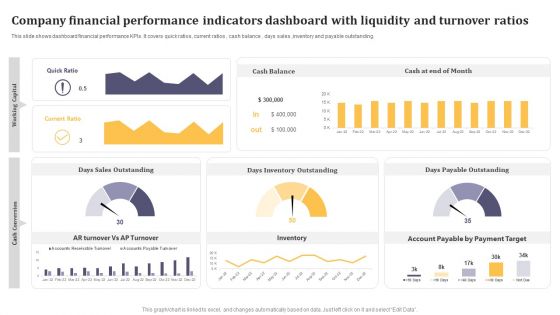
Company Financial Performance Indicators Dashboard With Liquidity And Turnover Ratios Formats PDF
This graph or chart is linked to excel, and changes automatically based on data. Just left click on it and select Edit Data. Pitch your topic with ease and precision using this Company Financial Performance Indicators Dashboard With Liquidity And Turnover Ratios Formats PDF. This layout presents information on Cash Balance, Days Inventory Outstanding, Days Payable Outstanding. It is also available for immediate download and adjustment. So, changes can be made in the color, design, graphics or any other component to create a unique layout.


 Continue with Email

 Home
Home


