Resource Projection
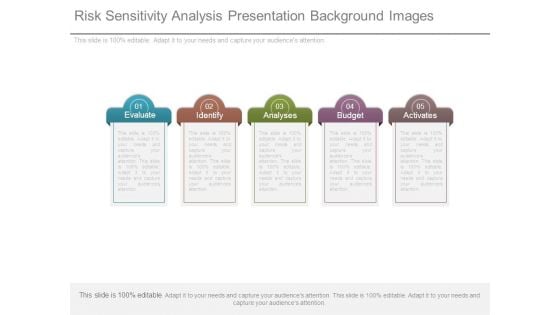
Risk Sensitivity Analysis Presentation Background Images
This is a risk sensitivity analysis presentation background images. This is a five stage process. The stages in this process are evaluate, identify, analyses, budget, activates.
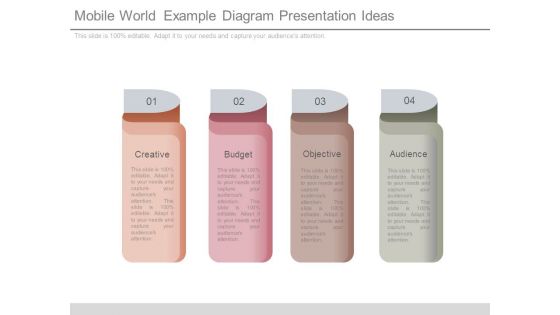
Mobile World Example Diagram Presentation Ideas
This is a mobile world example diagram presentation ideas. This is a four stage process. The stages in this process are creative, budget, objective, audience.
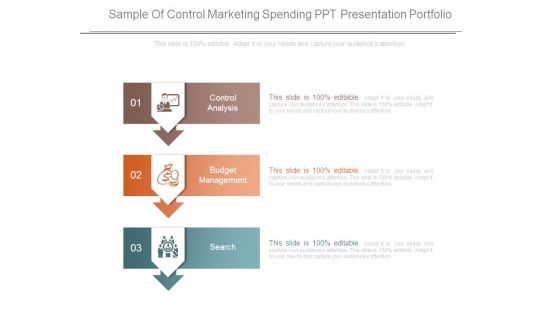
Sample Of Control Marketing Spending Ppt Presentation Portfolio
This is a sample of control marketing spending ppt presentation portfolio. This is a three stage process. The stages in this process are control analysis, budget management, search.
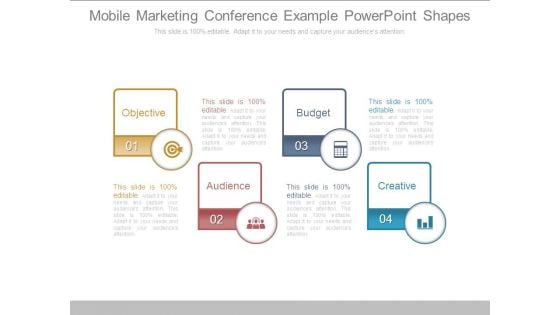
Mobile Marketing Conference Example Powerpoint Shapes
This is a mobile marketing conference example powerpoint shapes. This is a four stage process. The stages in this process are objective, budget, creative, audience.
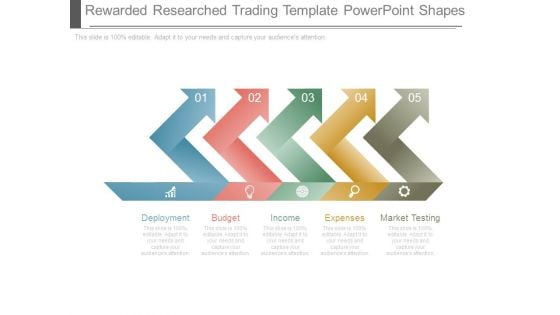
Rewarded Researched Trading Template Powerpoint Shapes
This is a rewarded researched trading template powerpoint shapes. This is a five stage process. The stages in this process are deployment, budget, income, expenses, market testing.
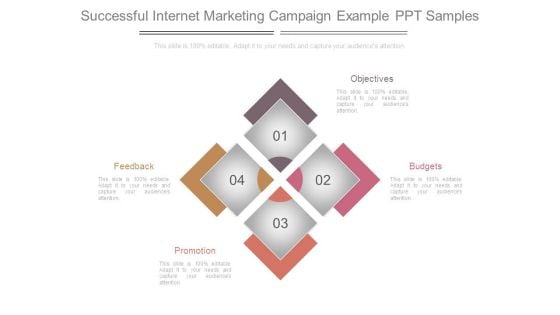
Successful Internet Marketing Campaign Example Ppt Samples
This is a successful internet marketing campaign example ppt samples. This is a four stage process. The stages in this process are promotion, feedback, budgets, objectives.
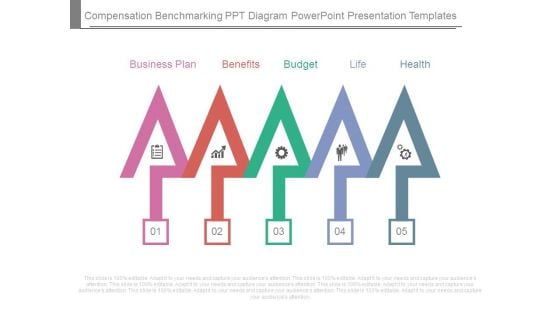
Compensation Benchmarking Ppt Diagram Powerpoint Presentation Templates
This is a compensation benchmarking ppt diagram powerpoint presentation templates. This is a five stage process. The stages in this process are business plan, benefits, budget, life, health.
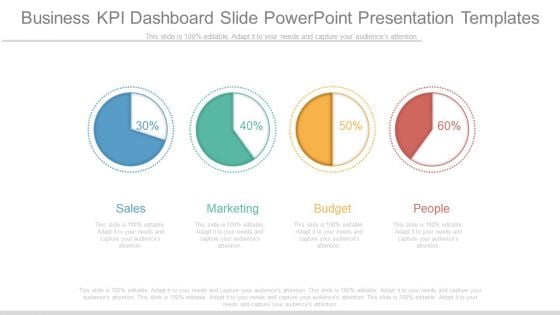
Business Kpi Dashboard Slide Powerpoint Presentation Templates
This is a business kpi dashboard slide powerpoint presentation templates. This is a four stage process. The stages in this process are sales, marketing, budget, people.
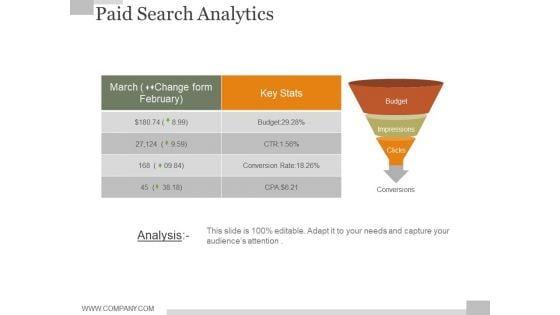
Paid Search Analytics Ppt PowerPoint Presentation Guidelines
This is a paid search analytics ppt powerpoint presentation guidelines. This is a three stage process. The stages in this process are budget, impressions, clicks.
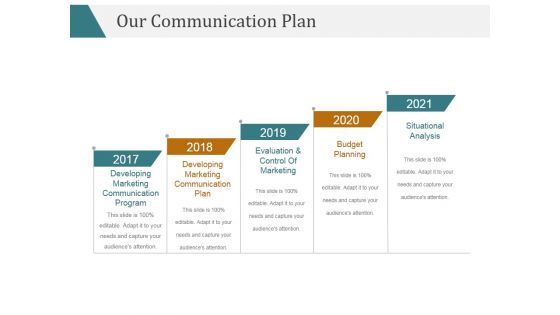
Our Communication Plan Ppt PowerPoint Presentation Ideas
This is a our communication plan ppt powerpoint presentation ideas. This is a five stage process. The stages in this process are budget planning, situational analysis.
Marketing Mix Modelling Ppt PowerPoint Presentation Icon
This is a marketing mix modelling ppt powerpoint presentation icon. This is a nine stage process. The stages in this process are communication, modelling, data collection, budget allocation.
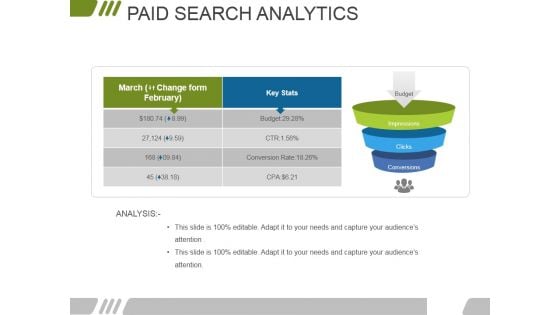
Paid Search Analytics Ppt PowerPoint Presentation Portfolio Ideas
This is a paid search analytics ppt powerpoint presentation portfolio ideas. This is a three stage process. The stages in this process are budget, impressions, clicks, conversions.
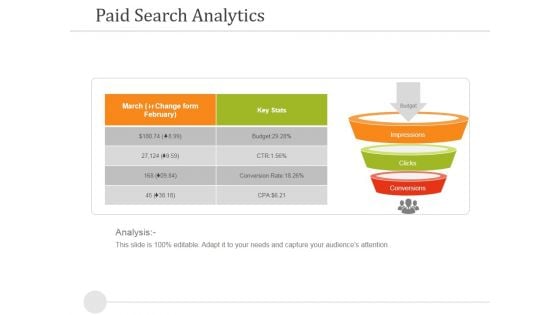
Paid Search Analytics Ppt PowerPoint Presentation Model Diagrams
This is a paid search analytics ppt powerpoint presentation model diagrams. This is a three stage process. The stages in this process are budget, impressions, clicks, conversions.
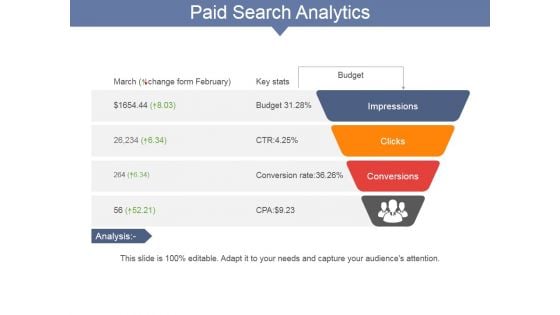
Paid Search Analytics Ppt PowerPoint Presentation Summary Infographic Template
This is a paid search analytics ppt powerpoint presentation summary infographic template. This is a four stage process. The stages in this process are impressions, clicks, conversions, budget.
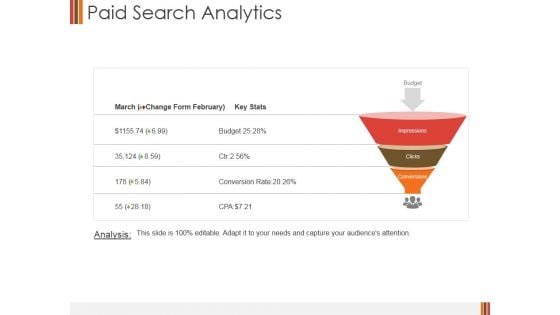
Paid Search Analytics Ppt PowerPoint Presentation Infographics Picture
This is a paid search analytics ppt powerpoint presentation infographics picture. This is a three stage process. The stages in this process are impressions, clicks, conversions, budget.
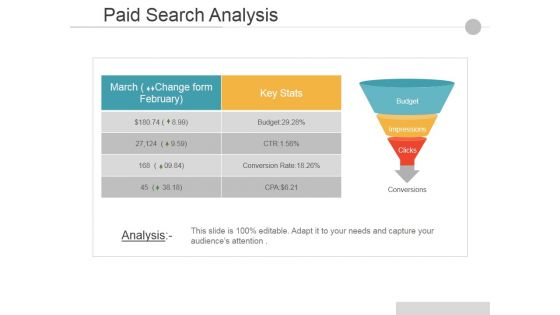
Paid Search Analysis Ppt PowerPoint Presentation Professional Graphics Design
This is a Paid Search Analysis Ppt PowerPoint Presentation Professional Graphics Design. This is a two stage process. The stages in this process are Budget, Impressions, Clicks.

Paid Search Analytics Ppt PowerPoint Presentation Layouts Skills
This is a paid search analytics ppt powerpoint presentation layouts skills. This is a three stage process. The stages in this process are impressions, budget, clicks, conversions.
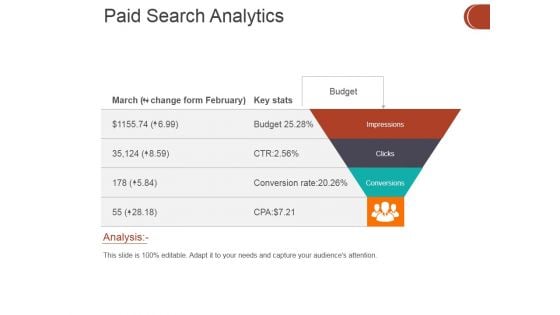
Paid Search Analytics Ppt PowerPoint Presentation Show Graphics Tutorials
This is a paid search analytics ppt powerpoint presentation show graphics tutorials. This is a four stage process. The stages in this process are impressions, clicks, conversions, budget.
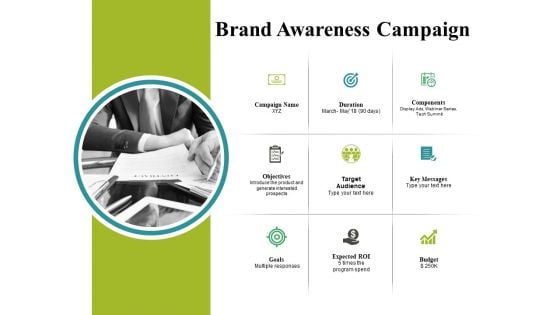
Brand Awareness Campaign Ppt PowerPoint Presentation Layout
This is a brand awareness campaign ppt powerpoint presentation layout. This is a three stage process. The stages in this process are duration, component, target audience, objectives, budget.
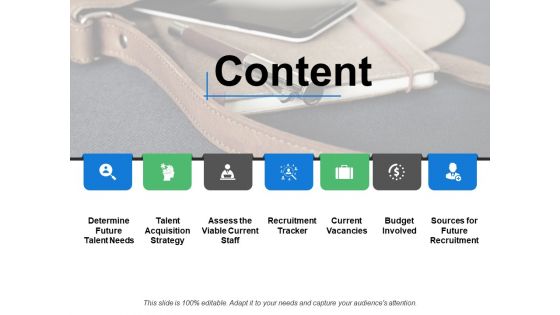
Content Ppt PowerPoint Presentation Inspiration Visuals
This is a content ppt powerpoint presentation inspiration visuals. This is a seven stage process. The stages in this process are current vacancies, budget involved, recruitment tracker.
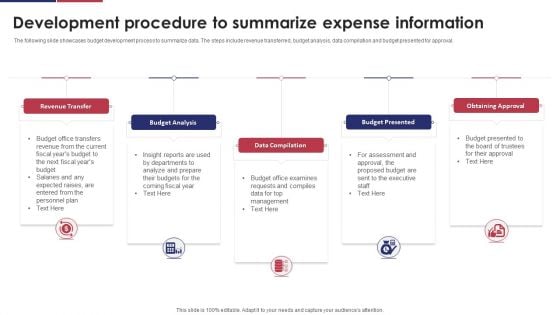
Development Procedure To Summarize Expense Information Ppt Layouts Sample PDF
The following slide showcases budget development process to summarize data. The steps include revenue transferred, budget analysis, data compilation and budget presented for approval. Persuade your audience using this Development Procedure To Summarize Expense Information Ppt Layouts Sample PDF. This PPT design covers five stages, thus making it a great tool to use. It also caters to a variety of topics including Revenue Transfer, Budget Analysis, Data Compilation. Download this PPT design now to present a convincing pitch that not only emphasizes the topic but also showcases your presentation skills.
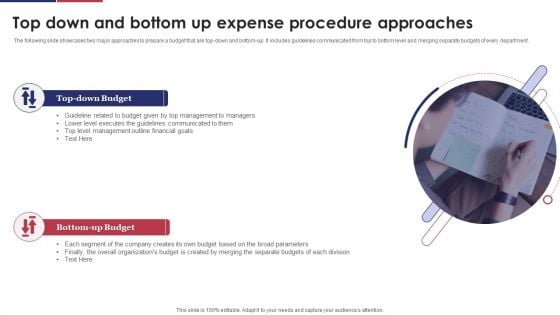
Top Down And Bottom Up Expense Procedure Approaches Ppt Inspiration Design Inspiration PDF
The following slide showcases two major approaches to prepare a budget that are top-down and bottom-up. It includes guidelines communicated from top to bottom level and merging separate budgets of every department. Persuade your audience using this Top Down And Bottom Up Expense Procedure Approaches Ppt Inspiration Design Inspiration PDF. This PPT design covers two stages, thus making it a great tool to use. It also caters to a variety of topics including Top Down Budget, Bottom Up Budget. Download this PPT design now to present a convincing pitch that not only emphasizes the topic but also showcases your presentation skills.
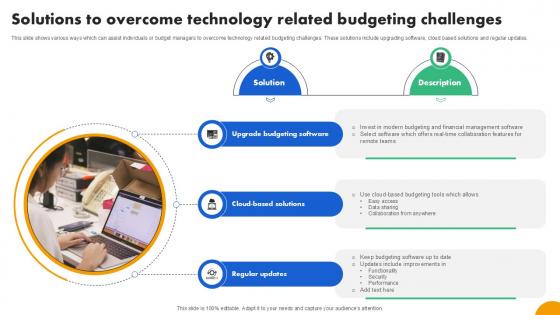
Solutions To Overcome Technology Strategies To Develop Effective Ppt Presentation Fin SS V
This slide shows various ways which can assist individuals or budget managers to overcome technology related budgeting challenges. These solutions include upgrading software, cloud based solutions and regular updates. There are so many reasons you need a Solutions To Overcome Technology Strategies To Develop Effective Ppt Presentation Fin SS V. The first reason is you can not spend time making everything from scratch, Thus, Slidegeeks has made presentation templates for you too. You can easily download these templates from our website easily. This slide shows various ways which can assist individuals or budget managers to overcome technology related budgeting challenges. These solutions include upgrading software, cloud based solutions and regular updates.
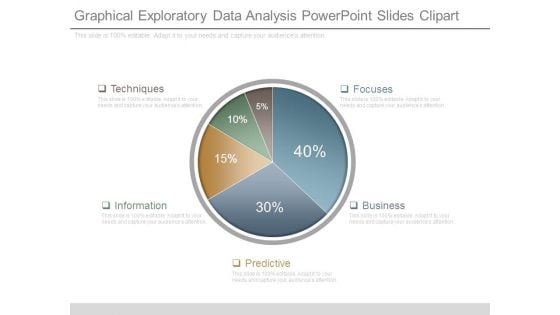
Graphical Exploratory Data Analysis Powerpoint Slides Clipart
This is a graphical exploratory data analysis powerpoint slides clipart. This is a five stage process. The stages in this process are techniques, information, predictive, focuses, business.
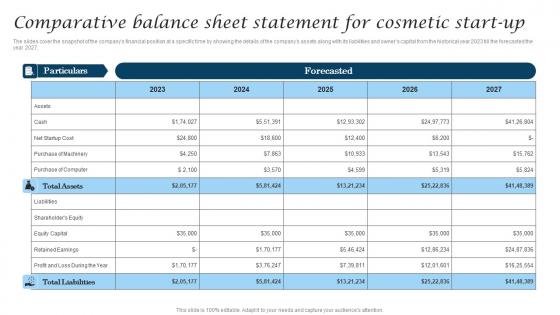
Comparative Balance Sheet Statement For Cosmetic Industry Business Information Pdf
The slides cover the snapshot of the companys financial position at a specific time by showing the details of the companys assets along with its liabilities and owners capital from the historical year 2023 till the forecasted the year 2027. Get a simple yet stunning designed Comparative Balance Sheet Statement For Cosmetic Industry Business Information Pdf. It is the best one to establish the tone in your meetings. It is an excellent way to make your presentations highly effective. So, download this PPT today from Slidegeeks and see the positive impacts. Our easy-to-edit Comparative Balance Sheet Statement For Cosmetic Industry Business Information Pdf can be your go-to option for all upcoming conferences and meetings. So, what are you waiting for Grab this template today. The slides cover the snapshot of the companys financial position at a specific time by showing the details of the companys assets along with its liabilities and owners capital from the historical year 2023 till the forecasted the year 2027.
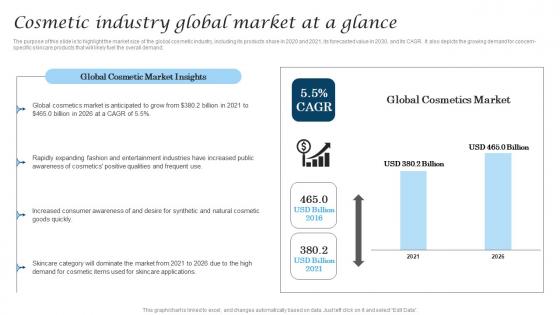
Cosmetic Industry Global Market At A Glance Cosmetic Industry Business Infographics Pdf
The purpose of this slide is to highlight the market size of the global cosmetic industry, including its products share in 2020 and 2021, its forecasted value in 2030, and its CAGR. It also depicts the growing demand for concern-specific skincare products that will likely fuel the overall demand. Whether you have daily or monthly meetings, a brilliant presentation is necessary. Cosmetic Industry Global Market At A Glance Cosmetic Industry Business Infographics Pdf can be your best option for delivering a presentation. Represent everything in detail using Cosmetic Industry Global Market At A Glance Cosmetic Industry Business Infographics Pdf and make yourself stand out in meetings. The template is versatile and follows a structure that will cater to your requirements. All the templates prepared by Slidegeeks are easy to download and edit. Our research experts have taken care of the corporate themes as well. So, give it a try and see the results. The purpose of this slide is to highlight the market size of the global cosmetic industry, including its products share in 2020 and 2021, its forecasted value in 2030, and its CAGR. It also depicts the growing demand for concern-specific skincare products that will likely fuel the overall demand.
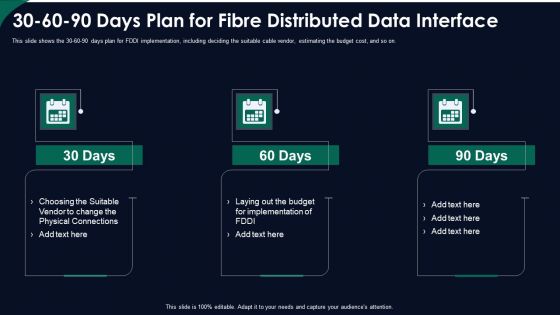
FDDI Network Standard IT 30 60 90 Days Plan For Fibre Distributed Data Interface Ppt Inspiration Diagrams PDF
This slide shows the 30 60 90 days plan for FDDI implementation, including deciding the suitable cable vendor, estimating the budget cost, and so on. This is a fddi network standard it 30 60 90 days plan for fibre distributed data interface ppt inspiration diagrams pdf template with various stages. Focus and dispense information on three stages using this creative set, that comes with editable features. It contains large content boxes to add your information on topics like 30 60 90 days plan for fibre distributed data interface. You can also showcase facts, figures, and other relevant content using this PPT layout. Grab it now.

Flowchart Process Of Launching Strategies Of Product To Market Pictures PDF
This slide represent the sequence of steps or decision needed to perform in order to launch a product to market. It includes steps like evaluating idea, developing prototype, identify audience and market, estimating budget etc. Persuade your audience using this Flowchart Process Of Launching Strategies Of Product To Market Pictures PDF. This PPT design covers Seven stages, thus making it a great tool to use. It also caters to a variety of topics including Evaluate Your Product Idea, Develop High Quality Prototype, Evaluate Cost Marketing. Download this PPT design now to present a convincing pitch that not only emphasizes the topic but also showcases your presentation skills.
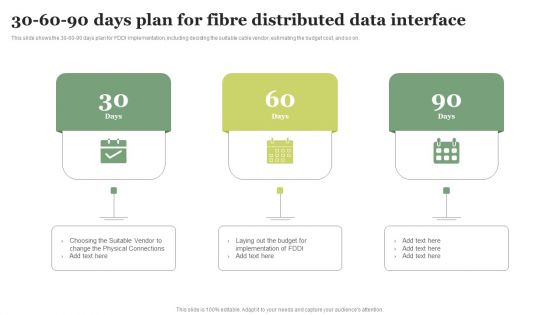
30 60 90 Days Plan For Fibre Distributed Data Interface Microsoft PDF
This slide shows the 30 60 90 days plan for FDDI implementation, including deciding the suitable cable vendor, estimating the budget cost, and so on. Find a pre designed and impeccable 30 60 90 Days Plan For Fibre Distributed Data Interface Microsoft PDF. The templates can ace your presentation without additional effort. You can download these easy to edit presentation templates to make your presentation stand out from others. So, what are you waiting for Download the template from Slidegeeks today and give a unique touch to your presentation.
Business Communication PowerPoint Icon C
Microsoft PowerPoint Template and Background with Business Communication as a Conceptual Tech Art Predict challenges with our Business Communication PowerPoint Icon C. Download without worries with our money back guaranteee.
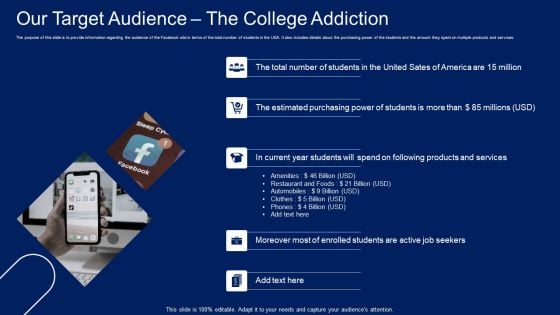
Facebook Original Elevator Funding Pitch Deck Our Target Audience The College Addiction Structure PDF
The purpose of this slide is to provide information regarding the audience of the Facebook site in terms of the total number of students in the USA. It also includes details about the purchasing power of the students and the amount they spent on multiple products and services. Presenting Facebook Original Elevator Funding Pitch Deck Our Target Audience The College Addiction Structure PDF to provide visual cues and insights. Share and navigate important information on five stages that need your due attention. This template can be used to pitch topics like Estimated Purchasing Power, Our Target Audience. In addtion, this PPT design contains high resolution images, graphics, etc, that are easily editable and available for immediate download.
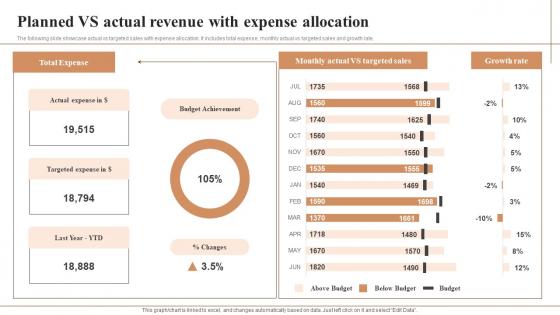
Planned Vs Actual Revenue With Expense Allocation Professional Pdf
The following slide showcase actual vs targeted sales with expense allocation. It includes total expense, monthly actual vs targeted sales and growth rate. Showcasing this set of slides titled Planned Vs Actual Revenue With Expense Allocation Professional Pdf The topics addressed in these templates are Targeted Sales, Growth Rate, Budget Achievement All the content presented in this PPT design is completely editable. Download it and make adjustments in color, background, font etc. as per your unique business setting. The following slide showcase actual vs targeted sales with expense allocation. It includes total expense, monthly actual vs targeted sales and growth rate.
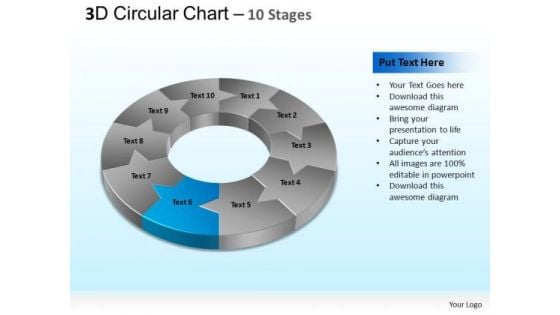
PowerPoint Slide Designs Business Circular Ppt Templates
PowerPoint Slide Designs Business Circular PPT Templates-The Circle of Life - a concept emmbedded in our minds and hence easy to comprehend. Life and Business is made up of processes comprising stages that flow from one to another. An excellent graphic to attract the attention of and understanding by your audience to improve earnings. You have envisaged a bright future for your organisation. Deliver your forecast on our PowerPoint Slide Designs Business Circular Ppt Templates.
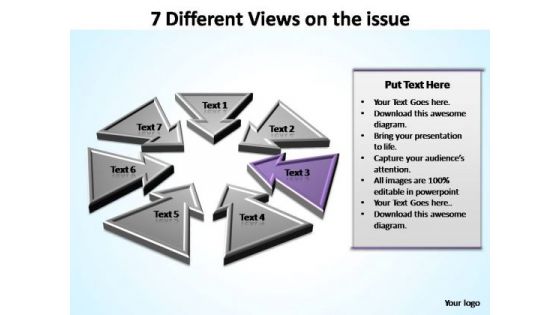
PowerPoint Theme Strategy Views Ppt Slides
PowerPoint Theme Strategy Views PPT Slides-Explore the various directions and layers existing in your in your plans and processes. Unravel the desired and essential elements of your overall strategy. Explain the relevance of the different layers and stages and directions in getting down to your core competence, ability and desired result. You have envisaged a bright future for your organisation. Deliver your forecast on our PowerPoint Theme Strategy Views Ppt Slides.

Overcoming Challenges And Facing Obstacles PowerPoint Templates Ppt Backgrounds For Slides 0713
Generate camaradarie with our Overcoming Challenges And Facing Obstacles PowerPoint Templates PPT Backgrounds For Slides. Good wishes will come raining down. Good camaradarie is a key to teamwork. Our Competition PowerPoint Templates can be a cementing force. Our Success PowerPoint Templates are an agent of change. Let your thoughts go down uncharted courses. You have envisaged a bright future for your organisation. Deliver your forecast on our Overcoming Challenges And Facing Obstacles PowerPoint Templates Ppt Backgrounds For Slides 0713.
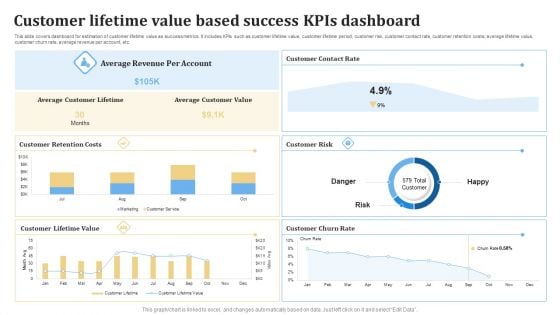
Customer Lifetime Value Based Success KPIS Dashboard Ppt PowerPoint Presentation Layouts Gridlines PDF
This slide covers dashboard for estimation of customer lifetime value as success metrics. It includes KPIs such as customer lifetime value, customer lifetime period, customer risk, customer contact rate, customer retention costs, average lifetime value, customer churn rate, average revenue per account, etc. Pitch your topic with ease and precision using this Customer Lifetime Value Based Success KPIS Dashboard Ppt PowerPoint Presentation Layouts Gridlines PDF. This layout presents information on Average Revenue, Customer Lifetime, Customer Risk. It is also available for immediate download and adjustment. So, changes can be made in the color, design, graphics or any other component to create a unique layout.
Dashboard For Tracking Impact Of Procurement Process Automation Rules PDF
This slide covers the dashboard for analysing procurement performance after automation. It include KPIs such as on-time delivery, percentage of returns, compliance index percentage, procurement ROI, cost-saving, budget spent on training, etc. Slidegeeks is here to make your presentations a breeze with Dashboard For Tracking Impact Of Procurement Process Automation Rules PDF With our easy-to-use and customizable templates, you can focus on delivering your ideas rather than worrying about formatting. With a variety of designs to choose from, you are sure to find one that suits your needs. And with animations and unique photos, illustrations, and fonts, you can make your presentation pop. So whether you are giving a sales pitch or presenting to the board, make sure to check out Slidegeeks first.
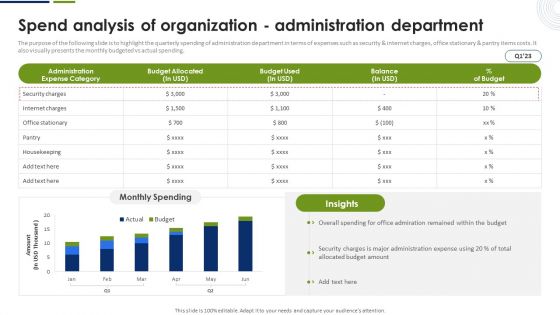
Spend Analysis Of Organization Administration Department Graphics PDF
The purpose of the following slide is to highlight the quarterly spending of administration department in terms of expenses such as security and internet charges, office stationary and pantry items costs. It also visually presents the monthly budgeted vs actual spending. Explore a selection of the finest Spend Analysis Of Organization Administration Department Graphics PDF here. With a plethora of professionally designed and pre made slide templates, you can quickly and easily find the right one for your upcoming presentation. You can use our Spend Analysis Of Organization Administration Department Graphics PDF to effectively convey your message to a wider audience. Slidegeeks has done a lot of research before preparing these presentation templates. The content can be personalized and the slides are highly editable. Grab templates today from Slidegeeks.
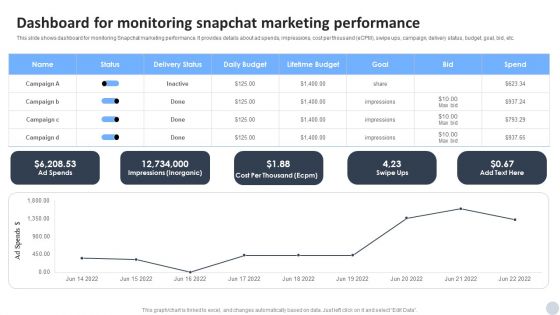
Social Media Marketing Strategies To Generate Lead Dashboard For Monitoring Snapchat Marketing Performance Infographics PDF
This slide shows dashboard for monitoring Snapchat marketing performance. It provides details about ad spends, impressions, cost per thousand eCPM, swipe ups, campaign, delivery status, budget, goal, bid, etc. Create an editable Social Media Marketing Strategies To Generate Lead Dashboard For Monitoring Snapchat Marketing Performance Infographics PDF that communicates your idea and engages your audience. Whether you are presenting a business or an educational presentation, pre designed presentation templates help save time. Social Media Marketing Strategies To Generate Lead Dashboard For Monitoring Snapchat Marketing Performance Infographics PDF is highly customizable and very easy to edit, covering many different styles from creative to business presentations. Slidegeeks has creative team members who have crafted amazing templates. So, go and get them without any delay.
Integrating AI To Enhance Dashboard For Tracking Impact Of Procurement Process Slides PDF
This slide covers the dashboard for analysing procurement performance after automation. It include KPIs such as on-time delivery, percentage of returns, compliance index percentage, procurement ROI, cost-saving, budget spent on training, etc. Slidegeeks is here to make your presentations a breeze with Integrating AI To Enhance Dashboard For Tracking Impact Of Procurement Process Slides PDF With our easy-to-use and customizable templates, you can focus on delivering your ideas rather than worrying about formatting. With a variety of designs to choose from, youre sure to find one that suits your needs. And with animations and unique photos, illustrations, and fonts, you can make your presentation pop. So whether youre giving a sales pitch or presenting to the board, make sure to check out Slidegeeks first.
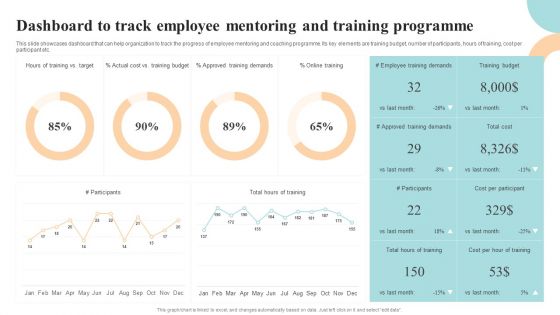
Workforce Growth And Improvement Dashboard To Track Employee Mentoring Guidelines PDF
This slide showcases dashboard that can help organization to track the progress of employee mentoring and coaching programme. Its key elements are training budget, number of participants, hours of training, cost per participant etc. Crafting an eye-catching presentation has never been more straightforward. Let your presentation shine with this tasteful yet straightforward Workforce Growth And Improvement Dashboard To Track Employee Mentoring Guidelines PDF template. It offers a minimalistic and classy look that is great for making a statement. The colors have been employed intelligently to add a bit of playfulness while still remaining professional. Construct the ideal Workforce Growth And Improvement Dashboard To Track Employee Mentoring Guidelines PDF that effortlessly grabs the attention of your audience Begin now and be certain to wow your customers.
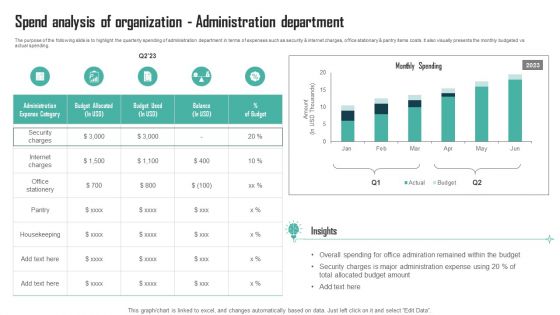
Expenses Management Plan Spend Analysis Of Organization Administration Department Professional PDF
The purpose of the following slide is to highlight the quarterly spending of administration department in terms of expenses such as security and internet charges, office stationary and pantry items costs. It also visually presents the monthly budgeted vs actual spending. Coming up with a presentation necessitates that the majority of the effort goes into the content and the message you intend to convey. The visuals of a PowerPoint presentation can only be effective if it supplements and supports the story that is being told. Keeping this in mind our experts created Expenses Management Plan Spend Analysis Of Organization Administration Department Professional PDF to reduce the time that goes into designing the presentation. This way, you can concentrate on the message while our designers take care of providing you with the right template for the situation.
Playbook For Advancing Technology Managing It Services Spending Tracking Dashboard Clipart PDF
This slide provides information regarding the management of the digital services performance and IT spending tracking dashboard in terms of ROI, spend vs. budget, IT costs software, hardware, personnel and goals, IT spending in terms of revenues, etc. Are you in need of a template that can accommodate all of your creative concepts This one is crafted professionally and can be altered to fit any style. Use it with Google Slides or PowerPoint. Include striking photographs, symbols, depictions, and other visuals. Fill, move around, or remove text boxes as desired. Test out color palettes and font mixtures. Edit and save your work, or work with colleagues. Download Playbook For Advancing Technology Managing It Services Spending Tracking Dashboard Clipart PDF and observe how to make your presentation outstanding. Give an impeccable presentation to your group and make your presentation unforgettable.
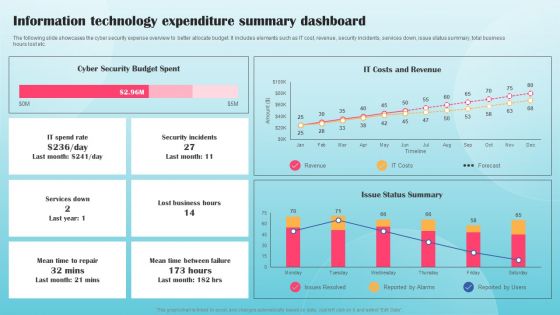
Information Technology Expenditure Summary Dashboard Ppt PowerPoint Presentation Diagram Graph Charts PDF
The following slide showcases the cyber security expense overview to better allocate budget. It includes elements such as IT cost, revenue, security incidents, services down, issue status summary, total business hours lost etc. This Information Technology Expenditure Summary Dashboard Ppt PowerPoint Presentation Diagram Graph Charts PDF from Slidegeeks makes it easy to present information on your topic with precision. It provides customization options, so you can make changes to the colors, design, graphics, or any other component to create a unique layout. It is also available for immediate download, so you can begin using it right away. Slidegeeks has done good research to ensure that you have everything you need to make your presentation stand out. Make a name out there for a brilliant performance.
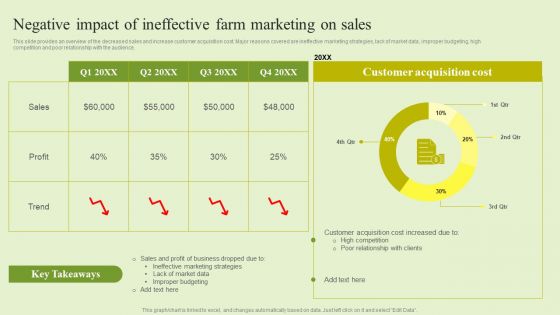
Agriculture Marketing Strategy To Improve Revenue Performance Negative Impact Of Ineffective Farm Marketing On Sales Clipart PDF
This slide provides an overview of the decreased sales and increase customer acquisition cost. Major reasons covered are ineffective marketing strategies, lack of market data, improper budgeting, high competition and poor relationship with the audience. Slidegeeks has constructed Agriculture Marketing Strategy To Improve Revenue Performance Negative Impact Of Ineffective Farm Marketing On Sales Clipart PDF after conducting extensive research and examination. These presentation templates are constantly being generated and modified based on user preferences and critiques from editors. Here, you will find the most attractive templates for a range of purposes while taking into account ratings and remarks from users regarding the content. This is an excellent jumping off point to explore our content and will give new users an insight into our top notch PowerPoint Templates.
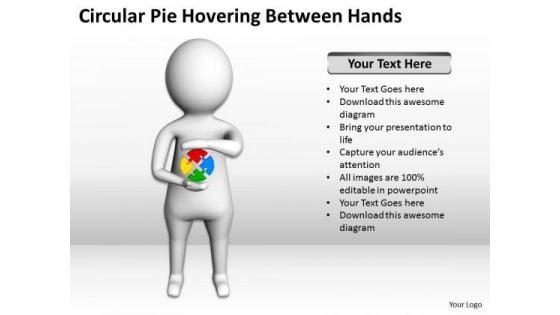
Business Persons 3d Man Circular Pie Hovering Between Hands PowerPoint Templates
We present our business persons 3d man circular pie hovering between hands PowerPoint templates.Present our People PowerPoint Templates because Our PowerPoint Templates and Slides have the Brilliant backdrops. Guaranteed to illuminate the minds of your audience. Present our Business PowerPoint Templates because Our PowerPoint Templates and Slides offer you the widest possible range of options. Use our Pie charts PowerPoint Templates because Our PowerPoint Templates and Slides has conjured up a web of all you need with the help of our great team. Use them to string together your glistening ideas. Download and present our Marketing PowerPoint Templates because You have gained great respect for your brilliant ideas. Use our PowerPoint Templates and Slides to strengthen and enhance your reputation. Use our Success PowerPoint Templates because You have a driving passion to excel in your field. Our PowerPoint Templates and Slides will prove ideal vehicles for your ideas.Use these PowerPoint slides for presentations relating to 3d, account, accounting, analysis, blue, business, chart, colorful,company, concept, conference, corporate, data, diagram, earnings, economic,economy, enterprise, finance, financial, forecast, graph, graphic, growth,illustration, information, investment, management, market, marketing, meeting,money, office, percentage, performance, pie, plan, presentation, profit, progress,render, report, research, results, sales, slice, statistics, success. The prominent colors used in the PowerPoint template are White, Blue, Green. Professionals tell us our business persons 3d man circular pie hovering between hands PowerPoint templates effectively help you save your valuable time. People tell us our blue PowerPoint templates and PPT Slides are effectively colour coded to prioritise your plans They automatically highlight the sequence of events you desire. We assure you our business persons 3d man circular pie hovering between hands PowerPoint templates have awesome images to get your point across. Presenters tell us our analysis PowerPoint templates and PPT Slides are specially created by a professional team with vast experience. They diligently strive to come up with the right vehicle for your brilliant Ideas. We assure you our business persons 3d man circular pie hovering between hands PowerPoint templates will make the presenter look like a pro even if they are not computer savvy. PowerPoint presentation experts tell us our business PowerPoint templates and PPT Slides are second to none. Assess targets with our Business Persons 3d Man Circular Pie Hovering Between Hands PowerPoint Templates. Download without worries with our money back guaranteee.
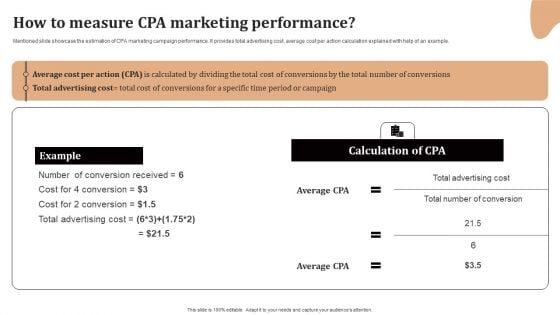
Significance Of CPA To Maximize Digital Marketing ROI How To Measure CPA Marketing Performance Infographics PDF
Mentioned slide showcase the estimation of CPA marketing campaign performance. It provides total advertising cost, average cost per action calculation explained with help of an example. Find a pre-designed and impeccable Significance Of CPA To Maximize Digital Marketing ROI How To Measure CPA Marketing Performance Infographics PDF. The templates can ace your presentation without additional effort. You can download these easy-to-edit presentation templates to make your presentation stand out from others. So, what are you waiting for Download the template from Slidegeeks today and give a unique touch to your presentation.
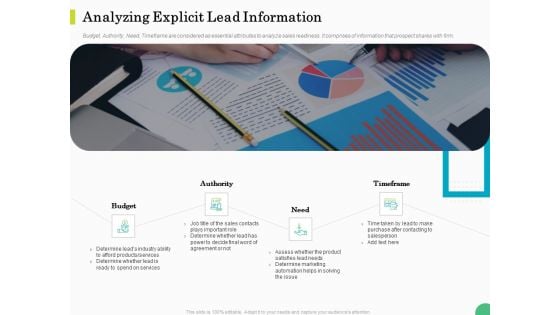
Evaluating Rank Prospects Analyzing Explicit Lead Information Authority Ppt Styles Model PDF
Budget, Authority, Need, Timeframe are considered as essential attributes to analyze sales readiness. It comprises of information that prospect shares with firm. This is a evaluating rank prospects analyzing explicit lead information authority ppt styles model pdf template with various stages. Focus and dispense information on four stages using this creative set, that comes with editable features. It contains large content boxes to add your information on topics like budget, authority, need, timeframe. You can also showcase facts, figures, and other relevant content using this PPT layout. Grab it now.
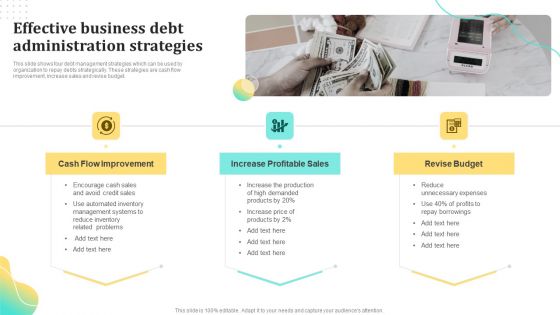
Effective Business Debt Administration Strategies Ppt Infographic Template Design Inspiration PDF
This slide shows four debt management strategies which can be used by organization to repay debts strategically. These strategies are cash flow improvement, increase sales and revise budget. Presenting Effective Business Debt Administration Strategies Ppt Infographic Template Design Inspiration PDF to dispense important information. This template comprises three stages. It also presents valuable insights into the topics including Cash Flow Improvement, Increase Profitable Sales, Revise Budget. This is a completely customizable PowerPoint theme that can be put to use immediately. So, download it and address the topic impactfully.
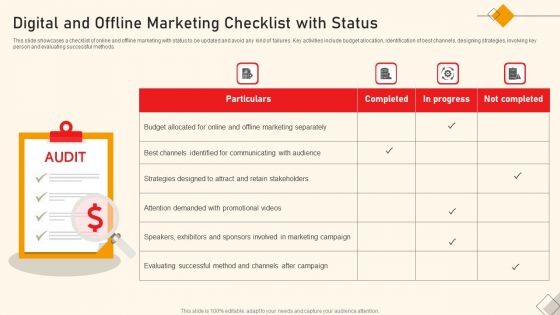
Digital And Offline Marketing Checklist With Status Ppt Professional Styles PDF
This slide showcases a checklist of online and offline marketing with status to be updated and avoid any kind of failures. Key activities include budget allocation, identification of best channels, designing strategies, involving key person and evaluating successful methods. Presenting Digital And Offline Marketing Checklist With Status Ppt Professional Styles PDF to dispense important information. This template comprises four stages. It also presents valuable insights into the topics including Budget Allocated, Online And Offline, Marketing Separately. This is a completely customizable PowerPoint theme that can be put to use immediately. So, download it and address the topic impactfully.
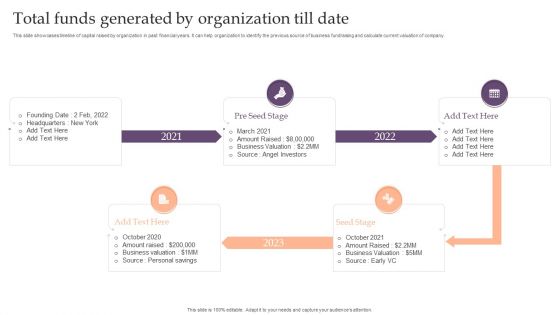
Assessing Debt And Equity Fundraising Alternatives For Business Growth Total Funds Generated By Organization Till Date Pictures PDF
This slide showcases timeline of capital raised by organization in past financial years. It can help organization to identify the previous source of business fundraising and calculate current valuation of company. Want to ace your presentation in front of a live audience. Our Assessing Debt And Equity Fundraising Alternatives For Business Growth Total Funds Generated By Organization Till Date Pictures PDF can help you do that by engaging all the users towards you. Slidegeeks experts have put their efforts and expertise into creating these impeccable powerpoint presentations so that you can communicate your ideas clearly. Moreover, all the templates are customizable, and easy to edit and downloadable. Use these for both personal and commercial use.
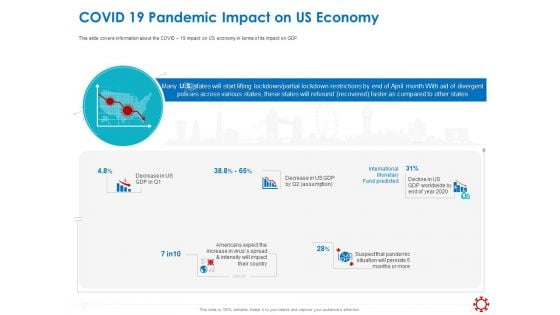
Assessing The Impact Of COVID On Retail Business Segment Covid 19 Pandemic Impact On Us Economy Clipart PDF
Presenting this set of slides with name assessing the impact of covid on retail business segment covid 19 pandemic impact on us economy clipart pdf. This is a five stage process. The stages in this process are decrease us gdp in q1, decrease us gdp, international monetary, fund predicted, americans expect. This is a completely editable PowerPoint presentation and is available for immediate download. Download now and impress your audience.
Changing Appearance Leadership PowerPoint Presetation Slides R
Microsoft PowerPoint Slides and Background with changing appearance Put your estimates on the line. Our Changing Appearance Leadership PowerPoint Presetation Slides R will establish their accuracy.
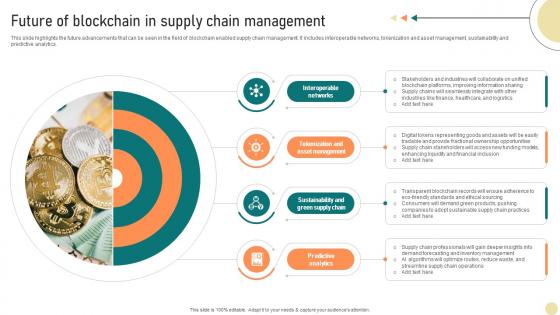
A116 Visionary Guide To Blockchain Technologys Future Of Blockchain In Supply Chain BCT SS V
This slide highlights the future advancements that can be seen in the field of blockchain enabled supply chain management. It includes interoperable networks, tokenization and asset management, sustainability and predictive analytics. Find a pre-designed and impeccable A116 Visionary Guide To Blockchain Technologys Future Of Blockchain In Supply Chain BCT SS V. The templates can ace your presentation without additional effort. You can download these easy-to-edit presentation templates to make your presentation stand out from others. So, what are you waiting for Download the template from Slidegeeks today and give a unique touch to your presentation. This slide highlights the future advancements that can be seen in the field of blockchain enabled supply chain management. It includes interoperable networks, tokenization and asset management, sustainability and predictive analytics.
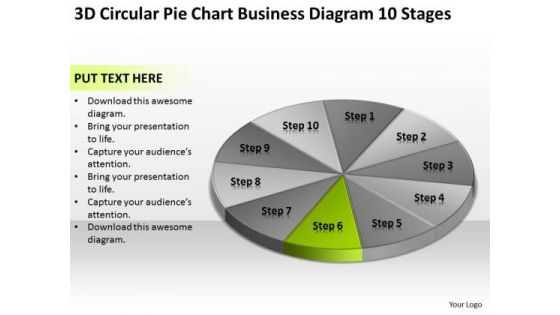
Pie Chart Business Diagram 10 Stages Creating Small Plan PowerPoint Slides
We present our pie chart business diagram 10 stages creating small plan PowerPoint Slides.Present our Flow Charts PowerPoint Templates because Our PowerPoint Templates and Slides will provide you a launch platform. Give a lift off to your ideas and send them into orbit. Present our Process and Flows PowerPoint Templates because Our PowerPoint Templates and Slides will give good value for money. They also have respect for the value of your time. Present our Marketing PowerPoint Templates because Our PowerPoint Templates and Slides will fulfill your every need. Use them and effectively satisfy the desires of your audience. Use our Business PowerPoint Templates because It will mark the footprints of your journey. Illustrate how they will lead you to your desired destination. Download our Shapes PowerPoint Templates because They will bring a lot to the table. Their alluring flavours will make your audience salivate.Use these PowerPoint slides for presentations relating to Graph, icon, market, isolated, statistics, percent, economics, ten, economy, display, business, render, success, presentation,diagram, circle, data, analyst, analysis, bank, report, calculation, accounting, trend, illustration, three, piece, pie, circular, chart, money, dimensional, clipart,accountant, growth, colorful, competition, account, stats, profit, part, information, background, improvement, financial. The prominent colors used in the PowerPoint template are Gray, Green, Black. Go to any extent with our Pie Chart Business Diagram 10 Stages Creating Small Plan PowerPoint Slides. Whatever the distance they will cover it with you.
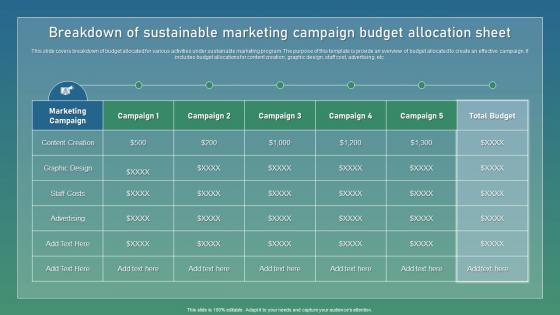
Breakdown Of Sustainable Marketing Strategic Guide For Sustainable Mockup Pdf
This slide covers breakdown of budget allocated for various activities under sustainable marketing program. The purpose of this template is provide an overview of budget allocated to create an effective campaign. It includes budget allocations for content creation, graphic design, staff cost, advertising, etc. Want to ace your presentation in front of a live audience Our Breakdown Of Sustainable Marketing Strategic Guide For Sustainable Mockup Pdf can help you do that by engaging all the users towards you. Slidegeeks experts have put their efforts and expertise into creating these impeccable powerpoint presentations so that you can communicate your ideas clearly. Moreover, all the templates are customizable, and easy to edit and downloadable. Use these for both personal and commercial use. This slide covers breakdown of budget allocated for various activities under sustainable marketing program. The purpose of this template is provide an overview of budget allocated to create an effective campaign. It includes budget allocations for content creation, graphic design, staff cost, advertising, etc.
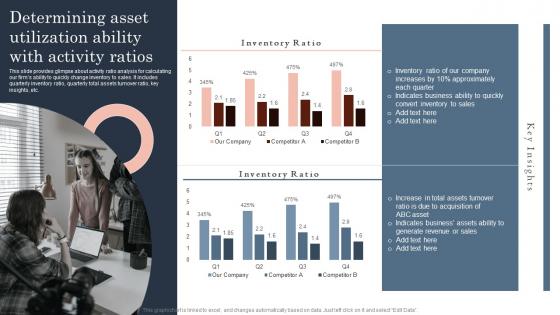
Determining Asset Utilization Ability With Guide To Corporate Financial Growth Plan Mockup Pdf
This slide provides glimpse about activity ratio analysis for calculating our firms ability to quickly change inventory to sales. It includes quarterly inventory ratio, quarterly total assets turnover ratio, key insights, etc.Coming up with a presentation necessitates that the majority of the effort goes into the content and the message you intend to convey. The visuals of a PowerPoint presentation can only be effective if it supplements and supports the story that is being told. Keeping this in mind our experts created Determining Asset Utilization Ability With Guide To Corporate Financial Growth Plan Mockup Pdf to reduce the time that goes into designing the presentation. This way, you can concentrate on the message while our designers take care of providing you with the right template for the situation. This slide provides glimpse about activity ratio analysis for calculating our firms ability to quickly change inventory to sales. It includes quarterly inventory ratio, quarterly total assets turnover ratio, key insights, etc.
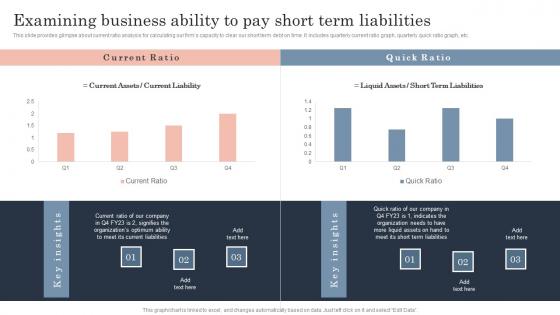
Examining Business Ability To Pay Short Term Guide To Corporate Financial Growth Plan Mockup Pdf
This slide provides glimpse about current ratio analysis for calculating our firms capacity to clear our short term debt on time. It includes quarterly current ratio graph, quarterly quick ratio graph, etc.Welcome to our selection of the Examining Business Ability To Pay Short Term Guide To Corporate Financial Growth Plan Mockup Pdf. These are designed to help you showcase your creativity and bring your sphere to life. Planning and Innovation are essential for any business that is just starting out. This collection contains the designs that you need for your everyday presentations. All of our PowerPoints are 100Precent editable, so you can customize them to suit your needs. This multi-purpose template can be used in various situations. Grab these presentation templates today. This slide provides glimpse about current ratio analysis for calculating our firms capacity to clear our short term debt on time. It includes quarterly current ratio graph, quarterly quick ratio graph, etc.
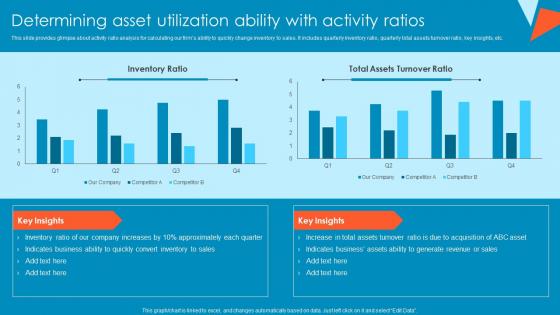
Determining Asset Utilization Ability With Activity Ratios Tactical Financial Governance Formats Pdf
This slide provides glimpse about activity ratio analysis for calculating our firms ability to quickly change inventory to sales. It includes quarterly inventory ratio, quarterly total assets turnover ratio, key insights, etc.Are you searching for a Determining Asset Utilization Ability With Activity Ratios Tactical Financial Governance Formats Pdf that is uncluttered, straightforward, and original Its easy to edit, and you can change the colors to suit your personal or business branding. For a presentation that expresses how much effort you have put in, this template is ideal. With all of its features, including tables, diagrams, statistics, and lists, its perfect for a business plan presentation. Make your ideas more appealing with these professional slides. Download Determining Asset Utilization Ability With Activity Ratios Tactical Financial Governance Formats Pdf from Slidegeeks today. This slide provides glimpse about activity ratio analysis for calculating our firms ability to quickly change inventory to sales. It includes quarterly inventory ratio, quarterly total assets turnover ratio, key insights, etc.
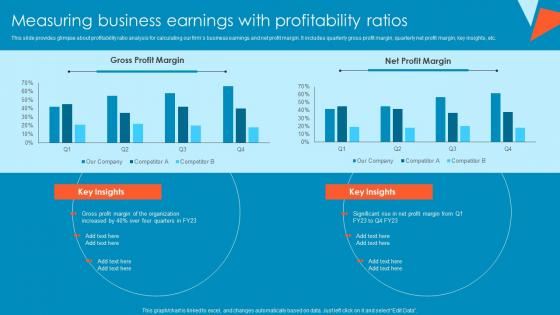
Measuring Business Earnings With Profitability Ratios Tactical Financial Governance Pictures Pdf
This slide provides glimpse about profitability ratio analysis for calculating our firms business earnings and net profit margin. It includes quarterly gross profit margin, quarterly net profit margin, key insights, etc.Create an editable Measuring Business Earnings With Profitability Ratios Tactical Financial Governance Pictures Pdf that communicates your idea and engages your audience. Whether you are presenting a business or an educational presentation, pre-designed presentation templates help save time. Measuring Business Earnings With Profitability Ratios Tactical Financial Governance Pictures Pdf is highly customizable and very easy to edit, covering many different styles from creative to business presentations. Slidegeeks has creative team members who have crafted amazing templates. So, go and get them without any delay. This slide provides glimpse about profitability ratio analysis for calculating our firms business earnings and net profit margin. It includes quarterly gross profit margin, quarterly net profit margin, key insights, etc.


 Continue with Email

 Home
Home


