Result Analysis
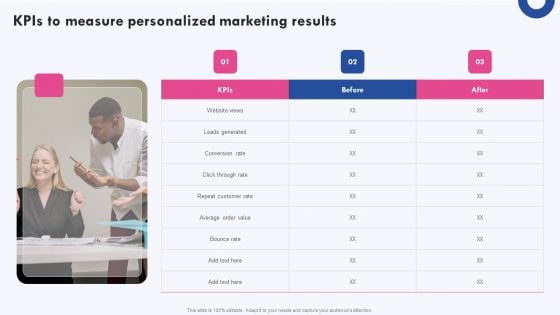
Targeted Marketing Campaigns To Improve Buyers Experience Kpis To Measure Personalized Marketing Results Information PDF
This modern and well arranged Targeted Marketing Campaigns To Improve Buyers Experience Kpis To Measure Personalized Marketing Results Information PDF provides lots of creative possibilities. It is very simple to customize and edit with the Powerpoint Software. Just drag and drop your pictures into the shapes. All facets of this template can be edited with Powerpoint no extra software is necessary. Add your own material, put your images in the places assigned for them, adjust the colors, and then you can show your slides to the world, with an animated slide included.
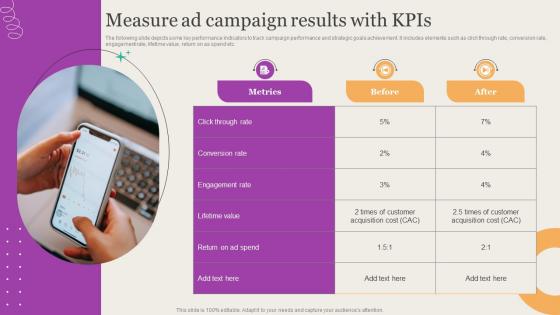
Leveraging Mobile Marketing Strategies Measure Ad Campaign Results With Kpis Topics Pdf
The following slide depicts some key performance indicators to track campaign performance and strategic goals achievement. It includes elements such as click through rate, conversion rate, engagement rate, lifetime value, return on as spend etc. If you are looking for a format to display your unique thoughts, then the professionally designed Leveraging Mobile Marketing Strategies Measure Ad Campaign Results With Kpis Topics Pdf is the one for you. You can use it as a Google Slides template or a PowerPoint template. Incorporate impressive visuals, symbols, images, and other charts. Modify or reorganize the text boxes as you desire. Experiment with shade schemes and font pairings. Alter, share or cooperate with other people on your work. Download Leveraging Mobile Marketing Strategies Measure Ad Campaign Results With Kpis Topics Pdf and find out how to give a successful presentation. Present a perfect display to your team and make your presentation unforgettable. The following slide depicts some key performance indicators to track campaign performance and strategic goals achievement. It includes elements such as click through rate, conversion rate, engagement rate, lifetime value, return on as spend etc.

Conventional Media Channels Customer Survey Results Of Referral Marketing Campaign Background PDF
This slide provides an overview of a survey conducted for referral marketing campaigns. It showcases the percentage of people influenced by various sources. Do you know about Slidesgeeks Conventional Media Channels Customer Survey Results Of Referral Marketing Campaign Background PDF These are perfect for delivering any kind od presentation. Using it, create PowerPoint presentations that communicate your ideas and engage audiences. Save time and effort by using our pre designed presentation templates that are perfect for a wide range of topic. Our vast selection of designs covers a range of styles, from creative to business, and are all highly customizable and easy to edit. Download as a PowerPoint template or use them as Google Slides themes.
Enterprise Performance Survey Results Ppt PowerPoint Presentation Complete Deck With Slides
If designing a presentation takes a lot of your time and resources and you are looking for a better alternative, then this Enterprise Performance Survey Results Ppt PowerPoint Presentation Complete Deck With Slides is the right fit for you. This is a prefabricated set that can help you deliver a great presentation on the topic. All the twelve slides included in this sample template can be used to present a birds-eye view of the topic. These slides are also fully editable, giving you enough freedom to add specific details to make this layout more suited to your business setting. Apart from the content, all other elements like color, design, theme are also replaceable and editable. This helps in designing a variety of presentations with a single layout. Not only this, you can use this PPT design in formats like PDF, PNG, and JPG once downloaded. Therefore, without any further ado, download and utilize this sample presentation as per your liking.
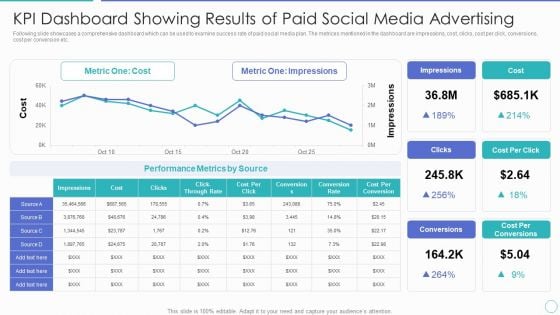
KPI Dashboard Showing Results Of Paid Social Media Advertising Ppt PowerPoint Presentation File Summary PDF
Following slide showcases a comprehensive dashboard which can be used to examine success rate of paid social media plan. The metrices mentioned in the dashboard are impressions, cost, clicks, cost per click, conversions, cost per conversion etc. Showcasing this set of slides titled kpi dashboard showing results of paid social media advertising ppt powerpoint presentation file summary pdf. The topics addressed in these templates are metric one cost, metric one impressions, performance metrics by source. All the content presented in this PPT design is completely editable. Download it and make adjustments in color, background, font etc. as per your unique business setting.
Tracking Social Media Content Reach For Better Campaign Results Inspiration PDF
This slide covers an overview of social media content reach to identify the number of people who see your content, either ads or posts. It also includes improvement strategies such as producing high-quality content, increasing the number of images, etc. If your project calls for a presentation, then Slidegeeks is your go to partner because we have professionally designed, easy to edit templates that are perfect for any presentation. After downloading, you can easily edit Tracking Social Media Content Reach For Better Campaign Results Inspiration PDF and make the changes accordingly. You can rearrange slides or fill them with different images. Check out all the handy templates.
Sample Asset Valuation Report Historical Operating Results Brand Value Estimation Guide Icons PDF
This slide illustrates information about ABC corporations valuation using greenfield approach. Fair value of license is calculated by subtracting tax amortization benefit from total value.Want to ace your presentation in front of a live audience Our Sample Asset Valuation Report Historical Operating Results Brand Value Estimation Guide Icons PDF can help you do that by engaging all the users towards you.. Slidegeeks experts have put their efforts and expertise into creating these impeccable powerpoint presentations so that you can communicate your ideas clearly. Moreover, all the templates are customizable, and easy-to-edit and downloadable. Use these for both personal and commercial use.

Application Patient Satisfaction Tactics Enhance Clinical Results Strategies To Implement Virtual Clipart PDF
This slide shows the strategies that can be used by the medical facility institution in order to implement virtual health technologies such as telehealth services, health applications, social media applications etc. This is a application patient satisfaction tactics enhance clinical results strategies to implement virtual clipart pdf template with various stages. Focus and dispense information on five stages using this creative set, that comes with editable features. It contains large content boxes to add your information on topics like telehealth services, health applications, social media applications, wearable technology. You can also showcase facts, figures, and other relevant content using this PPT layout. Grab it now.
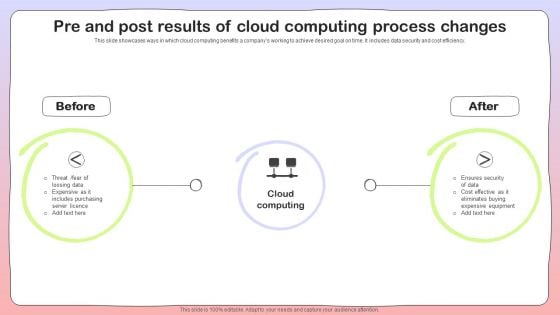
Pre And Post Results Of Cloud Computing Process Changes Graphics PDF
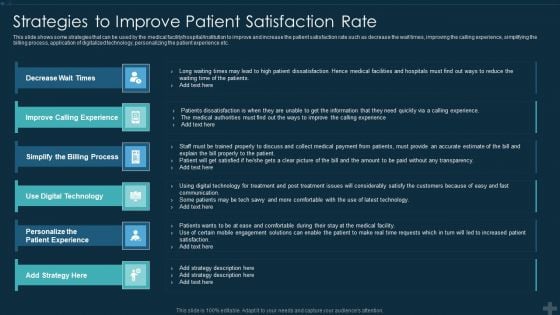
Application Patient Satisfaction Tactics Enhance Clinical Results Strategies To Improve Patient Brochure PDF
This slide shows the strategies that can be used by the medical facility institution in order to improve the patient retention rate such as building strong relationships via multi channel engagement, implementing virtual health technologies, personalizing patient interactions, maintaining high service standards etc. Deliver an awe inspiring pitch with this creative application patient satisfaction tactics enhance clinical results strategies to improve patient brochure pdf bundle. Topics like strategies to improve patient retention rate can be discussed with this completely editable template. It is available for immediate download depending on the needs and requirements of the user.
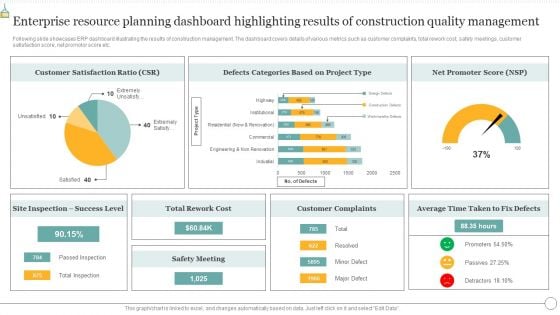
Enterprise Resource Planning Dashboard Highlighting Results Of Construction Quality Management Summary PDF
Following slide exhibits various functionalities that constructing company look for in ERP software. The multiple functionalities covered in the slide are project tracking, job costing, project estimating, improved accuracy, process automation etc. Pitch your topic with ease and precision using this Enterprise Resource Planning Dashboard Highlighting Results Of Construction Quality Management Summary PDF. This layout presents information on Technology Efficiency, Process Automation, Improved Accuracy. It is also available for immediate download and adjustment. So, changes can be made in the color, design, graphics or any other component to create a unique layout.
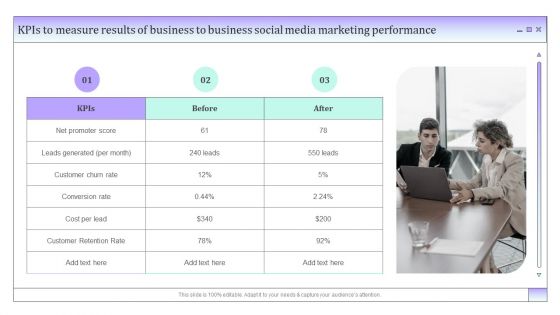
Kpis To Measure Results Of Business To Business Social Media Marketing Performance Clipart PDF
The Kpis To Measure Results Of Business To Business Social Media Marketing Performance Clipart PDF is a compilation of the most recent design trends as a series of slides. It is suitable for any subject or industry presentation, containing attractive visuals and photo spots for businesses to clearly express their messages. This template contains a variety of slides for the user to input data, such as structures to contrast two elements, bullet points, and slides for written information. Slidegeeks is prepared to create an impression.
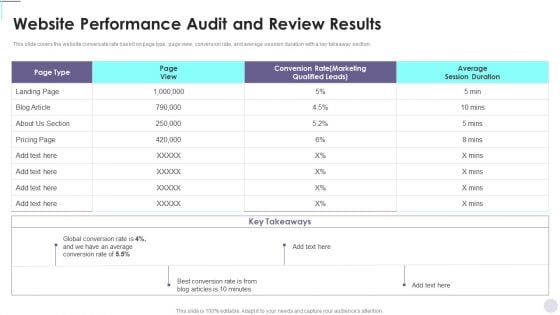
Website Performance Audit And Review Results Consumer Contact Point Guide Designs PDF
This slide covers the website conversate rate based on page type, page view, conversion rate, and average session duration with a key takeaway section. The Website Performance Audit And Review Results Consumer Contact Point Guide Designs PDF is a compilation of the most recent design trends as a series of slides. It is suitable for any subject or industry presentation, containing attractive visuals and photo spots for businesses to clearly express their messages. This template contains a variety of slides for the user to input data, such as structures to contrast two elements, bullet points, and slides for written information. Slidegeeks is prepared to create an impression.
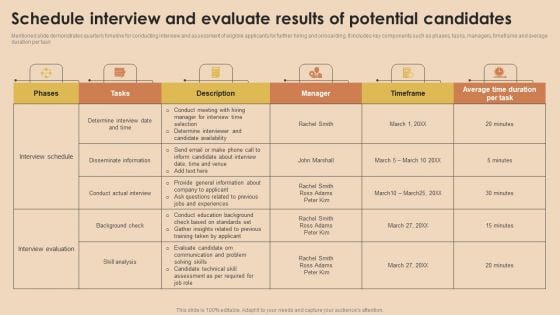
Detailed Guide For Talent Acquisition Schedule Interview And Evaluate Results Download PDF
Mentioned slide demonstrates quarterly timeline for conducting interview and assessment of eligible applicants for further hiring and onboarding. It includes key components such as phases, tasks, managers, timeframe and average duration per task. Slidegeeks is here to make your presentations a breeze with Detailed Guide For Talent Acquisition Schedule Interview And Evaluate Results Download PDF With our easy to use and customizable templates, you can focus on delivering your ideas rather than worrying about formatting. With a variety of designs to choose from, you are sure to find one that suits your needs. And with animations and unique photos, illustrations, and fonts, you can make your presentation pop. So whether you are giving a sales pitch or presenting to the board, make sure to check out Slidegeeks first.
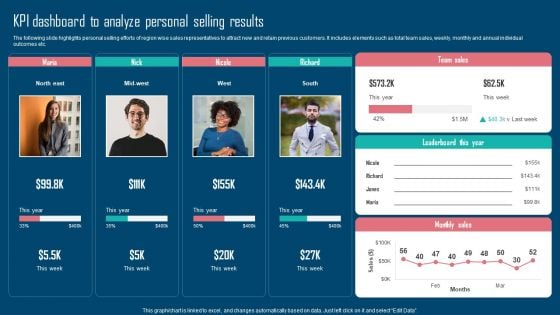
Adopting IMC Technique To Boost Brand Recognition Kpi Dashboard To Analyze Personal Selling Results Formats PDF
The following slide highlights personal selling efforts of region wise sales representatives to attract new and retain previous customers. It includes elements such as total team sales, weekly, monthly and annual individual outcomes etc. Coming up with a presentation necessitates that the majority of the effort goes into the content and the message you intend to convey. The visuals of a PowerPoint presentation can only be effective if it supplements and supports the story that is being told. Keeping this in mind our experts created Adopting IMC Technique To Boost Brand Recognition Kpi Dashboard To Analyze Personal Selling Results Formats PDF to reduce the time that goes into designing the presentation. This way, you can concentrate on the message while our designers take care of providing you with the right template for the situation.
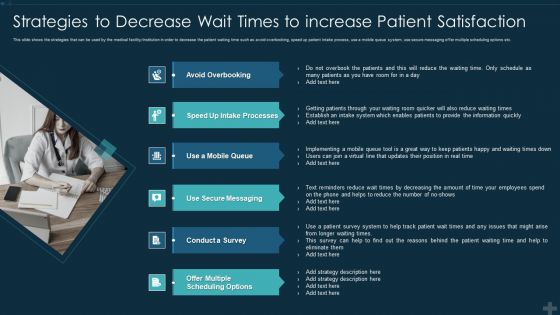
Application Patient Satisfaction Tactics Enhance Clinical Results Strategies To Decrease Wait Brochure PDF
This slide shows the strategies that can be used by the medical facility institution in order to decrease the patient waiting time such as avoid overbooking, speed up patient intake process, use a mobile queue system, use secure messaging offer multiple scheduling options etc. Presenting application patient satisfaction tactics enhance clinical results strategies to decrease wait brochure pdf to provide visual cues and insights. Share and navigate important information on six stages that need your due attention. This template can be used to pitch topics like avoid overbooking, use secure messaging, conduct a survey, scheduling options. In addtion, this PPT design contains high resolution images, graphics, etc, that are easily editable and available for immediate download.
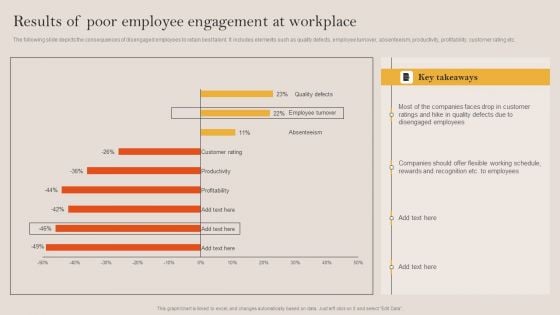
Tactical Employee Engagement Action Planning Results Of Poor Employee Engagement At Workplace Slides PDF
The following slide depicts the consequences of disengaged employees to retain best talent. It includes elements such as quality defects, employee turnover, absenteeism, productivity, profitability, customer rating etc. Slidegeeks is here to make your presentations a breeze with Tactical Employee Engagement Action Planning Results Of Poor Employee Engagement At Workplace Slides PDF With our easy to use and customizable templates, you can focus on delivering your ideas rather than worrying about formatting. With a variety of designs to choose from, you are sure to find one that suits your needs. And with animations and unique photos, illustrations, and fonts, you can make your presentation pop. So whether you are giving a sales pitch or presenting to the board, make sure to check out Slidegeeks first

Application Patient Satisfaction Tactics Enhance Clinical Results Strategies To Improve Patient Retention Rate Introduction PDF
This slide shows some strategies that can be used by the medical facility hospital institution to improve and increase the patient satisfaction rate such as decrease the wait times, improving the calling experience, simplifying the billing process, application of digitalized technology, personalizing the patient experience etc. Presenting application patient satisfaction tactics enhance clinical results strategies to improve patient retention rate introduction pdf to provide visual cues and insights. Share and navigate important information on six stages that need your due attention. This template can be used to pitch topics like decrease wait times, improve calling experience, simplify the billing process, digital technology. In addtion, this PPT design contains high resolution images, graphics, etc, that are easily editable and available for immediate download.
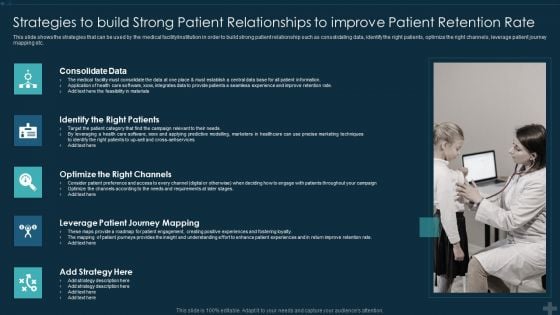
Application Patient Satisfaction Tactics Enhance Clinical Results Strategies To Build Strong Patient Microsoft PDF
This slide shows the strategies that can be used by the medical facility institution in order to build strong patient relationship such as consolidating data, identify the right patients, optimize the right channels, leverage patient journey mapping etc. This is a application patient satisfaction tactics enhance clinical results strategies to build strong patient microsoft pdf template with various stages. Focus and dispense information on six stages using this creative set, that comes with editable features. It contains large content boxes to add your information on topics like consolidate data, identify the right patients, optimize the right channels, strategy. You can also showcase facts, figures, and other relevant content using this PPT layout. Grab it now.
Dashboard For Tracking Brand Communication Campaign Results Executing Brand Communication Strategy Clipart PDF
This slide covers the dashboard for monitoring various audience segments. It includes metrics such as ad mentions, engagement, top occupation of the audience, top interest of the audience, age, language, etc. The Dashboard For Tracking Brand Communication Campaign Results Executing Brand Communication Strategy Clipart PDF is a compilation of the most recent design trends as a series of slides. It is suitable for any subject or industry presentation, containing attractive visuals and photo spots for businesses to clearly express their messages. This template contains a variety of slides for the user to input data, such as structures to contrast two elements, bullet points, and slides for written information. Slidegeeks is prepared to create an impression.
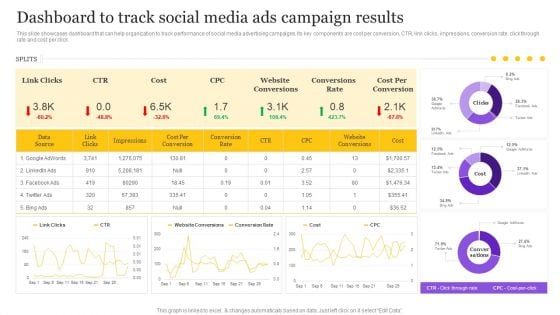
Digital Marketing Strategy Dashboard To Track Social Media Ads Campaign Results Introduction PDF
This slide showcases dashboard that can help organization to track performance of social media advertising campaigns. Its key components are cost per conversion, CTR, link clicks, impressions, conversion rate, click through rate and cost per click. The Digital Marketing Strategy Dashboard To Track Social Media Ads Campaign Results Introduction PDF is a compilation of the most recent design trends as a series of slides. It is suitable for any subject or industry presentation, containing attractive visuals and photo spots for businesses to clearly express their messages. This template contains a variety of slides for the user to input data, such as structures to contrast two elements, bullet points, and slides for written information. Slidegeeks is prepared to create an impression.

Objectives And Key Results Strategy And Corporate Ppt PowerPoint Presentation Complete Deck With Slides
Share a great deal of information on the topic by deploying this objectives and key results strategy and corporate ppt powerpoint presentation complete deck with slides. Support your ideas and thought process with this prefabricated set. It includes a set of twelve slides, all fully modifiable and editable. Each slide can be restructured and induced with the information and content of your choice. You can add or remove large content boxes as well, to make this PPT slideshow more personalized. Its high-quality graphics and visuals help in presenting a well-coordinated pitch. This PPT template is also a resourceful tool to take visual cues from and implement the best ideas to help your business grow and expand. The main attraction of this well-formulated deck is that everything is editable, giving you the freedom to adjust it to your liking and choice. Changes can be made in the background and theme as well to deliver an outstanding pitch. Therefore, click on the download button now to gain full access to this multifunctional set.
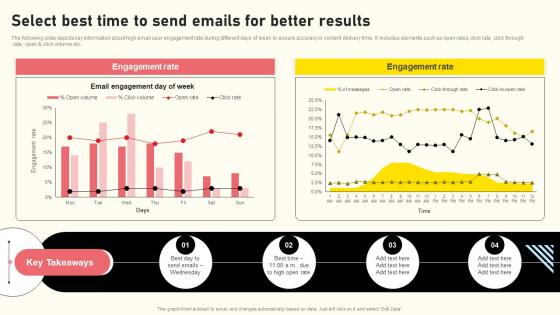
Effective Real Time Marketing Principles Select Best Time To Send Emails For Better Results Structure Pdf
The following slide depicts key information about high email user engagement rate during different days of week to ensure accuracy in content delivery time. It includes elements such as open rates, click rate, click through rate, open and click volume etc. Slidegeeks is here to make your presentations a breeze with Effective Real Time Marketing Principles Select Best Time To Send Emails For Better Results Structure Pdf With our easy-to-use and customizable templates, you can focus on delivering your ideas rather than worrying about formatting. With a variety of designs to choose from, you are sure to find one that suits your needs. And with animations and unique photos, illustrations, and fonts, you can make your presentation pop. So whether you are giving a sales pitch or presenting to the board, make sure to check out Slidegeeks first The following slide depicts key information about high email user engagement rate during different days of week to ensure accuracy in content delivery time. It includes elements such as open rates, click rate, click through rate, open and click volume etc.

Application Of Patient Satisfaction Tactics To Enhance Clinical Results Ppt PowerPoint Presentation Complete Deck With Slides
This complete deck acts as a great communication tool. It helps you in conveying your business message with personalized sets of graphics, icons etc. Comprising a set of fourty slides, this complete deck can help you persuade your audience. It also induces strategic thinking as it has been thoroughly researched and put together by our experts. Not only is it easily downloadable but also editable. The color, graphics, theme any component can be altered to fit your individual needs. So grab it now.

Advance IT Service Delivery Methods To Drive Key Performance Indicators Related Business Results Complete Deck
This complete deck acts as a great communication tool. It helps you in conveying your business message with personalized sets of graphics, icons etc. Comprising a set of fifty six slides, this complete deck can help you persuade your audience. It also induces strategic thinking as it has been thoroughly researched and put together by our experts. Not only is it easily downloadable but also editable. The color, graphics, theme any component can be altered to fit your individual needs. So grab it now.
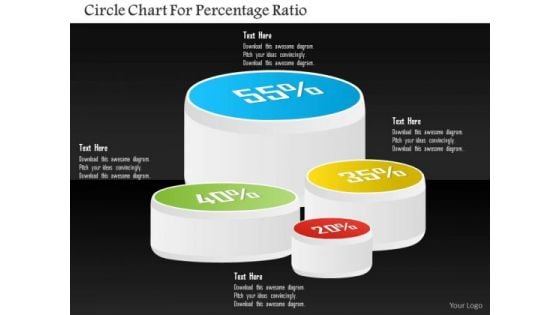
Business Diagram Circle Chart For Percentage Ratio Presentation Template
Four staged circular chart has been used to craft this PPT diagram. This PPT contains the concept of result analysis. Use this PPT in your business and sales presentation and display any kind of result analysis in a graphical way.
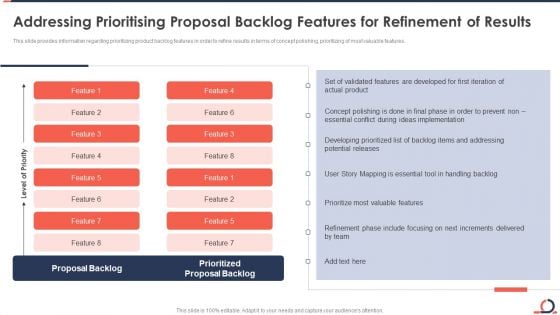
Addressing Prioritising Proposal Backlog Features For Refinement Of Results Developing Fixed Bid Projects Using Agile IT Designs PDF
This slide provides information regarding prioritizing product backlog features in order to refine results in terms of concept polishing, prioritizing of most valuable features. Deliver an awe inspiring pitch with this creative addressing prioritising proposal backlog features for refinement of results developing fixed bid projects using agile it designs pdf bundle. Topics like implementation, developed, valuable can be discussed with this completely editable template. It is available for immediate download depending on the needs and requirements of the user.
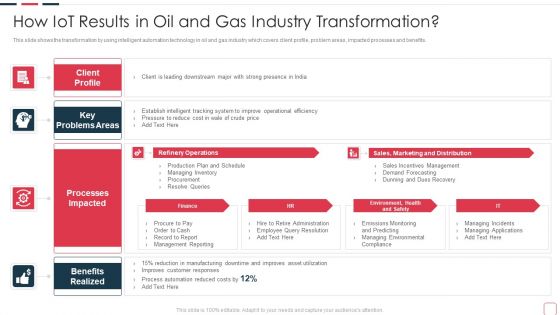
Price Benefit Internet Things Digital Twins Execution After Covid How Iot Results In Oil And Gas Information PDF
This slide shows the transformation by using intelligent automation technology in oil and gas industry which covers client profile, problem areas, impacted processes and benefits. Deliver and pitch your topic in the best possible manner with this price benefit internet things digital twins execution after covid how iot results in oil and gas information pdf . Use them to share invaluable insights on how iot results in oil and gas industry transformation and impress your audience. This template can be altered and modified as per your expectations. So, grab it now.
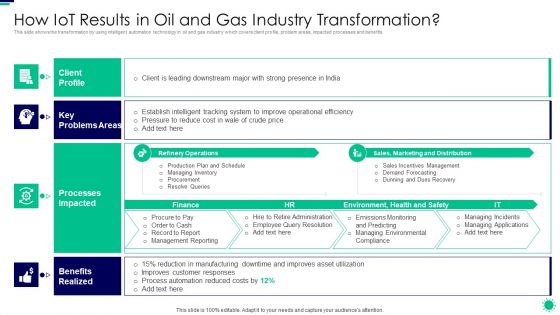
Purpose Digital Twin Internet Things Reducing Costs After COVID Era How Iot Results In Oil And Gas Designs PDF
This slide shows the transformation by using intelligent automation technology in oil and gas industry which covers client profile, problem areas, impacted processes and benefits. Deliver an awe inspiring pitch with this creative purpose digital twin internet things reducing costs after covid era how iot results in oil and gas designs pdf bundle. Topics like client profile, problems areas, processes impacted, benefits realized can be discussed with this completely editable template. It is available for immediate download depending on the needs and requirements of the user.
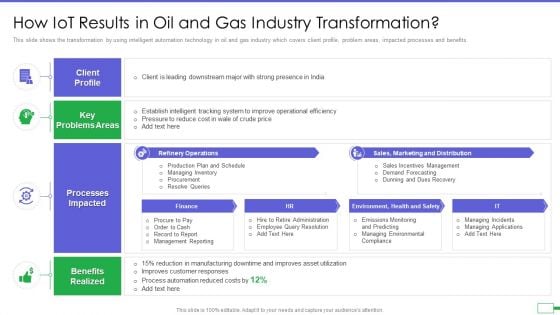
Iot And Digital Twin To Reduce Costs Post Covid How Iot Results In Oil And Gas Industry Demonstration PDF
This slide shows the transformation by using intelligent automation technology in oil and gas industry which covers client profile, problem areas, impacted processes and benefits. Presenting iot and digital twin to reduce costs post covid how iot results in oil and gas industry demonstration pdf to provide visual cues and insights. Share and navigate important information on four stages that need your due attention. This template can be used to pitch topics like client profile, key problems areas, processes impacted, benefits realized. In addtion, this PPT design contains high resolution images, graphics, etc, that are easily editable and available for immediate download.
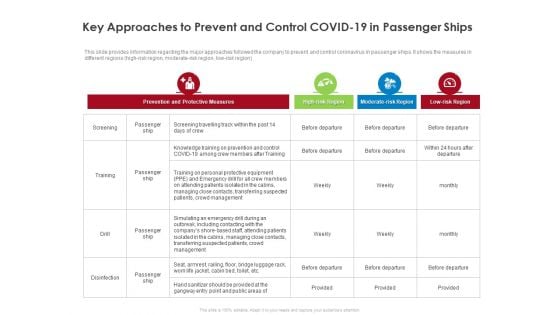
COVID 19 Risk Analysis Mitigation Policies Ocean Liner Sector Key Approaches To Prevent And Control COVID 19 In Passenger Ships Demonstration PDF
This slide provides information regarding the major approaches followed the company to prevent and control coronavirus in passenger ships. It shows the measures in different regions high risk region, moderate risk region, low risk region. Deliver an awe inspiring pitch with this creative covid 19 risk analysis mitigation policies ocean liner sector key approaches to prevent and control covid 19 in passenger ships demonstration pdf bundle. Topics like management, high risk region, moderate risk region, low risk region can be discussed with this completely editable template. It is available for immediate download depending on the needs and requirements of the user.
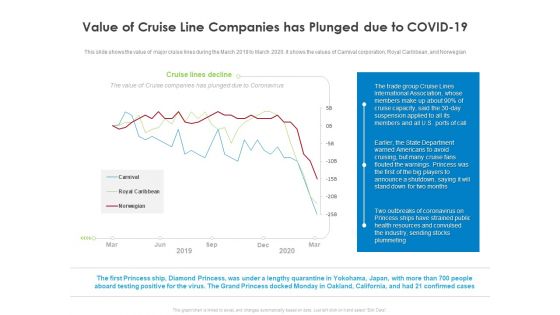
COVID 19 Risk Analysis Mitigation Policies Ocean Liner Sector Value Of Cruise Line Companies Has Plunged Due To COVID 19 Themes PDF
This slide shows the value of major cruise lines during the March 2019 to March 2020. it shows the values of Carnival corporation, Royal Caribbean, and Norwegian. Deliver an awe inspiring pitch with this creative covid 19 risk analysis mitigation policies ocean liner sector value of cruise line companies has plunged due to covid 19 themes pdf bundle. Topics like value of cruise line companies has plunged due to covid 19 can be discussed with this completely editable template. It is available for immediate download depending on the needs and requirements of the user.

Issues And Impact Of Failure Mode And Effects Analysis Process Review To Identify The Possible Failures In A Design Sample PDF
This slide provides the table of process review to identify the possible failures in a design. The table covers the headings such as process, potential failure, effects of potential failure, cause of potential failure, current measures, recommended measures and post improvement activities. Deliver an awe inspiring pitch with this creative Issues And Impact Of Failure Mode And Effects Analysis Process Review To Identify The Possible Failures In A Design Sample PDF bundle. Topics like Potential Failure, Current Measures, Recommended Measures can be discussed with this completely editable template. It is available for immediate download depending on the needs and requirements of the user.
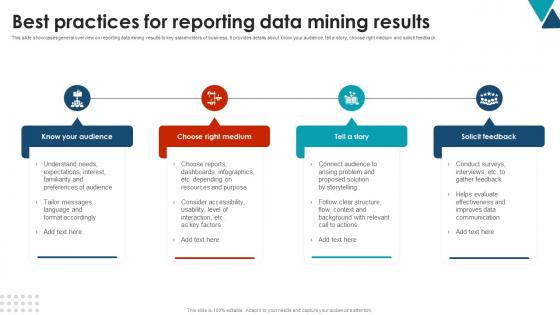
Best Practices For Reporting Data Mining Results Using Data Mining Tools To Optimize Processes AI SS V
This slide showcases general overview on reporting data mining results to key stakeholders of business. It provides details about know your audience, tell a story, choose right medium and solicit feedback. From laying roadmaps to briefing everything in detail, our templates are perfect for you. You can set the stage with your presentation slides. All you have to do is download these easy-to-edit and customizable templates. Best Practices For Reporting Data Mining Results Using Data Mining Tools To Optimize Processes AI SS V will help you deliver an outstanding performance that everyone would remember and praise you for. Do download this presentation today. This slide showcases general overview on reporting data mining results to key stakeholders of business. It provides details about know your audience, tell a story, choose right medium and solicit feedback.
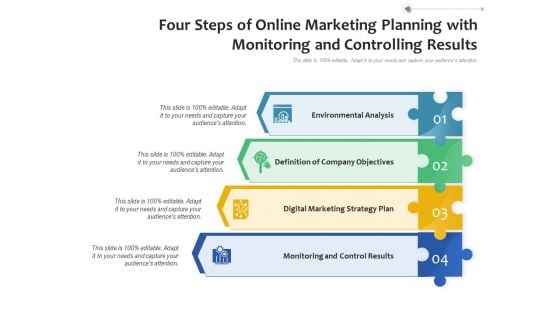
Four Steps Of Online Marketing Planning With Monitoring And Controlling Results Ppt PowerPoint Presentation Gallery Example PDF
Presenting four steps of online marketing planning with monitoring and controlling results ppt powerpoint presentation gallery example pdf. to dispense important information. This template comprises four stages. It also presents valuable insights into the topics including environmental analysis, definition of company objectives, digital marketing strategy plan, monitoring and control results. This is a completely customizable PowerPoint theme that can be put to use immediately. So, download it and address the topic impactfully.
Effective Guide To Build Strong Online Hiring Strategy Survey Results Depicting Causes Of Company Poor Icons PDF
Following slide represents survey results that helps to find major reasons of company poor performance. It include pointers such as poor hiring technology, obsolete sourcing process, poor application branding and onboarding process etc. Whether you have daily or monthly meetings, a brilliant presentation is necessary. Effective Guide To Build Strong Online Hiring Strategy Survey Results Depicting Causes Of Company Poor Icons PDF can be your best option for delivering a presentation. Represent everything in detail using Effective Guide To Build Strong Online Hiring Strategy Survey Results Depicting Causes Of Company Poor Icons PDF and make yourself stand out in meetings. The template is versatile and follows a structure that will cater to your requirements. All the templates prepared by Slidegeeks are easy to download and edit. Our research experts have taken care of the corporate themes as well. So, give it a try and see the results.
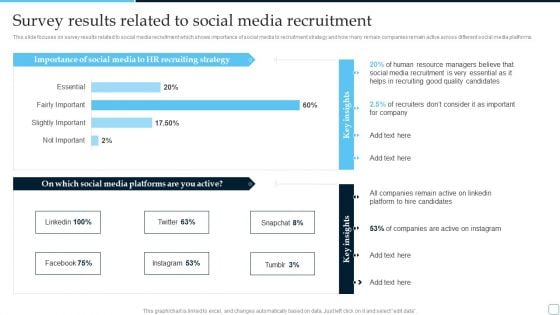
Survey Results Related To Social Media Recruitment Tactical Plan To Enhance Social Media Hiring Process Demonstration PDF
This slide focuses on survey results related to social media recruitment which shows importance of social media to recruitment strategy and how many remain companies remain active across different social media platforms.If you are looking for a format to display your unique thoughts, then the professionally designed Survey Results Related To Social Media Recruitment Tactical Plan To Enhance Social Media Hiring Process Demonstration PDF is the one for you. You can use it as a Google Slides template or a PowerPoint template. Incorporate impressive visuals, symbols, images, and other charts. Modify or reorganize the text boxes as you desire. Experiment with shade schemes and font pairings. Alter, share or cooperate with other people on your work. Download Survey Results Related To Social Media Recruitment Tactical Plan To Enhance Social Media Hiring Process Demonstration PDF and find out how to give a successful presentation. Present a perfect display to your team and make your presentation unforgettable.
Craft The Perfect Event Proposal Event Marketing Recap Proposal Results And Flashback Of Last Event Professional PDF
This is a craft the perfect event proposal event marketing recap proposal results and flashback of last event professional pdf template with various stages. Focus and dispense information on seven stages using this creative set, that comes with editable features. It contains large content boxes to add your information on topics like event marketing recap proposal results and flashback of last event. You can also showcase facts, figures, and other relevant content using this PPT layout. Grab it now.
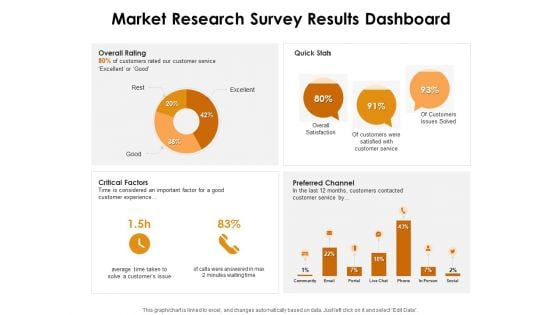
KPI Dashboards Per Industry Market Research Survey Results Dashboard Ppt PowerPoint Presentation Infographic Template Layout Ideas PDF
Deliver and pitch your topic in the best possible manner with this kpi dashboards per industry market research survey results dashboard ppt powerpoint presentation infographic template layout ideas pdf. Use them to share invaluable insights on overall rating, quick stats, critical factors, preferred channel and impress your audience. This template can be altered and modified as per your expectations. So, grab it now.
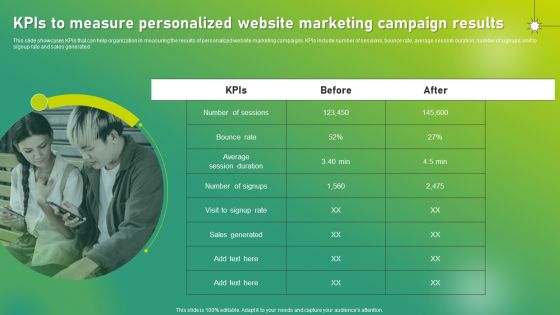
Targeted Marketing Strategic Plan For Audience Engagement Kpis To Measure Personalized Website Marketing Campaign Results Formats PDF
This slide showcases KPIs that can help organization in measuring the results of personalized website marketing campaigns. KPIs include number of sessions, bounce rate, average session duration, number of signups, visit to signup rate and sales generated. Are you in need of a template that can accommodate all of your creative concepts This one is crafted professionally and can be altered to fit any style. Use it with Google Slides or PowerPoint. Include striking photographs, symbols, depictions, and other visuals. Fill, move around, or remove text boxes as desired. Test out color palettes and font mixtures. Edit and save your work, or work with colleagues. Download Targeted Marketing Strategic Plan For Audience Engagement Kpis To Measure Personalized Website Marketing Campaign Results Formats PDF and observe how to make your presentation outstanding. Give an impeccable presentation to your group and make your presentation unforgettable.

SEO Audit Summary To Increase Organic Search Results And Website Visitors Ppt PowerPoint Presentation Complete Deck With Slides
This complete deck acts as a great communication tool. It helps you in conveying your business message with personalized sets of graphics, icons etc. Comprising a set of fourty nine slides, this complete deck can help you persuade your audience. It also induces strategic thinking as it has been thoroughly researched and put together by our experts. Not only is it easily downloadable but also editable. The color, graphics, theme any component can be altered to fit your individual needs. So grab it now.
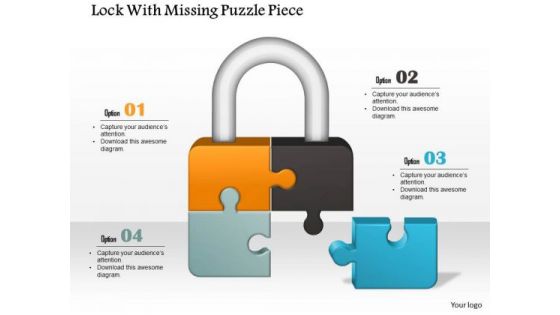
Business Diagram Lock With Missing Puzzle Piece Presentation Template
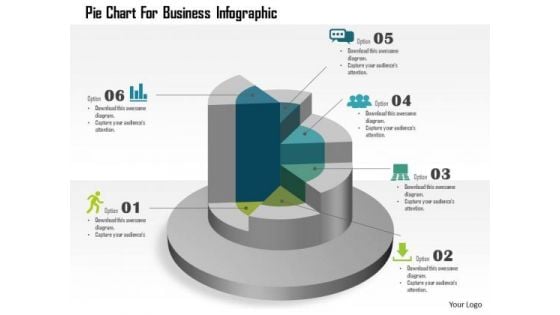
Business Diagram Pie Chart For Business Infographic Presentation Template
This template displays pie chart business infographic. You may download this business slide for result analysis. Amplify your thoughts via this appropriate business template.

Sales Channel Management Example Ppt Design Templates
This is a sales channel management example ppt design templates. This is a five stage process. The stages in this process are selection, motivation, training, evaluation, results analysis.
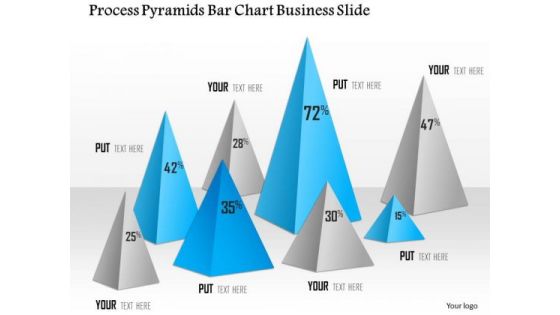
Business Diagram Process Pyramids Bar Chart Business Slide Presentation Template
Graphic of pyramid and bar chart has been used to design this power point template diagram. This PPT diagram contains the concept of business result analysis and process flow. Use this template slide and display result in your presentations.
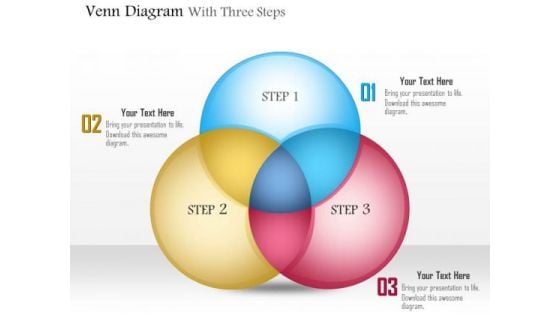
Business Diagram Venn Diagram With Three Steps Presentation Template
This slide displays Venn diagram with three steps presentation template. This power point template has been designed with graphic of Venn diagram. Use this Venn diagram for business result analysis. Build business presentations with analysis practices with this Venn diagram.
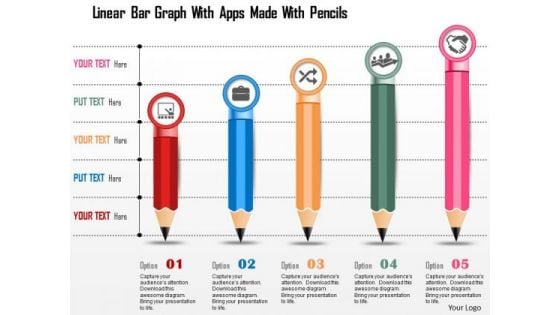
Business Diagram Linear Bar Graph With Apps Made With Pencils Presentation Template
This power point template has been crafted with graphic of linear bar graph and apps made with pencils. This PPT diagram can be used for business growth analysis and result analysis. Use this PPT for business and marketing related presentations.
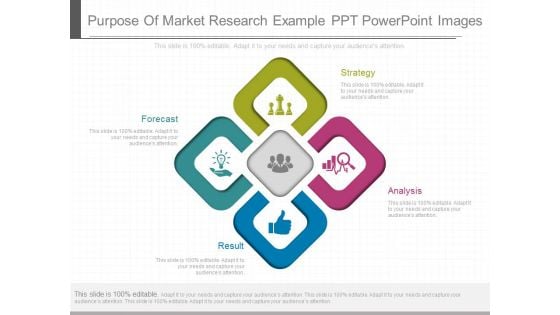
Purpose Of Market Research Example Ppt Powerpoint Images
This is a purpose of market research example ppt powerpoint images. This is a four stage process. The stages in this process are forecast, result, analysis, strategy.
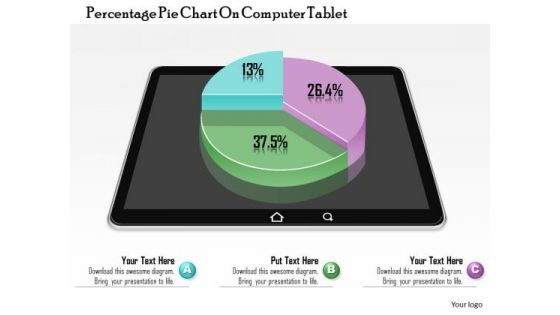
Business Diagram Percentage Pie Chart On Computer Tablet Presentation Slide Template
This business diagram power point template has been designed with graphic of pie chart. This pie chart contains the various percentage values for business result analysis. Use this pie chart for your business result display related presentations.
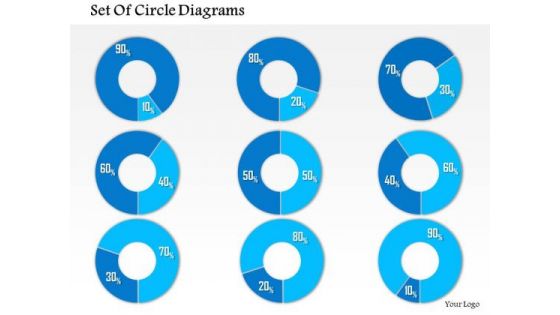
Business Framework 10 Percent To 90 Percent PowerPoint Presentation
This business diagram has been designed with graphic of multiple pie graphs. This diagram slide contains the concept of result analysis with percentage values. Use this diagram to present and compare data in an impressive manner
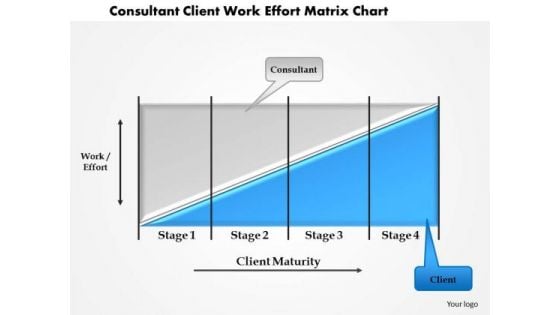
Business Framework Consultant Client Work Effort Matrix Chart PowerPoint Presentation
This business power point template slide has been crafted with graphic of bar graph. This bar graph is called as coase theorem. Use this professional diagram for your result analysis related presentation.
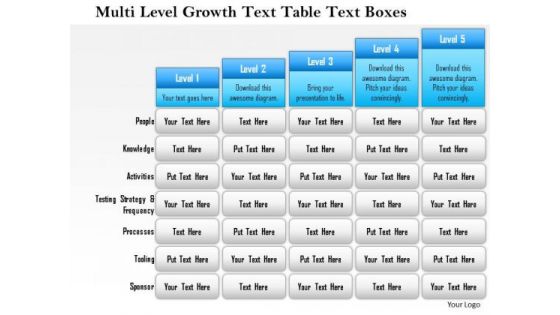
Business Framework Multi Level Growth Text Table Text Boxes 2 PowerPoint Presentation
Five staged text box style chart in bar graph design has been used to decorate this power point template slide. This diagram slide contains the multilevel growth concept. Use this PPT slide for financial growth and result analysis related topics.
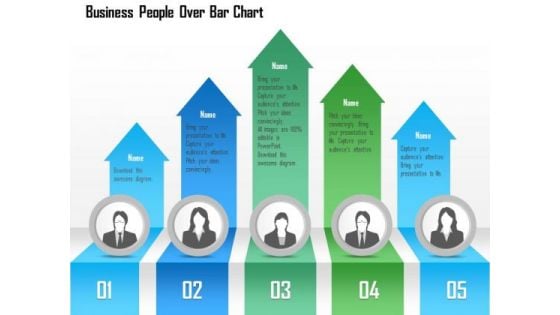
Business Diagram Business People Over Bar Chart PowerPoint Template
This Power Point template has been designed with graphic of business people and bar chart. This PPT contains the concept of result analysis and business data display. Use this PPT slide for your business and marketing related presentations.
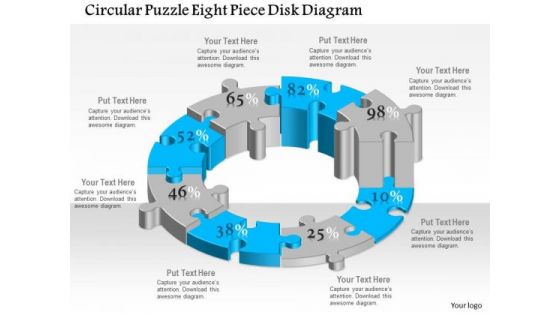
Business Diagram Circular Puzzle Eight Piece Disk Diagram Presentation Template
This business plan power point template has been designed with six staged circular puzzle diagram. This diagram template contains the concept of business process flow and result analysis representation. Use this diagram in your presentation and show these concepts.
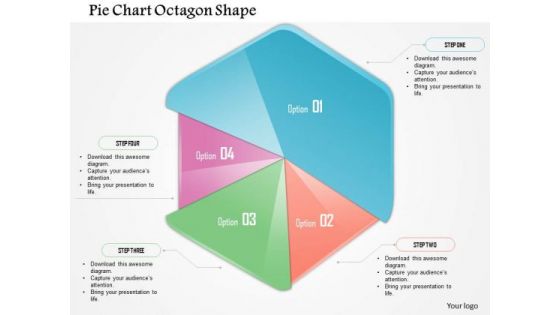
Business Diagram Pie Chart Octagon Shape Presentation Template
This business plan power point template has been designed with pie chart in octagon shape. This PPT contains the concept of result analysis for any business process. Use this PPT for business and sales related presentations.
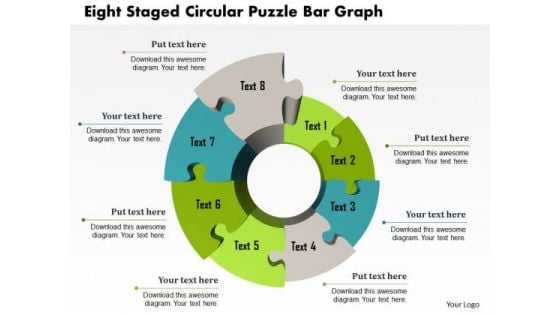
Business Diagram Eight Staged Circular Puzzle Bar Graph Presentation Template
This Power Point template has been crafted with graphic of eight staged circular puzzle and bar graph. This PPT contains the financial result analysis related concept. Use this PPT for your business and success related presentations.
3d Man On The Top Of Puzzle Bar Graph
This PPT has been designed with graphic of 3d man and puzzle are graph. This PPT displays the concept of result analysis and financial growth. Use this PPT for your business and finance related presentations.
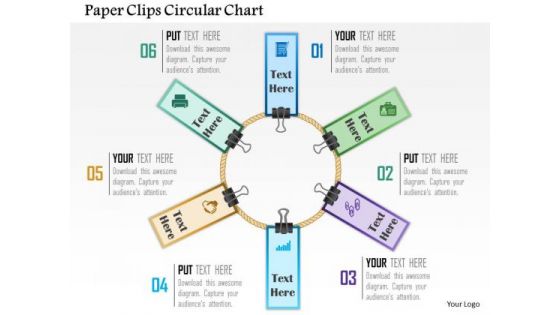
Business Diagram Paper Clips Circular Chart Presentation Template
This power point template has been designed with graphic of circular chart made with paper clips. These business icons are used to display the concept of business result analysis and meeting. Use this diagram for business and marketing presentations.
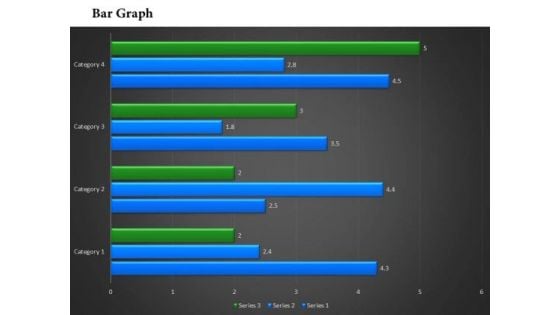
Business Framework Bar Chart In PowerPoint Presentation
This power point diagram slide has been designed with graphic of bar chart. In this diagram slide we have used green and blue colored vertical bar graph. Display result analysis with this bar graph diagram and use it in your result verification and analysis related presentations.
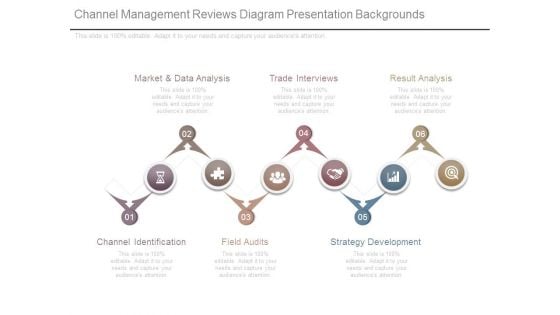
Channel Management Reviews Diagram Presentation Backgrounds
This is a channel management reviews diagram presentation backgrounds. This is a six stage process. The stages in this process are channel identification, market and data analysis, trade interviews, result analysis, strategy development, field audits.


 Continue with Email

 Home
Home


