Revenue Chart
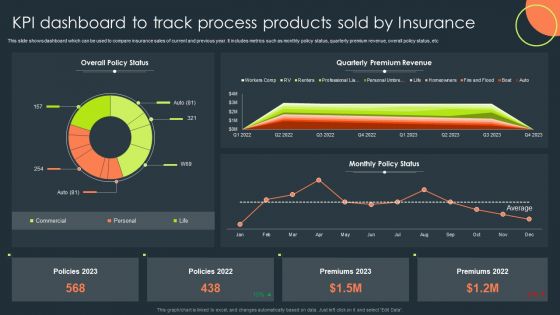
KPI Dashboard To Track Process Products Sold By Insurance Topics PDF
This slide shows dashboard which can be used to compare insurance sales of current and previous year. It includes metrics such as monthly policy status, quarterly premium revenue, overall policy status, etc. Pitch your topic with ease and precision using this KPI Dashboard To Track Process Products Sold By Insurance Topics PDF. This layout presents information on Overall Policy Status, Quarterly Premium Revenue, Monthly Policy Status. It is also available for immediate download and adjustment. So, changes can be made in the color, design, graphics or any other component to create a unique layout.
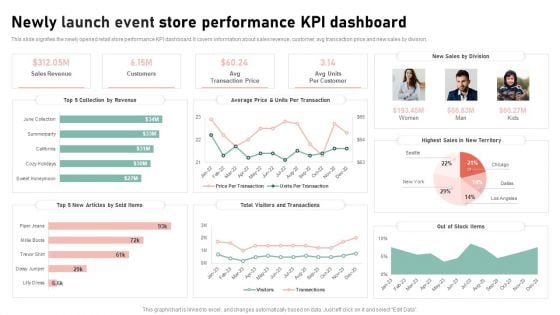
Newly Launch Event Store Performance Kpi Dashboard Elements Sample PDF
This slide signifies the newly opened retail store performance KPI dashboard. It covers information about sales revenue, customer, avg transaction price and new sales by division. Pitch your topic with ease and precision using this Newly Launch Event Store Performance Kpi Dashboard Elements Sample PDF. This layout presents information on Collection By Revenue, Articles By Sold Items, Visitors And Transactions. It is also available for immediate download and adjustment. So, changes can be made in the color, design, graphics or any other component to create a unique layout.
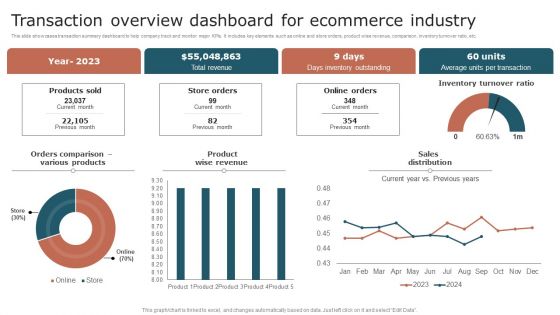
Transaction Overview Dashboard For Ecommerce Industry Summary PDF
This slide showcases transaction summary dashboard to help company track and monitor major KPIs. It includes key elements such as online and store orders, product wise revenue, comparison, inventory turnover ratio, etc. Pitch your topic with ease and precision using this Transaction Overview Dashboard For Ecommerce Industry Summary PDF. This layout presents information on Revenue, Inventory Outstanding, Transaction. It is also available for immediate download and adjustment. So, changes can be made in the color, design, graphics or any other component to create a unique layout.
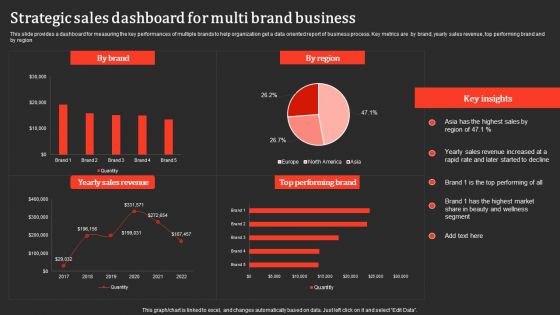
Strategic Sales Dashboard For Multi Brand Business Professional PDF
This slide provides a dashboard for measuring the key performances of multiple brands to help organization get a data oriented report of business process. Key metrics are by brand, yearly sales revenue, top performing brand and by region. Pitch your topic with ease and precision using this Strategic Sales Dashboard For Multi Brand Business Professional PDF. This layout presents information on Yearly Sales Revenue, Performing Brand. It is also available for immediate download and adjustment. So, changes can be made in the color, design, graphics or any other component to create a unique layout.
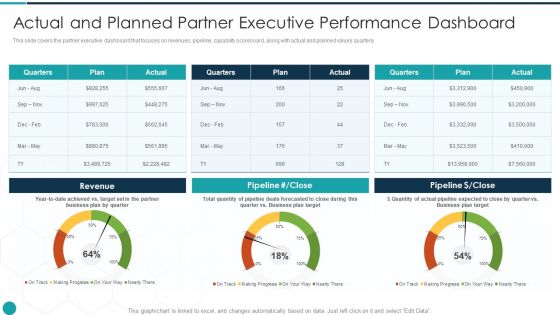
Upgrade Management Of Complex Business Associates Actual And Planned Partner Themes PDF
This slide covers the partner executive dashboard that focuses on revenues, pipeline, capability scoreboard, along with actual and planned values quarterly. Deliver an awe inspiring pitch with this creative upgrade management of complex business associates actual and planned partner themes pdf bundle. Topics like revenue, target, plan can be discussed with this completely editable template. It is available for immediate download depending on the needs and requirements of the user.
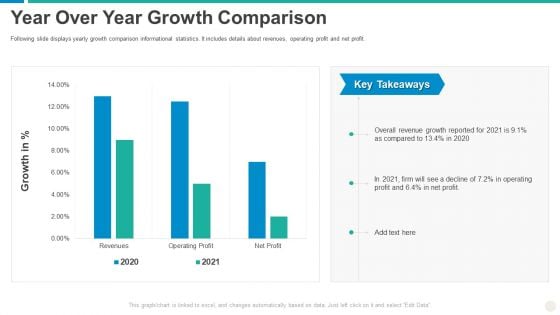
Establishing Successful Brand Strategy To Captivate Consumers Year Over Year Growth Comparison Professional PDF
Following slide displays yearly growth comparison informational statistics. It includes details about revenues, operating profit and net profit. Deliver an awe inspiring pitch with this creative establishing successful brand strategy to captivate consumers year over year growth comparison professional pdf bundle. Topics like operating profit, revenue, growth can be discussed with this completely editable template. It is available for immediate download depending on the needs and requirements of the user.
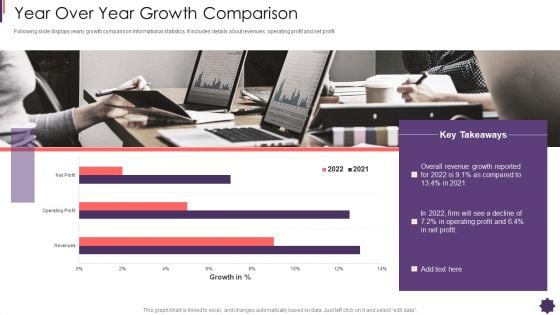
Year Over Year Growth Comparison Brand Techniques Structure Designs PDF
Following slide displays yearly growth comparison informational statistics. It includes details about revenues, operating profit and net profit. Deliver an awe inspiring pitch with this creative year over year growth comparison brand techniques structure designs pdf bundle. Topics like revenue, growth, profit can be discussed with this completely editable template. It is available for immediate download depending on the needs and requirements of the user.
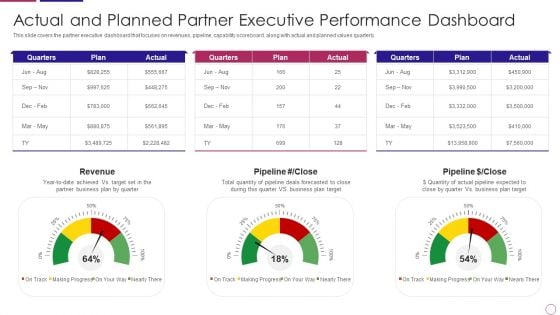
PRM To Streamline Business Processes Actual And Planned Partner Executive Performance Dashboard Demonstration PDF
This slide covers the partner executive dashboard that focuses on revenues, pipeline, capability scoreboard, along with actual and planned values quarterly. Deliver an awe inspiring pitch with this creative prm to streamline business processes actual and planned partner executive performance dashboard demonstration pdf bundle. Topics like revenue, plan, target can be discussed with this completely editable template. It is available for immediate download depending on the needs and requirements of the user.
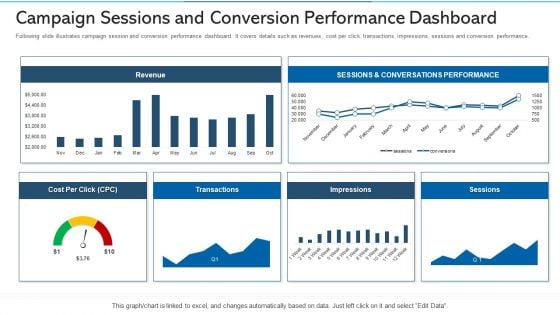
Campaign Sessions And Conversion Performance Dashboard Ppt Infographic Template Tips PDF
Following slide illustrates campaign session and conversion performance dashboard. It covers details such as revenues, cost per click, transactions, impressions, sessions and conversion performance. Deliver an awe-inspiring pitch with this creative campaign sessions and conversion performance dashboard ppt infographic template tips pdf. bundle. Topics like revenue, sessions and conversations performance can be discussed with this completely editable template. It is available for immediate download depending on the needs and requirements of the user.
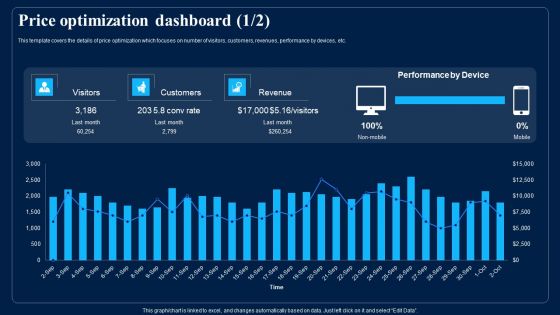
Identifying Optimum Pricing Methods For Business Price Optimization Dashboard Professional PDF
This template covers the details of price optimization which focuses on number of visitors, customers, revenues, performance by devices, etc. Deliver an awe inspiring pitch with this creative Identifying Optimum Pricing Methods For Business Price Optimization Dashboard Professional PDF bundle. Topics like Revenue, Customers, Performance By Device can be discussed with this completely editable template. It is available for immediate download depending on the needs and requirements of the user.
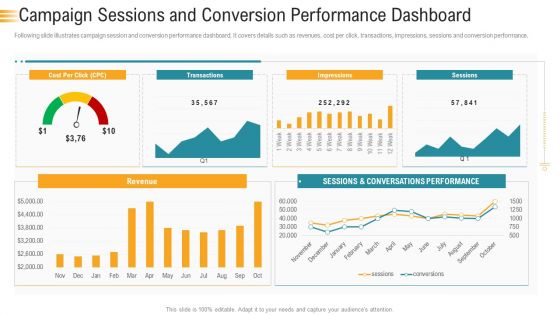
Establishing An Efficient Integrated Marketing Communication Process Campaign Sessions And Conversion Performance Dashboard Mockup PDF
Following slide illustrates campaign session and conversion performance dashboard. It covers details such as revenues, cost per click, transactions, impressions, sessions and conversion performance. Deliver an awe inspiring pitch with this creative establishing an efficient integrated marketing communication process campaign sessions and conversion performance dashboard mockup pdf bundle. Topics like conversations performance, revenue, cost per can be discussed with this completely editable template. It is available for immediate download depending on the needs and requirements of the user.
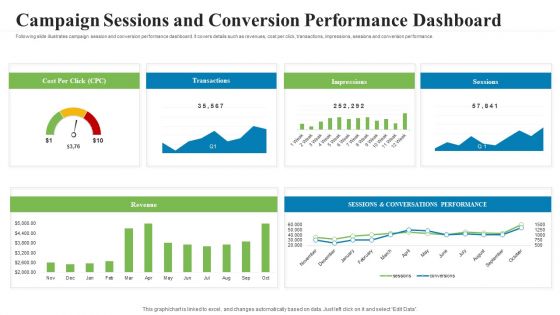
Creating Successful Advertising Campaign Sessions And Conversion Performance Dashboard Guidelines PDF
Following slide illustrates campaign session and conversion performance dashboard. It covers details such as revenues, cost per click, transactions, impressions, sessions and conversion performance. Deliver and pitch your topic in the best possible manner with this Creating Successful Advertising Campaign Sessions And Conversion Performance Dashboard Guidelines PDF. Use them to share invaluable insights on revenue, cost per click, conversations performance and impress your audience. This template can be altered and modified as per your expectations. So, grab it now.
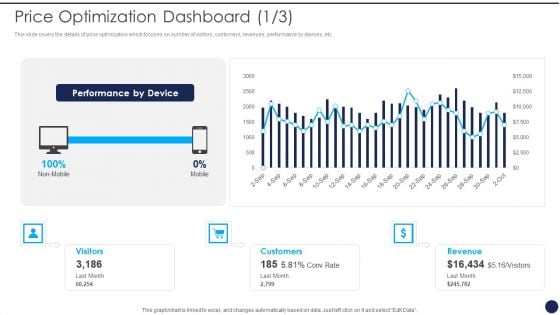
Product Pricing Strategies Analysis Price Optimization Dashboard Ppt File Background Image PDF
This slide covers the details of price optimization which focuses on number of visitors, customers, revenues, performance by devices, etc. Deliver an awe inspiring pitch with this creative Product Pricing Strategies Analysis Price Optimization Dashboard Ppt File Background Image PDF bundle. Topics like Visitors Customers Revenue, Performance By Device can be discussed with this completely editable template. It is available for immediate download depending on the needs and requirements of the user.
Strategic Brand Management Customer Tracking Dashboard To Monitor Brand Loyalty Mockup PDF
This slide provides information brand loyalty tracking dashboard in order to monitor customer engagement, average revenues, new vs. returning visitors performance, etc. Deliver and pitch your topic in the best possible manner with this Strategic Brand Management Customer Tracking Dashboard To Monitor Brand Loyalty Mockup PDF. Use them to share invaluable insights on Avg Revenue, Visit Frequency, Returning Visitors, Value Comparison and impress your audience. This template can be altered and modified as per your expectations. So, grab it now.
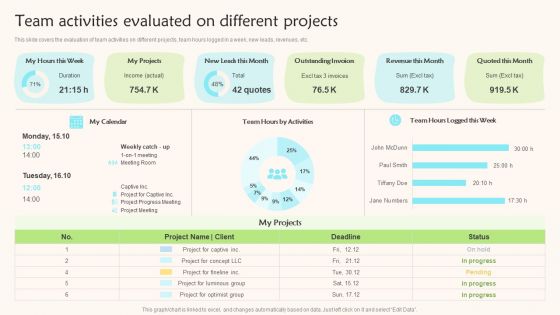
Team Activities Evaluated On Different Projects Teams Working Towards A Shared Objective Download PDF
This slide covers the evaluation of team activities on different projects, team hours logged in a week, new leads, revenues, etc.Deliver an awe inspiring pitch with this creative Team Activities Evaluated On Different Projects Teams Working Towards A Shared Objective Download PDF bundle. Topics like Outstanding Invoices, Revenue, Quoted can be discussed with this completely editable template. It is available for immediate download depending on the needs and requirements of the user.
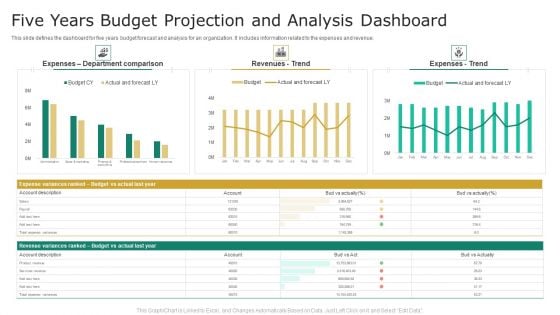
Five Years Budget Projection And Analysis Dashboard Graphics PDF
This slide defines the dashboard for five years budget forecast and analysis for an organization. It includes information related to the expenses and revenue. Showcasing this set of slides titled Five Years Budget Projection And Analysis Dashboard Graphics PDF. The topics addressed in these templates are Revenues, Expenses, Budget. All the content presented in this PPT design is completely editable. Download it and make adjustments in color, background, font etc. as per your unique business setting.
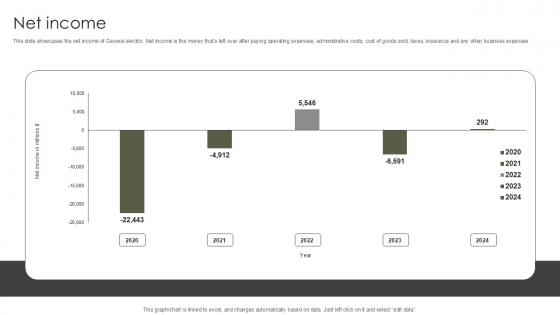
Net Income Military Aircraft Engine Manufacturing PPT Presentation CP SS V
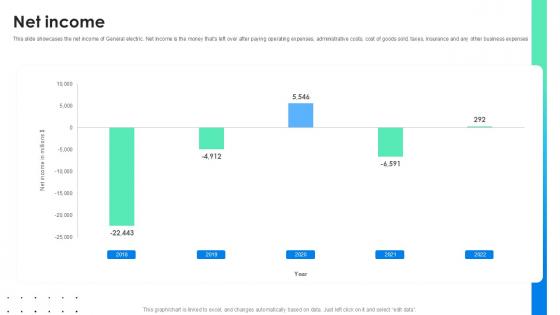
This slide showcases the net income of General electric. Net income is the money thats left over after paying operating expenses, administrative costs, cost of goods sold, taxes, insurance and any other business expenses. Slidegeeks has constructed Net Income Military Aircraft Engine Manufacturing PPT Presentation CP SS V after conducting extensive research and examination. These presentation templates are constantly being generated and modified based on user preferences and critiques from editors. Here, you will find the most attractive templates for a range of purposes while taking into account ratings and remarks from users regarding the content. This is an excellent jumping-off point to explore our content and will give new users an insight into our top-notch PowerPoint Templates. This slide showcases the net income of General electric. Net income is the money thats left over after paying operating expenses, administrative costs, cost of goods sold, taxes, insurance and any other business expenses
Net Income Global Energy Company Profile PPT Sample CP SS V
This slide showcases the net income of General electric. Net income is the money thats left over after paying operating expenses, administrative costs, cost of goods sold, taxes, insurance and any other business expenses. Slidegeeks has constructed Net Income Global Energy Company Profile PPT Sample CP SS V after conducting extensive research and examination. These presentation templates are constantly being generated and modified based on user preferences and critiques from editors. Here, you will find the most attractive templates for a range of purposes while taking into account ratings and remarks from users regarding the content. This is an excellent jumping-off point to explore our content and will give new users an insight into our top-notch PowerPoint Templates. This slide showcases the net income of General electric. Net income is the money thats left over after paying operating expenses, administrative costs, cost of goods sold, taxes, insurance and any other business expenses
Net Income International Trade Of Products And Services PPT Sample CP SS V
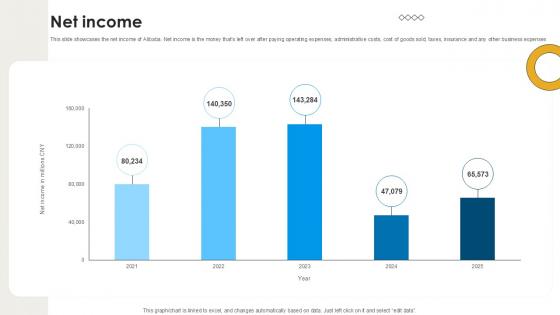
This slide showcases the net income of Alibaba. Net income is the money that s left over after paying operating expenses, administrative costs, cost of goods sold, taxes, insurance and any other business expenses. Slidegeeks has constructed Net Income International Trade Of Products And Services PPT Sample CP SS V after conducting extensive research and examination. These presentation templates are constantly being generated and modified based on user preferences and critiques from editors. Here, you will find the most attractive templates for a range of purposes while taking into account ratings and remarks from users regarding the content. This is an excellent jumping-off point to explore our content and will give new users an insight into our top-notch PowerPoint Templates. This slide showcases the net income of Alibaba. Net income is the money that s left over after paying operating expenses, administrative costs, cost of goods sold, taxes, insurance and any other business expenses
Business Model For Changing Ecosystem Ppt Powerpoint Show
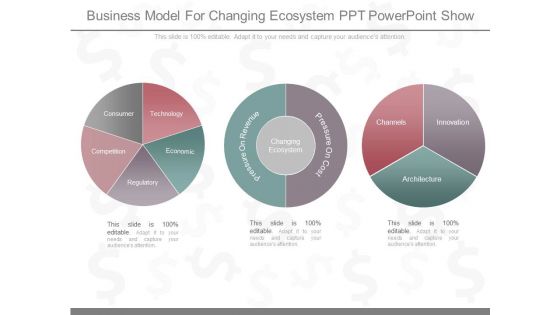
This is a business model for changing ecosystem ppt powerpoint show. This is a three stage process. The stages in this process are technology, economic, consumer, competition, regulatory, ressure on revenue, pressure on cost, changing ecosystem, channels, innovation, architecture.
Dashboard For Gross And Net Earnings Summary Designs Pdf
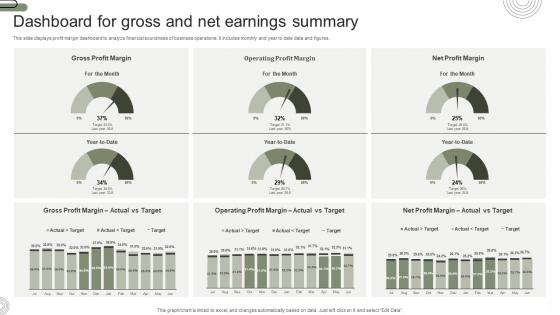
This slide displays profit margin dashboard to analyze financial soundness of business operations. It includes monthly and year to date data and figures. Showcasing this set of slides titled Dashboard For Gross And Net Earnings Summary Designs Pdf. The topics addressed in these templates are Dashboard For Gross, Net Earnings Summary, Financial Soundness. All the content presented in this PPT design is completely editable. Download it and make adjustments in color, background, font etc. as per your unique business setting. This slide displays profit margin dashboard to analyze financial soundness of business operations. It includes monthly and year to date data and figures.
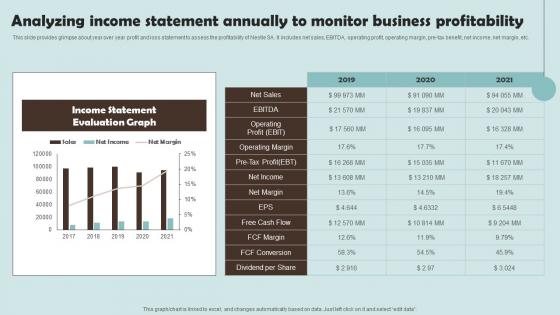
Analyzing Income Statement Annually To Monitor Outline Of Nestle Management Formats Pdf
This slide provides glimpse about year over year profit and loss statement to assess the profitability of Nestle SA. It includes net sales, EBITDA, operating profit, operating margin, pre-tax benefit, net income, net margin, etc.Slidegeeks is one of the best resources for PowerPoint templates. You can download easily and regulate Analyzing Income Statement Annually To Monitor Outline Of Nestle Management Formats Pdf for your personal presentations from our wonderful collection. A few clicks is all it takes to discover and get the most relevant and appropriate templates. Use our Templates to add a unique zing and appeal to your presentation and meetings. All the slides are easy to edit and you can use them even for advertisement purposes. This slide provides glimpse about year over year profit and loss statement to assess the profitability of Nestle SA. It includes net sales, EBITDA, operating profit, operating margin, pre tax benefit, net income, net margin, etc.
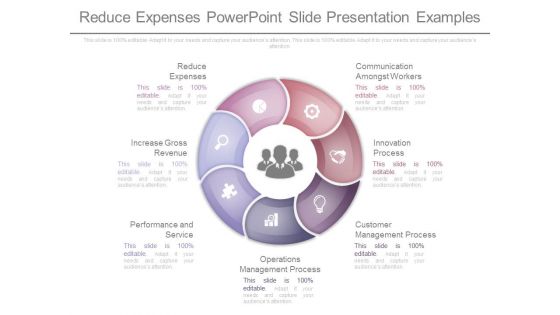
Reduce Expenses Powerpoint Slide Presentation Examples
This is a reduce expenses powerpoint slide presentation examples. This is a seven stage process. The stages in this process are reduce expenses, increase gross revenue, performance and service, operations management process, customer management process, innovation process, communication amongst workers.
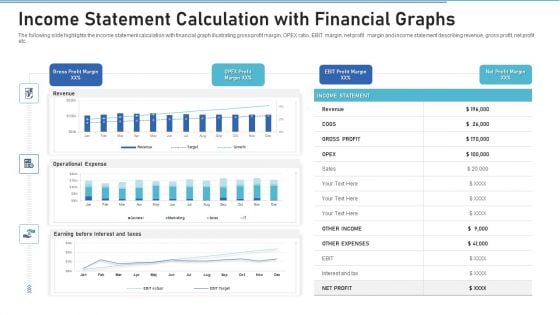
Income Statement Calculation With Financial Graphs Pictures PDF
Showcasing this set of slides titled income statement calculation with financial graphs pictures pdf. The topics addressed in these templates are revenue, gross profit, expenses. All the content presented in this PPT design is completely editable. Download it and make adjustments in color, background, font etc. as per your unique business setting.
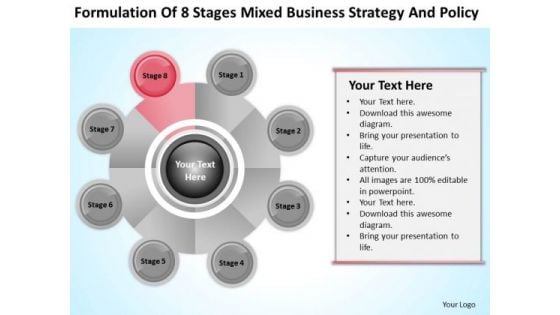
Business Process Flowchart 8 Stages Mixed Strategy And Policy Ppt PowerPoint Templates
We present our business process flowchart 8 stages mixed strategy and policy ppt PowerPoint templates.Use our Process and Flows PowerPoint Templates because Our PowerPoint Templates and Slides will let you Hit the target. Go the full distance with ease and elan. Download our Circle Charts PowerPoint Templates because Our PowerPoint Templates and Slides will weave a web of your great ideas. They are gauranteed to attract even the most critical of your colleagues. Present our Flow Chart PowerPoint Templates because Our PowerPoint Templates and Slides will give good value for money. They also have respect for the value of your time. Use our Shapes PowerPoint Templates because you can Break through with our PowerPoint Templates and Slides. Bring down the mental barriers of your audience. Download and present our Business PowerPoint Templates because Your ideas provide food for thought. Our PowerPoint Templates and Slides will help you create a dish to tickle the most discerning palate.Use these PowerPoint slides for presentations relating to Chart, flow, vector, flowchart, circular, position, diagram elements, segment, diagram vector, business, concept, sign, diagram chart, presentation, diagram, circle, graphic, description, element, shape, cycle, circulation, illustration, diagram circle, business, section, web, direction, design, color, text , brainstorm, background, fresh, present. The prominent colors used in the PowerPoint template are Red, Black, Gray. Lead the fight with our Business Process Flowchart 8 Stages Mixed Strategy And Policy Ppt PowerPoint Templates. You will come out on top.

Analyzing Income Statement Annually To Monitor Business Customer Segmentation Clipart Pdf
This slide provides glimpse about year over year profit and loss statement to assess the profitability of Nestle SA. It includes net sales, EBITDA, operating profit, operating margin, pre-tax benefit, net income, net margin, etc. If your project calls for a presentation, then Slidegeeks is your go-to partner because we have professionally designed, easy-to-edit templates that are perfect for any presentation. After downloading, you can easily edit Analyzing Income Statement Annually To Monitor Business Customer Segmentation Clipart Pdf and make the changes accordingly. You can rearrange slides or fill them with different images. Check out all the handy templates This slide provides glimpse about year over year profit and loss statement to assess the profitability of Nestle SA. It includes net sales, EBITDA, operating profit, operating margin, pre-tax benefit, net income, net margin, etc.
Bar Graph Showing Profit Analysis Ppt PowerPoint Presentation Icon Deck PDF
Presenting this set of slides with name bar graph showing profit analysis ppt powerpoint presentation icon deck pdf. The topics discussed in these slides are gross revenue, income. This is a completely editable PowerPoint presentation and is available for immediate download. Download now and impress your audience.
Sales Lead Qualification Rating Framework Our Financial Highlights Icons PDF
Deliver and pitch your topic in the best possible manner with this Sales Lead Qualification Rating Framework Our Financial Highlights Icons PDF Use them to share invaluable insights on Revenue, Gross Profit, Earnings and impress your audience. This template can be altered and modified as per your expectations. So, grab it now.
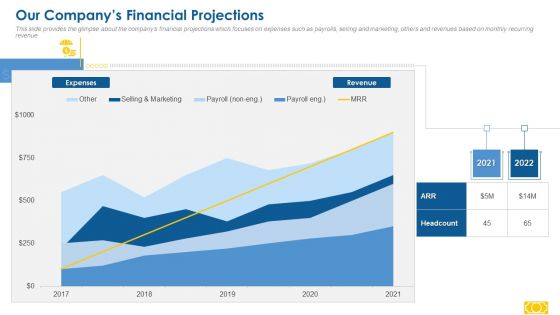
Series A Capital Raising Our Companys Financial Projections Rules PDF
Deliver an awe inspiring pitch with this creative series a capital raising our companys financial projections rules pdf bundle. Topics like expenses, revenue, marketing can be discussed with this completely editable template. It is available for immediate download depending on the needs and requirements of the user.
Bar Graph Showing Of Business Income And Expenditure Ppt PowerPoint Presentation Icon Show PDF
Presenting this set of slides with name bar graph showing of business income and expenditure ppt powerpoint presentation icon show pdf. The topics discussed in these slides are expenses, revenue. This is a completely editable PowerPoint presentation and is available for immediate download. Download now and impress your audience.
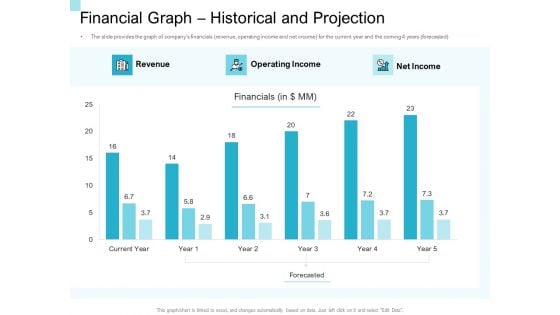
Convertible Market Notes Financial Graph Historical And Projection Ppt Summary Show PDF
Deliver an awe inspiring pitch with this creative convertible market notes financial graph historical and projection ppt summary show pdf bundle. Topics like revenue, operating income, net income, financial can be discussed with this completely editable template. It is available for immediate download depending on the needs and requirements of the user.
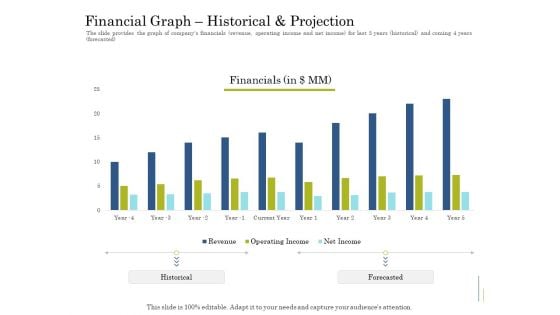
Supplementary Debt Financing Pitch Deck Financial Graph Historical And Projection Brochure PDF
Deliver an awe inspiring pitch with this creative supplementary debt financing pitch deck financial graph historical and projection brochure pdf bundle. Topics like financial, revenue, operating income, net income can be discussed with this completely editable template. It is available for immediate download depending on the needs and requirements of the user.
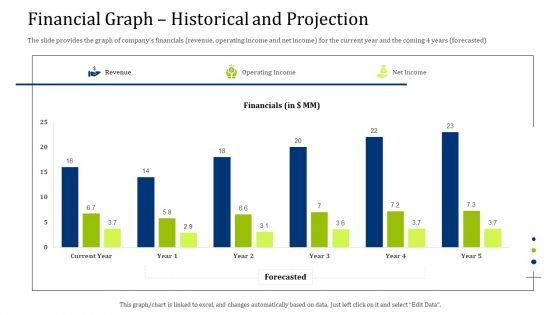
Convertible Debt Financing Pitch Deck Financial Graph Historical And Projection Clipart PDF
Deliver an awe-inspiring pitch with this creative convertible debt financing pitch deck financial graph historical and projection clipart pdf bundle. Topics like revenue, operating income, net income can be discussed with this completely editable template. It is available for immediate download depending on the needs and requirements of the user.
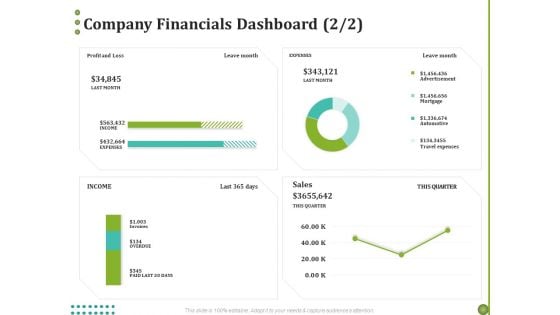
BPO Managing Enterprise Financial Transactions Company Financials Dashboard Information PDF
Presenting this set of slides with name bpo managing enterprise financial transactions company financials dashboard information pdf. The topics discussed in these slides are performance, revenue, expense, profit. This is a completely editable PowerPoint presentation and is available for immediate download. Download now and impress your audience.
Company Financials After Successful Implementation Of The Strategies Icons PDF
Deliver and pitch your topic in the best possible manner with this company financials after successful implementation of the strategies icons pdf. Use them to share invaluable insights on total revenue, total profit, customers trust in the companys products and impress your audience. This template can be altered and modified as per your expectations. So, grab it now.
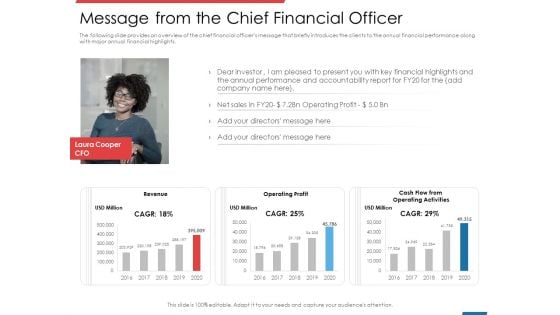
Financial PAR Message From The Chief Financial Officer Ppt Gallery Images PDF
Deliver and pitch your topic in the best possible manner with this financial par message from the chief financial officer ppt gallery images pdf. Use them to share invaluable insights on revenue, operating profit, cash flow from operating activities and impress your audience. This template can be altered and modified as per your expectations. So, grab it now.
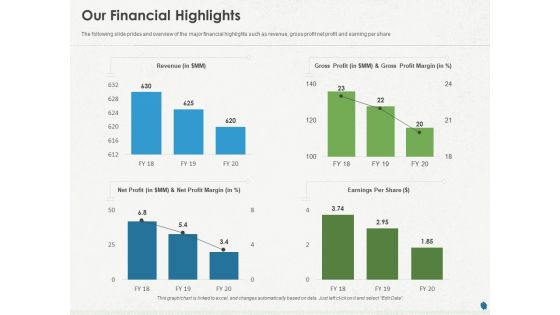
Distressed Debt Refinancing For Organizaton Our Financial Highlights Ppt PowerPoint Presentation Ideas Deck PDF
Presenting this set of slides with name tressed debt refinancing for organizaton our financial highlights ppt powerpoint presentation ideas deck pdf. The topics discussed in these slides are revenue, gross profit, gross profit margin, net profit net profit margin, earnings per share. This is a completely editable PowerPoint presentation and is available for immediate download. Download now and impress your audience.
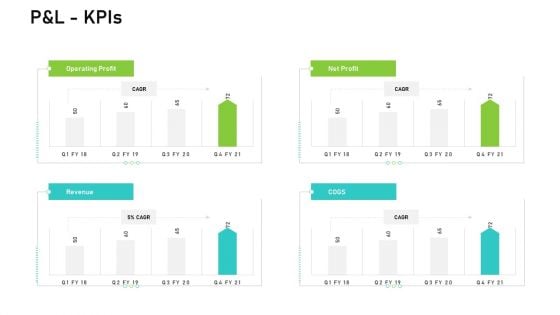
Audit For Financial Investment P And L Kpis Pictures PDF
Deliver an awe-inspiring pitch with this creative audit for financial investment p and l kpis pictures pdf bundle. Topics like operating profit, revenue, net profit can be discussed with this completely editable template. It is available for immediate download depending on the needs and requirements of the user.
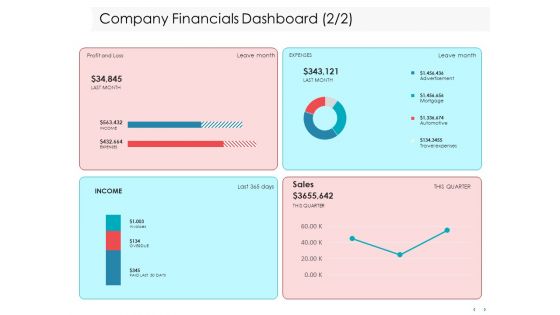
Managing CFO Services Company Financials Dashboard Profit Ppt Infographics Example File PDF
Presenting this set of slides with name managing cfo services company financials dashboard profit ppt infographics example file pdf. The topics discussed in these slides are revenue, customers, vendors, profit, expense, performance. This is a completely editable PowerPoint presentation and is available for immediate download. Download now and impress your audience.
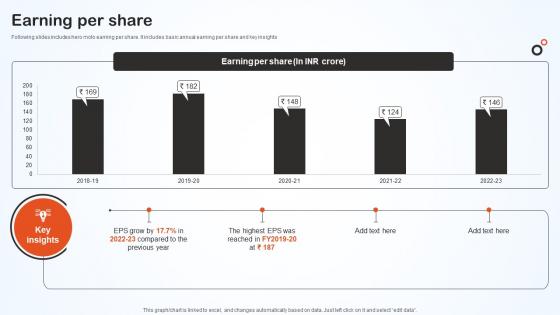
Earning Per Share Hero Bike Company Profile CP SS V
Following slides includes hero moto earning per share. It includes basic annual earning per share and key insights. If you are looking for a format to display your unique thoughts, then the professionally designed Earning Per Share Hero Bike Company Profile CP SS V is the one for you. You can use it as a Google Slides template or a PowerPoint template. Incorporate impressive visuals, symbols, images, and other charts. Modify or reorganize the text boxes as you desire. Experiment with shade schemes and font pairings. Alter, share or cooperate with other people on your work. Download Earning Per Share Hero Bike Company Profile CP SS V and find out how to give a successful presentation. Present a perfect display to your team and make your presentation unforgettable. Following slides includes hero moto earning per share. It includes basic annual earning per share and key insights.
Crisis Management Financial Performance Tracking Status Ppt Pictures Professional PDF
Deliver an awe-inspiring pitch with this creative crisis management financial performance tracking status ppt pictures professional pdf bundle. Topics like revenue, expense, profit can be discussed with this completely editable template. It is available for immediate download depending on the needs and requirements of the user.

Ways To Bounce Back From Insolvency Financial Highlights For Last Three Years Microsoft PDF
Presenting this set of slides with name ways to bounce back from insolvency financial highlights for last three years microsoft pdf. The topics discussed in these slides are revenue, gross profit, net profit margin, earnings per. This is a completely editable PowerPoint presentation and is available for immediate download. Download now and impress your audience.
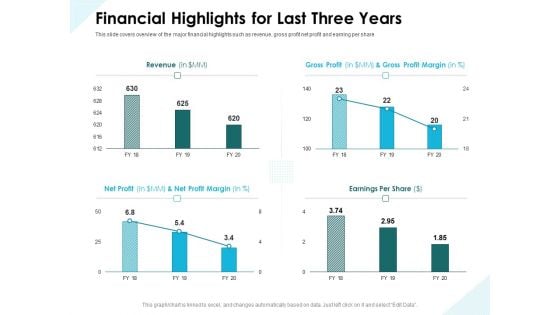
Issues Which Leads To Insolvency Financial Highlights For Last Three Years Guidelines PDF
Presenting this set of slides with name issues which leads to insolvency financial highlights for last three years guidelines pdf. The topics discussed in these slides are revenue, gross profit, net profit margin, earnings per. This is a completely editable PowerPoint presentation and is available for immediate download. Download now and impress your audience.
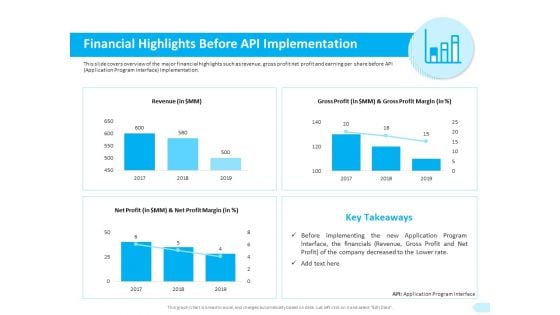
API Integration Software Development Financial Highlights Before API Implementation Template PDF
Presenting this set of slides with name api integration software development financial highlights before api implementation template pdf. The topics discussed in these slides are revenue, gross profit, net profit. This is a completely editable PowerPoint presentation and is available for immediate download. Download now and impress your audience.
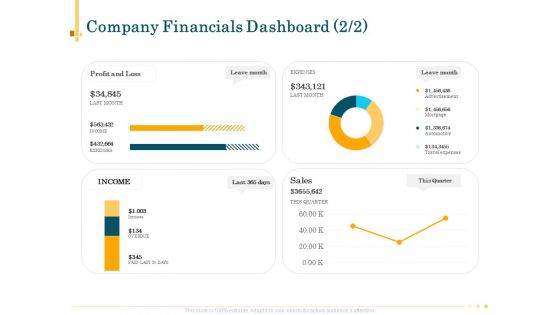
Outsource Bookkeeping Service Manage Financial Transactions Company Financials Dashboard Topics PDF
Presenting this set of slides with name outsource bookkeeping service manage financial transactions company financials dashboard topics pdf. The topics discussed in these slides are performance, revenue, expense, profit. This is a completely editable PowerPoint presentation and is available for immediate download. Download now and impress your audience.
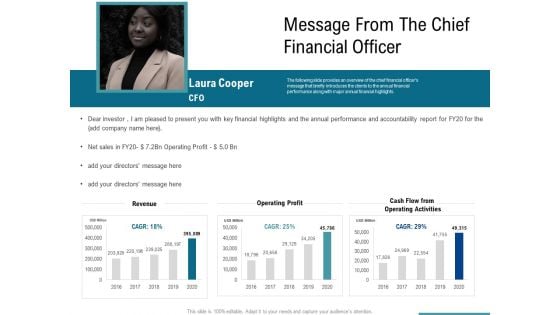
Corporate Execution Financial Liability Report Message From The Chief Financial Officer Brochure PDF
Presenting this set of slides with name corporate execution financial liability report message from the chief financial officer brochure pdf. The topics discussed in these slides are revenue, operating profit, cash flow from operating activities. This is a completely editable PowerPoint presentation and is available for immediate download. Download now and impress your audience.
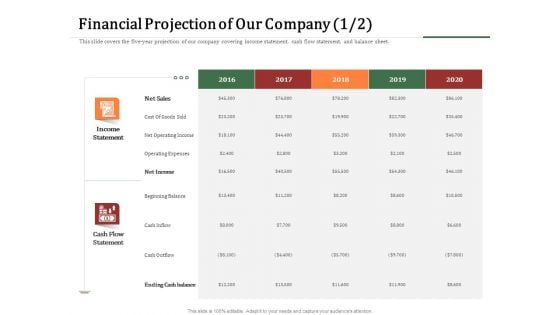
Challenges And Opportunities For Merchant Acquirers Financial Projection Of Our Company Net Formats PDF
Deliver and pitch your topic in the best possible manner with this challenges and opportunities for merchant acquirers financial projection of our company net formats pdf. Use them to share invaluable insights on revenue, free cash flow, net income, cash balance and impress your audience. This template can be altered and modified as per your expectations. So, grab it now.
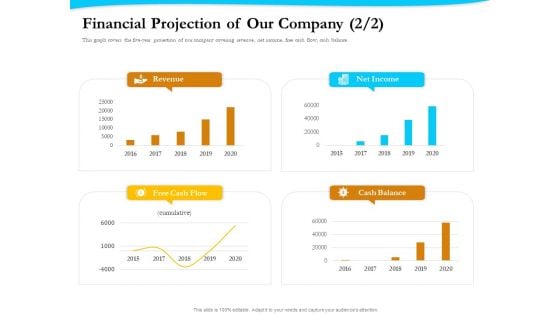
Payment Processor Financial Projection Of Our Company Summary PDF
Presenting this set of slides with name payment processor financial projection of our company summary pdf. The topics discussed in these slides are revenue, free cash flow, net income, cash balance. This is a completely editable PowerPoint presentation and is available for immediate download. Download now and impress your audience.
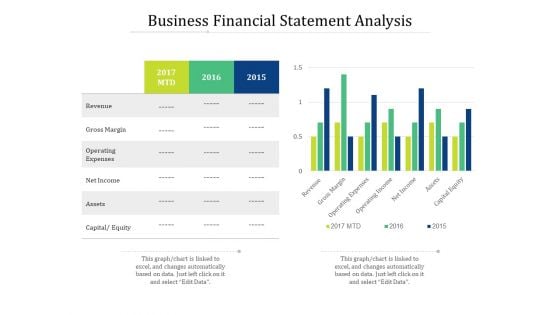
Business Financial Statement Analysis Ppt PowerPoint Presentation Gallery Gridlines PDF
Presenting this set of slides with name business financial statement analysis ppt powerpoint presentation gallery gridlines pdf. The topics discussed in these slides are revenue, net income, gross margin. This is a completely editable PowerPoint presentation and is available for immediate download. Download now and impress your audience.
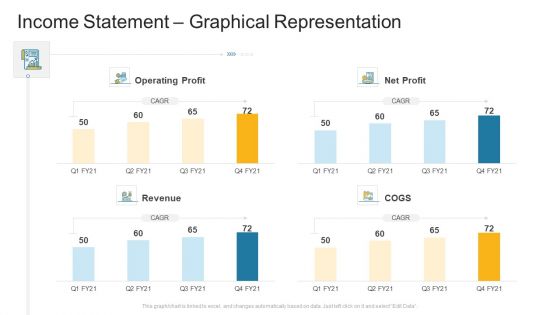
Income Statement Graphical Representation Company Profile Ppt Infographic Template Guidelines PDF
Deliver an awe inspiring pitch with this creative income statement graphical representation company profile ppt infographic template guidelines pdf bundle. Topics like operating profit, net profit, revenue, cogs can be discussed with this completely editable template. It is available for immediate download depending on the needs and requirements of the user.
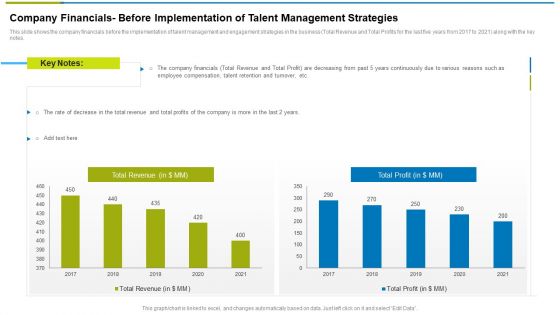
Company Financials Before Implementation Of Talent Management Strategies Ppt Ideas Graphic Images
Deliver and pitch your topic in the best possible manner with this company financials before implementation of talent management strategies ppt ideas graphic images. Use them to share invaluable insights on revenue, profits and impress your audience. This template can be altered and modified as per your expectations. So, grab it now.
Corporate Turnaround Strategies Financial Performance Tracking Dashboard Rules PDF
Presenting this set of slides with name corporate turnaround strategies financial performance tracking dashboard rules pdf. The topics discussed in these slides are performance, profit, revenue, expense, customers. This is a completely editable PowerPoint presentation and is available for immediate download. Download now and impress your audience.
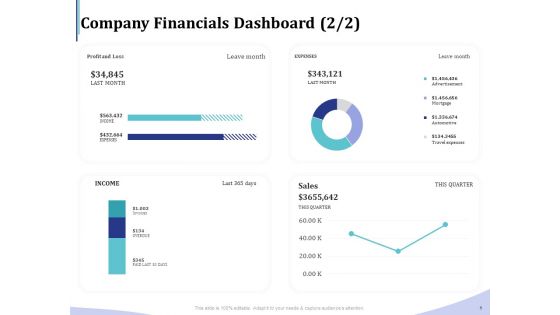
Accounting Bookkeeping Services Company Financials Dashboard Infographics PDF
Presenting this set of slides with name accounting bookkeeping services company financials dashboard infographics pdf. The topics discussed in these slides are performance, revenue, expense, profit. This is a completely editable PowerPoint presentation and is available for immediate download. Download now and impress your audience.
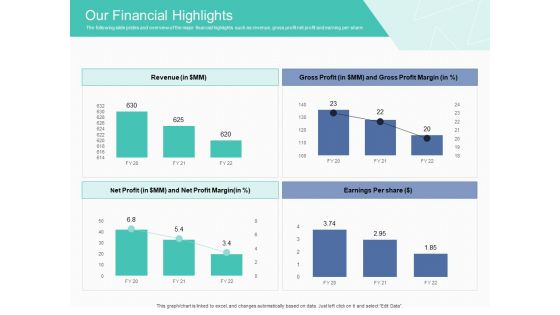
Corporate Debt Refinancing And Restructuring Our Financial Highlights Professional PDF
Presenting this set of slides with name corporate debt refinancing and restructuring our financial highlights professional pdf. The topics discussed in these slides are revenue, gross profit, margin. This is a completely editable PowerPoint presentation and is available for immediate download. Download now and impress your audience.
Effective Corporate Turnaround Management Financial Performance Tracking Dashboard Graphics PDF
Presenting this set of slides with name effective corporate turnaround management financial performance tracking dashboard graphics pdf. The topics discussed in these slides are performance, profit, revenue, expense, customers. This is a completely editable PowerPoint presentation and is available for immediate download. Download now and impress your audience.
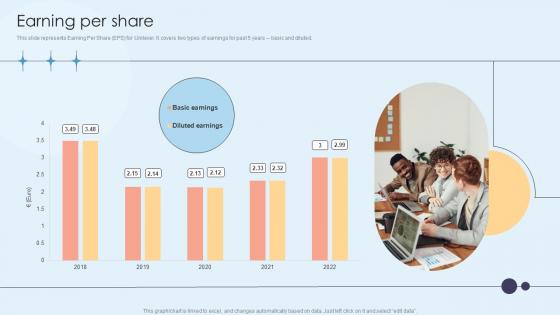
Earning Per Share Home Care Solutions Company Profile CP SS V
This slide represents Earning Per Share EPS for Unilever. It covers two types of earnings for past 5 years basic and diluted.If you are looking for a format to display your unique thoughts, then the professionally designed Earning Per Share Home Care Solutions Company Profile CP SS V is the one for you. You can use it as a Google Slides template or a PowerPoint template. Incorporate impressive visuals, symbols, images, and other charts. Modify or reorganize the text boxes as you desire. Experiment with shade schemes and font pairings. Alter, share or cooperate with other people on your work. Download Earning Per Share Home Care Solutions Company Profile CP SS V and find out how to give a successful presentation. Present a perfect display to your team and make your presentation unforgettable. This slide represents Earning Per Share EPS for Unilever. It covers two types of earnings for past 5 years basic and diluted.
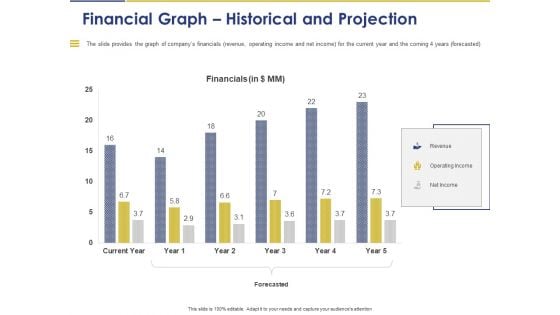
Convertible Note Pitch Deck Funding Strategy Financial Graph Historical And Projection Ppt PowerPoint Presentation Infographics Layouts PDF
Presenting this set of slides with name convertible note pitch deck funding strategy financial graph historical and projection ppt powerpoint presentation infographics layouts pdf. The topics discussed in these slides are financials, revenue, operating income, net income, forecasted. This is a completely editable PowerPoint presentation and is available for immediate download. Download now and impress your audience.
Gym Health And Fitness Market Industry Report ABC Fitness Inc Company Financials Ppt PowerPoint Presentation Icon Show PDF
Presenting this set of slides with name gym health and fitness market industry report abc fitness inc company financials ppt powerpoint presentation icon show pdf. The topics discussed in these slides are company net income, company total revenue, company ebitda. This is a completely editable PowerPoint presentation and is available for immediate download. Download now and impress your audience.
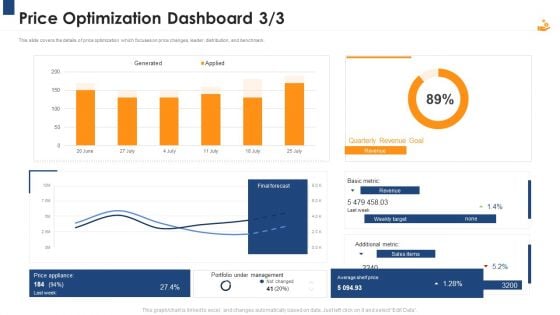
Income Management Tool Price Optimization Dashboard Quarterly Structure PDF
price changes, leader, distribution, and benchmark. Deliver and pitch your topic in the best possible manner with this income management tool price optimization dashboard quarterly structure pdf. Use them to share invaluable insights on revenue, target, sales, management, portfolio and impress your audience. This template can be altered and modified as per your expectations. So, grab it now.
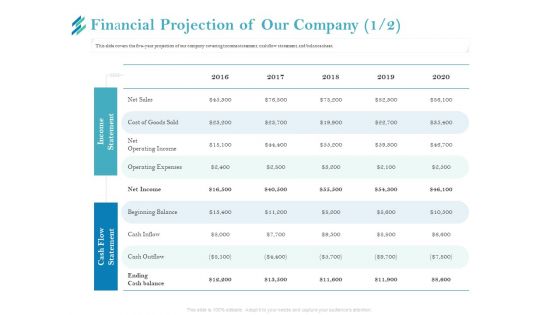
Online Payment Platform Financial Projection Of Our Company Net Elements PDF
Presenting this set of slides with name online payment platform financial projection of our company net elements pdf. The topics discussed in these slides are revenue, free cash flow, net income, cash balance. This is a completely editable PowerPoint presentation and is available for immediate download. Download now and impress your audience.


 Continue with Email

 Home
Home


