Revenue Chart

Rader Chart Ppt PowerPoint Presentation Portfolio Deck
This is a rader chart ppt powerpoint presentation portfolio deck. This is a two stage process. The stages in this process are radar chart, finance, analysis, marketing, business.
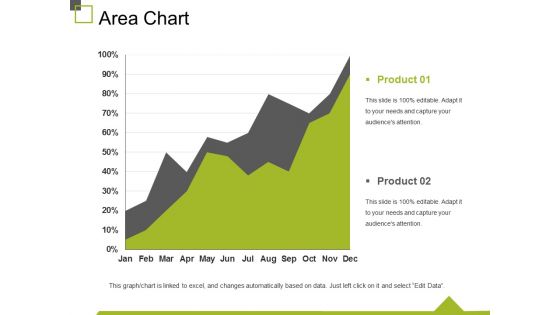
Area Chart Ppt PowerPoint Presentation Outline Inspiration
This is a area chart ppt powerpoint presentation outline inspiration. This is a two stage process. The stages in this process are chart, finance, marketing, business, percentage.
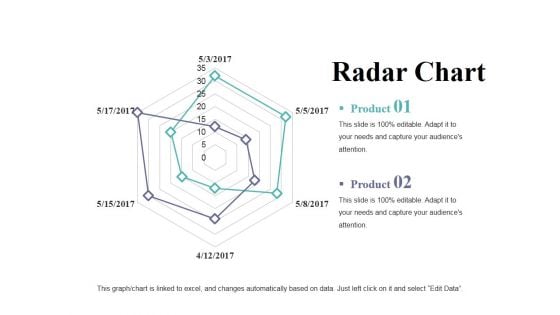
Radar Chart Ppt PowerPoint Presentation Portfolio Clipart
This is a radar chart ppt powerpoint presentation portfolio clipart. This is a two stage process. The stages in this process are radar chart, finance, analysis, marketing, business.
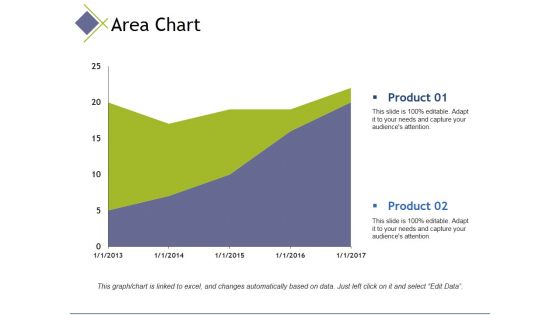
area chart ppt powerpoint presentation inspiration designs
This is a area chart ppt powerpoint presentation inspiration designs. This is a two stage process. The stages in this process are area chart, finance, analysis, marketing, business.
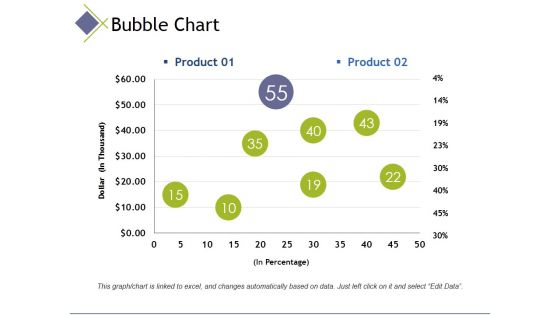
bubble chart ppt powerpoint presentation inspiration elements
This is a bubble chart ppt powerpoint presentation inspiration elements. This is a two stage process. The stages in this process are bubble chart, finance, analysis, marketing, business.
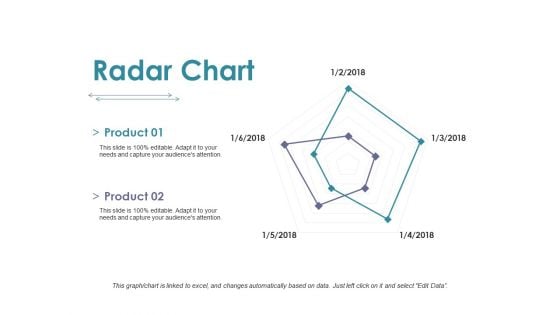
Radar Chart Ppt PowerPoint Presentation Professional Aids
This is a radar chart ppt powerpoint presentation professional aids. This is a two stage process. The stages in this process are marketing, business, radar chart, finance, graph.

Area Chart Ppt PowerPoint Presentation Portfolio Show
This is a area chart ppt powerpoint presentation portfolio show. This is a two stage process. The stages in this process are area chart, finance, analysis, business, marketing.
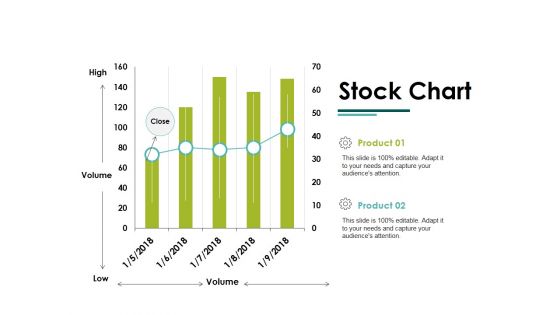
Stock Chart Ppt PowerPoint Presentation Ideas Inspiration
This is a stock chart ppt powerpoint presentation ideas inspiration. This is a two stage process. The stages in this process are high, volume, low, stock chart.
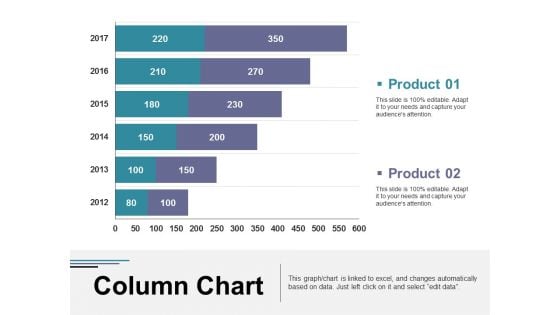
Column Chart Ppt PowerPoint Presentation Portfolio Outline
This is a column chart ppt powerpoint presentation portfolio outline. This is a two stage process. The stages in this process are column chart, business, marketing, graph, strategy.
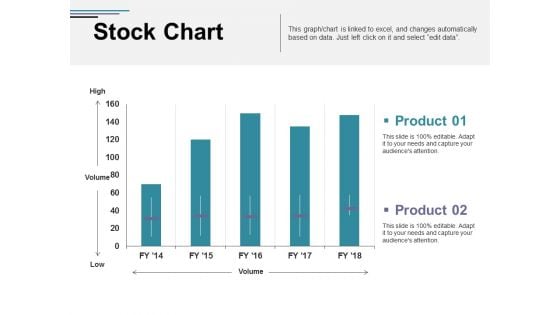
Stock Chart Ppt PowerPoint Presentation Pictures Model
This is a stock chart ppt powerpoint presentation pictures model. This is a two stage process. The stages in this process are business, high, volume, low, chart.
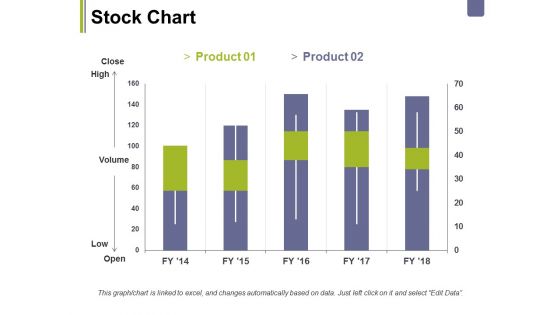
Stock Chart Ppt PowerPoint Presentation Outline Influencers
This is a stock chart ppt powerpoint presentation outline influencers. This is a two stage process. The stages in this process are business, marketing, high, volume, low, chart.
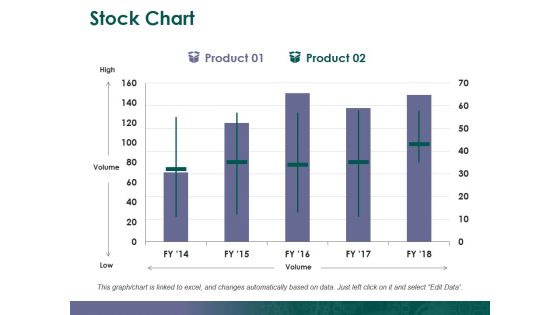
Stock Chart Ppt PowerPoint Presentation Outline Introduction
This is a stock chart ppt powerpoint presentation outline introduction. This is a two stage process. The stages in this process are stock chart, high, volume, low.
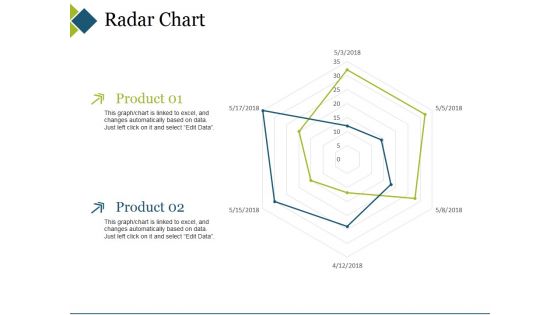
Radar Chart Ppt PowerPoint Presentation Layouts Inspiration
This is a radar chart ppt powerpoint presentation layouts inspiration. This is a two stage process. The stages in this process are business, radar chart, marketing, finance, strategy.

Combo Chart Ppt PowerPoint Presentation Infographics Good
This is a combo chart ppt powerpoint presentation infographics good. This is a three stage process. The stages in this process are combo chart, finance, analysis, business, marketing.
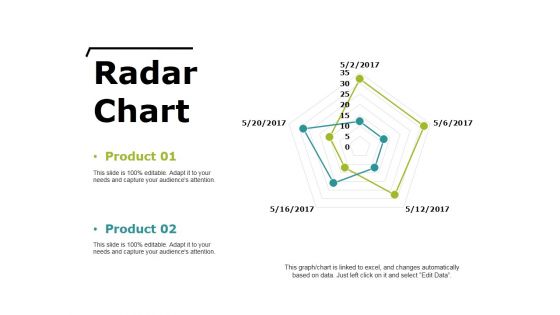
Radar Chart Ppt PowerPoint Presentation File Deck
This is a radar chart ppt powerpoint presentation file deck. This is a two stage process. The stages in this process are business, radar chart, marketing, finance, strategy.
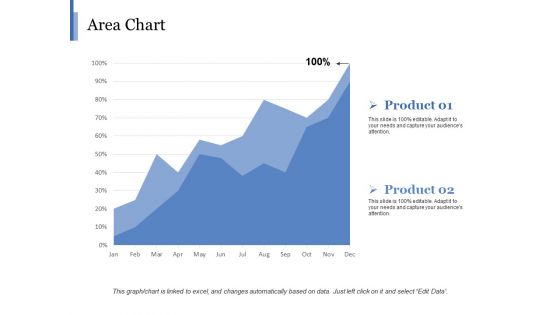
Area Chart Ppt PowerPoint Presentation Outline Good
This is a area chart ppt powerpoint presentation outline good. This is a two stage process. The stages in this process are business, chart, marketing, finance, strategy, graph.
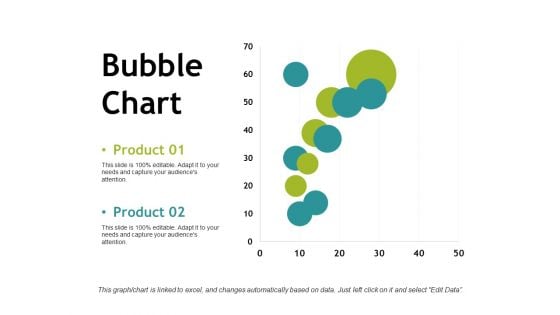
Bubble Chart Ppt PowerPoint Presentation Infographics Example
This is a bubble chart ppt powerpoint presentation infographics example. This is a two stage process. The stages in this process are business, bubble chart, marketing, strategy, finance.
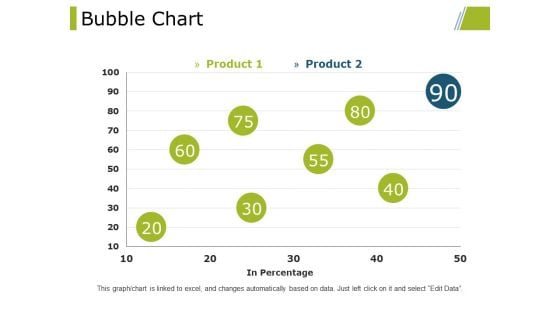
Bubble Chart Ppt PowerPoint Presentation Model Ideas
This is a bubble chart ppt powerpoint presentation model ideas. This is a two stage process. The stages in this process are bubble chart, finance, marketing, strategy, business.
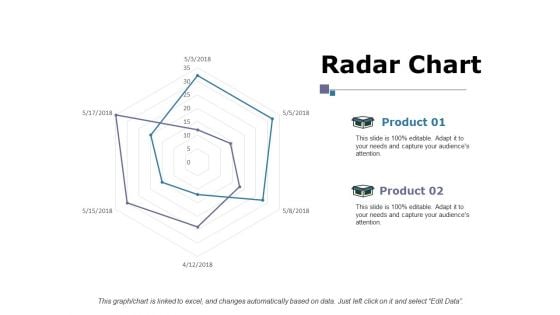
Radar Chart Ppt PowerPoint Presentation Ideas Examples
This is a radar chart ppt powerpoint presentation ideas examples. This is a two stage process. The stages in this process are business, marketing, radar chart, finance, strategy.
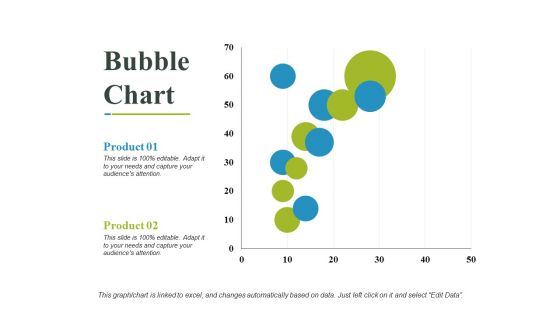
Bubble Chart Ppt PowerPoint Presentation Summary Sample
This is a bubble chart ppt powerpoint presentation summary sample. This is a two stage process. The stages in this process are business, marketing, bubble chart, finance, strategy.
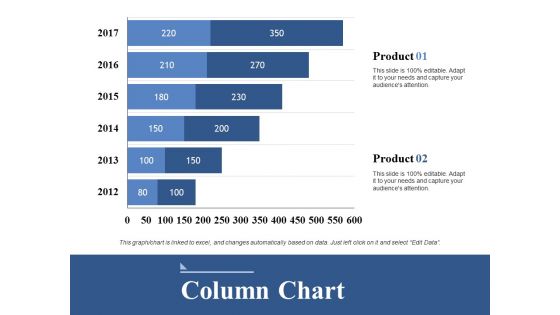
Column Chart Ppt PowerPoint Presentation Ideas Graphics
This is a column chart ppt powerpoint presentation ideas graphics. This is a two stage process. The stages in this process are business, chart, years, marketing, finance.
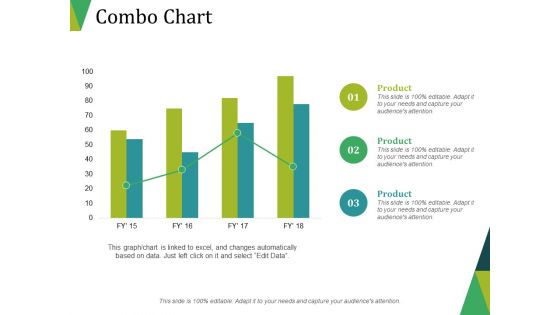
Combo Chart Ppt PowerPoint Presentation Inspiration Outline
This is a combo chart ppt powerpoint presentation inspiration outline. This is a three stage process. The stages in this process are combo chart, finance, marketing, strategy, business.
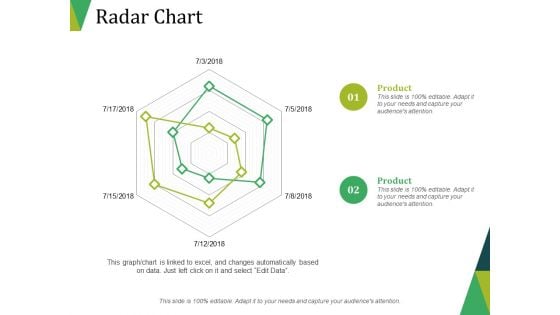
Radar Chart Ppt PowerPoint Presentation Tips
This is a radar chart ppt powerpoint presentation tips. This is a two stage process. The stages in this process are radar chart, finance, marketing, strategy, business.
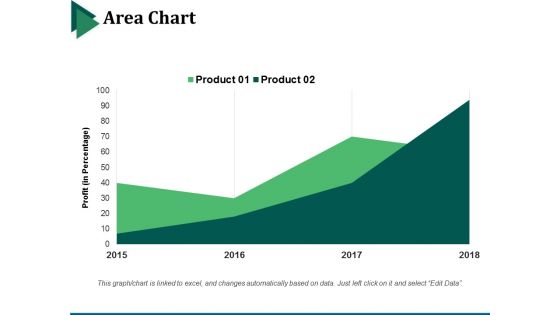
Area Chart Ppt PowerPoint Presentation File Portrait
This is a area chart ppt powerpoint presentation file portrait. This is a two stage process. The stages in this process are business, marketing, strategy, finance, area chart.
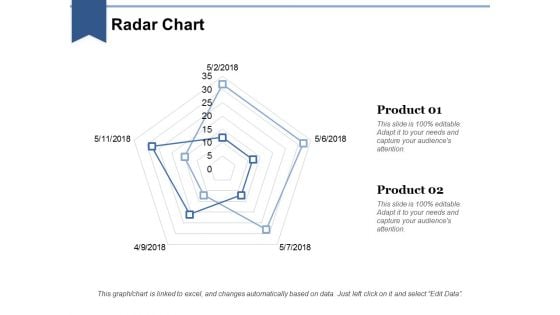
Radar Chart Ppt PowerPoint Presentation Styles Deck
This is a radar chart ppt powerpoint presentation styles deck. This is a two stage process. The stages in this process are business, radar chart, finance, strategy, graph.
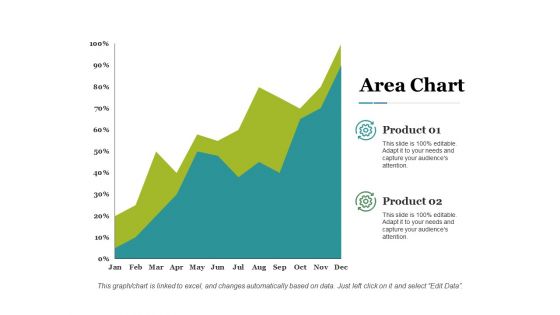
Area Chart Ppt PowerPoint Presentation Layouts Deck
This is a area chart ppt powerpoint presentation layouts deck. This is a two stage process. The stages in this process are business, marketing, area chart, finance, strategy.
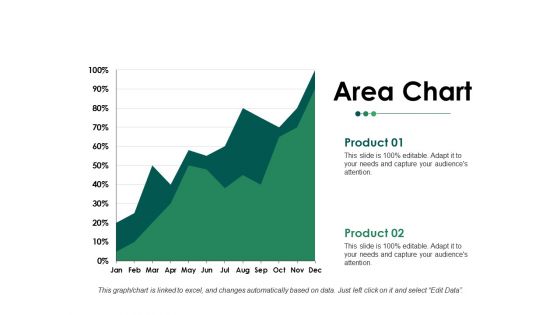
Area Chart Ppt PowerPoint Presentation Slides Guidelines
This is a area chart ppt powerpoint presentation slides guidelines. This is a two stage process. The stages in this process are business, area chart, marketing, strategy, finance.
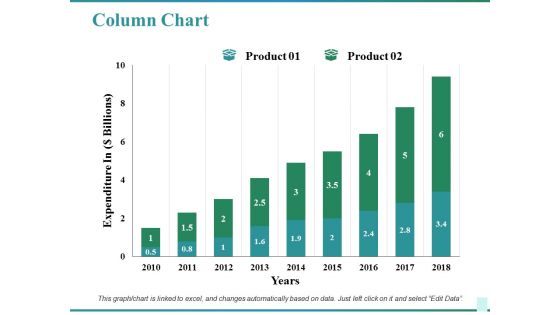
Column Chart Ppt PowerPoint Presentation Inspiration Picture
This is a column chart ppt powerpoint presentation inspiration picture. This is a two stage process. The stages in this process are business, marketing, years, expenditure in, chart.
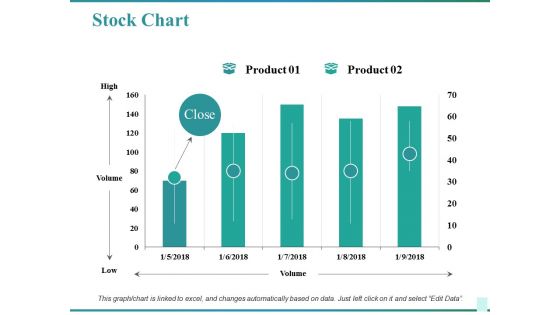
Stock Chart Ppt PowerPoint Presentation Pictures Microsoft
This is a stock chart ppt powerpoint presentation pictures microsoft. This is a two stage process. The stages in this process are business, high, volume, low, chart.
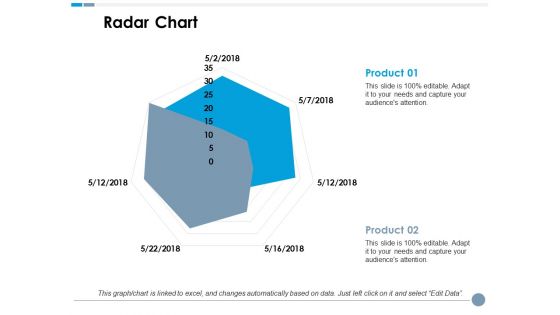
Radar Chart Ppt PowerPoint Presentation Summary Layouts
This is a radar chart ppt powerpoint presentation summary layouts. This is a two stage process. The stages in this process are business, radar chart, marketing, finance, strategy.
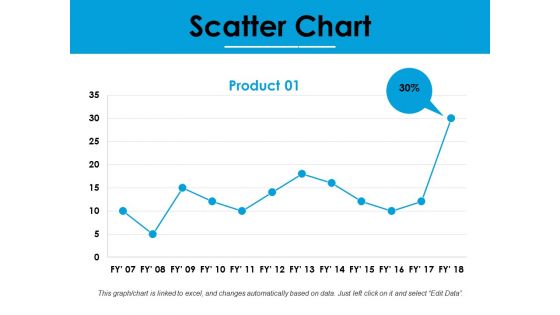
Scatter Chart Ppt PowerPoint Presentation Styles Information
This is a scatter chart ppt powerpoint presentation styles information. This is a one stage process. The stages in this process are business, marketing, finance, scatter chart, percentage.
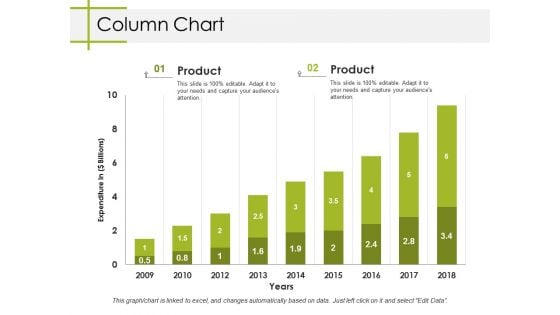
Column Chart Ppt PowerPoint Presentation Styles Clipart
This is a column chart ppt powerpoint presentation styles clipart. This is a two stage process. The stages in this process are column chart, finance, marketing, analysis, business.

Column Chart Ppt PowerPoint Presentation Show Brochure
This is a column chart ppt powerpoint presentation show brochure. This is a two stage process. The stages in this process are column chart, finance, marketing, strategy, business.
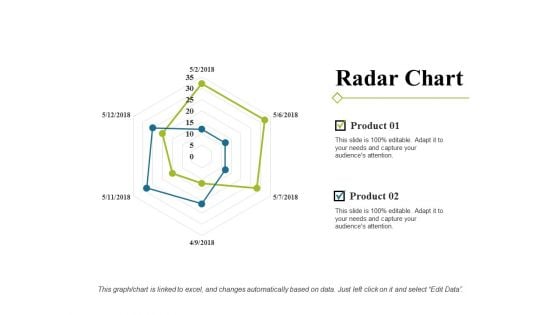
Radar Chart Ppt PowerPoint Presentation Portfolio Show
This is a radar chart ppt powerpoint presentation portfolio show. This is a two stage process. The stages in this process are radar chart, finance, marketing, strategy, analysis.
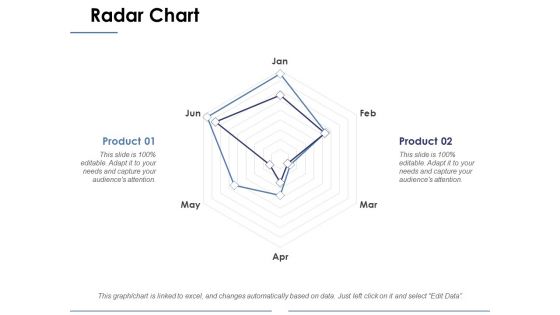
Radar Chart Ppt PowerPoint Presentation Portfolio Portrait
This is a radar chart ppt powerpoint presentation portfolio portrait. This is a two stage process. The stages in this process are business, radar chart, marketing, graph, strategy.
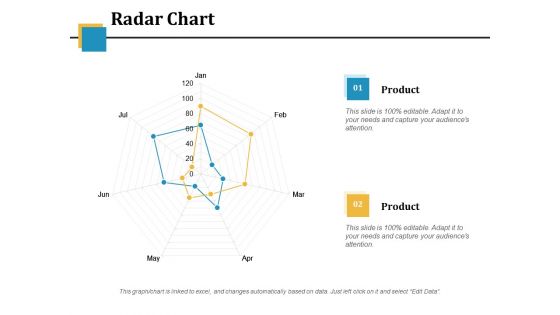
Radar Chart Ppt PowerPoint Presentation Summary Microsoft
This is a radar chart ppt powerpoint presentation summary microsoft. This is a two stage process. The stages in this process are business, radar chart, marketing, finance, strategy.
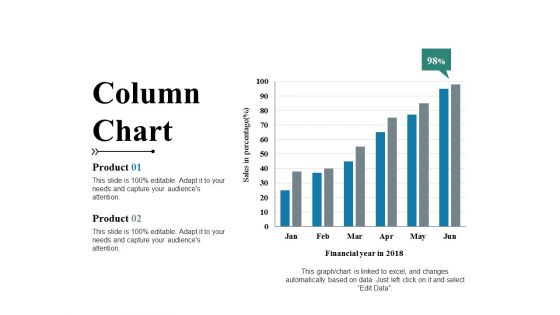
Column Chart Ppt PowerPoint Presentation Inspiration Inspiration
This is a column chart ppt powerpoint presentation inspiration inspiration. This is a two stage process. The stages in this process are column chart, growth, strategy, business, analysis.
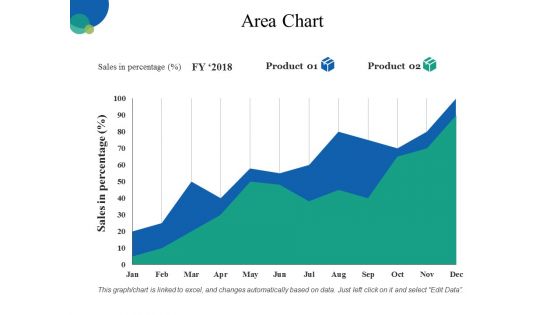
Area Chart Ppt PowerPoint Presentation Guidelines
This is a area chart ppt powerpoint presentation guidelines. This is a two stage process. The stages in this process are business, marketing, analysis, area chart, finance.
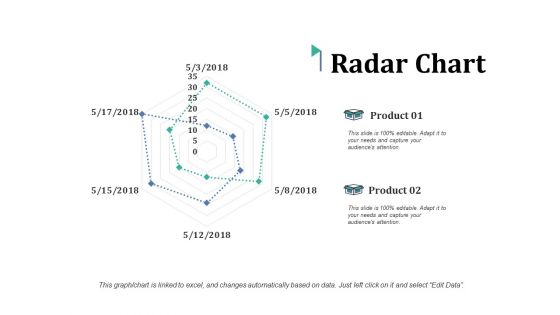
Radar Chart Ppt PowerPoint Presentation Pictures Smartart
This is a radar chart ppt powerpoint presentation pictures smartart. This is a two stage process. The stages in this process are radar chart, finance, marketing, analysis, management.
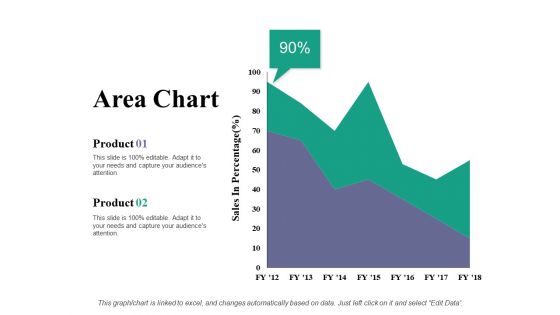
Area Chart Ppt PowerPoint Presentation Portfolio Examples
This is a area chart ppt powerpoint presentation portfolio examples. This is a two stage process. The stages in this process are product, area chart, sales in percentage.
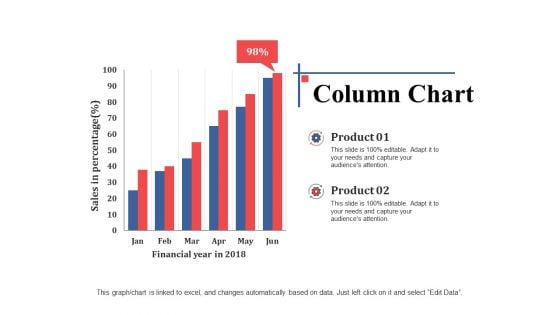
Column Chart Ppt PowerPoint Presentation Layouts Clipart
This is a column chart ppt powerpoint presentation layouts clipart. This is a two stage process. The stages in this process are column chart, finance, marketing, strategy, investment.
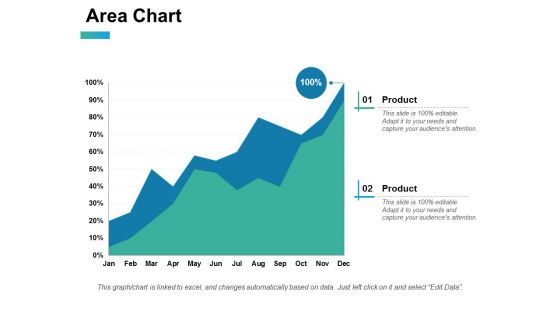
Area Chart Ppt PowerPoint Presentation Summary Guidelines
This is a area chart ppt powerpoint presentation summary guidelines. This is a two stage process. The stages in this process are area chart, finance, analysis, investment, marketing.
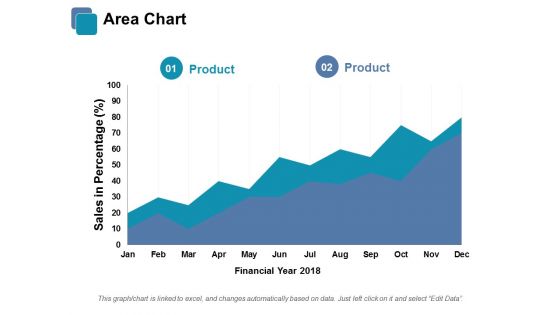
Area Chart Ppt PowerPoint Presentation Model Example
This is a area chart ppt powerpoint presentation model example. This is a two stage process. The stages in this process are area chart, finance, marketing, management, strategy.
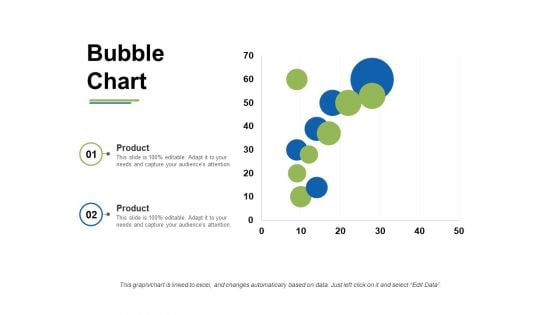
Bubble Chart Ppt PowerPoint Presentation Slides Portrait
This is a bubble chart ppt powerpoint presentation slides portrait. This is a two stage process. The stages in this process are bubble chart, product, finance, business, marketing.
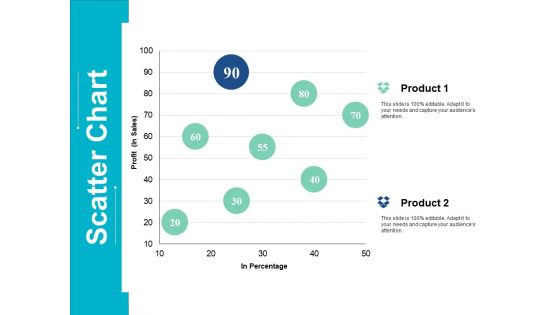
Scatter Chart Ppt PowerPoint Presentation Styles Guidelines
This is a scatter chart ppt powerpoint presentation styles guidelines. This is a two stage process. The stages in this process are scatter chart, percentage, product.
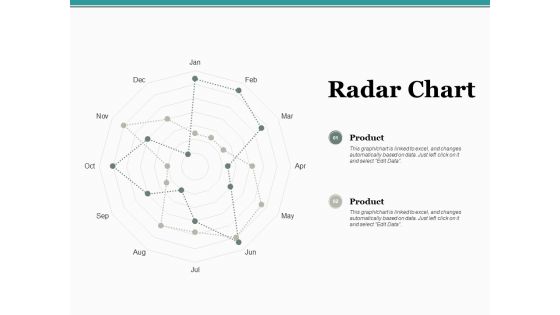
Radar Chart Ppt PowerPoint Presentation Professional Ideas
This is a radar chart ppt powerpoint presentation professional ideas. This is a two stage process. The stages in this process are product, percentage, management, marketing, chart.
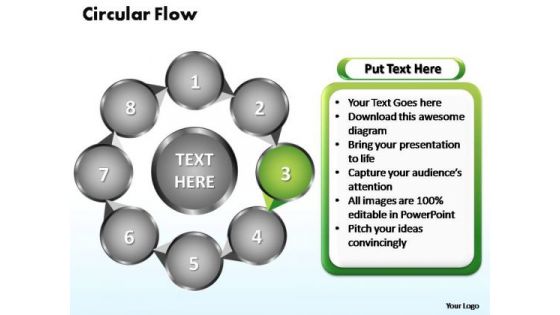
PowerPoint Slides Circular Flow Chart Ppt Theme
PowerPoint Slides Circular Flow Chart PPT Theme-Flowchart is a simple mapping tool that shows the sequence of actions within a process. Flowchart is widely used in business, education and economic presentations to help the audience visualize the content better, or to find flaws in a process.-PowerPoint Slides Circular Flow Chart PPT Theme Our PowerPoint Slides Circular Flow Chart Ppt Theme keep the faith alive. Belief in you will get stronger.
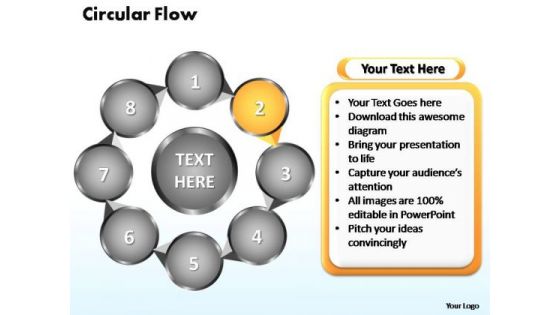
PowerPoint Slides Circular Flow Chart Ppt Themes
PowerPoint Slides Circular Flow Chart PPT Themes-Flowchart is a simple mapping tool that shows the sequence of actions within a process. Flowchart is widely used in business, education and economic presentations to help the audience visualize the content better, or to find flaws in a process.-PowerPoint Slides Circular Flow Chart PPT Themes Take a blind date with our PowerPoint Slides Circular Flow Chart Ppt Themes. You will be charmed to the core.
PowerPoint Slides Circular Flow Chart Ppt Templates
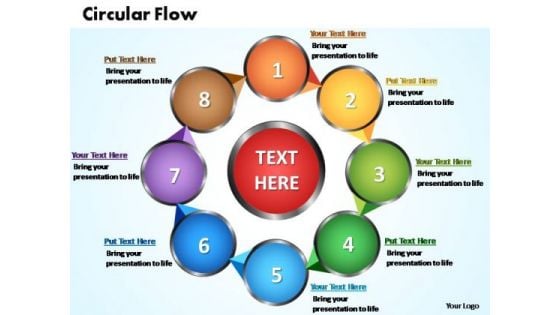
PowerPoint Slides Circular Flow Chart PPT Templates-Flowchart is a simple mapping tool that shows the sequence of actions within a process. Flowchart is widely used in business, education and economic presentations to help the audience visualize the content better, or to find flaws in a process.-PowerPoint Slides Circular Flow Chart PPT Templates Create the aroma with our PowerPoint Slides Circular Flow Chart Ppt Templates. Draw the crowds to your views.
PowerPoint Slides Circular Flow Chart Ppt Slides
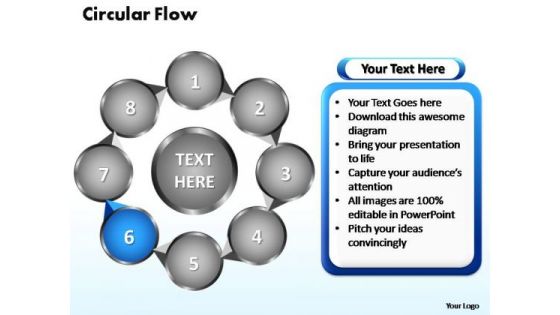
PowerPoint Slides Circular Flow Chart PPT Slides-Flowchart is a simple mapping tool that shows the sequence of actions within a process. Flowchart is widely used in business, education and economic presentations to help the audience visualize the content better, or to find flaws in a process.-PowerPoint Slides Circular Flow Chart PPT Slides Boost your chances with our PowerPoint Slides Circular Flow Chart Ppt Slides. They will help further your plans.
PowerPoint Slides Circular Flow Chart Ppt Design
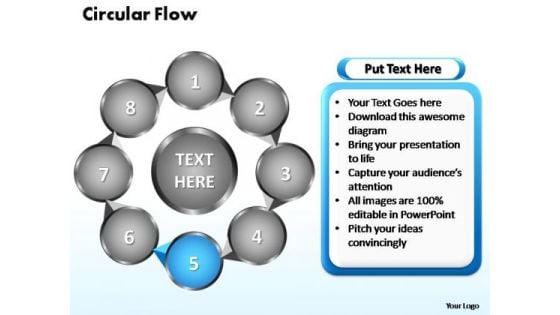
PowerPoint Slides Circular Flow Chart PPT Design-Flowchart is a simple mapping tool that shows the sequence of actions within a process. Flowchart is widely used in business, education and economic presentations to help the audience visualize the content better, or to find flaws in a process.-PowerPoint Slides Circular Flow Chart PPT Design Put the audience firmly in your favour. Extract their appreciation with our PowerPoint Slides Circular Flow Chart Ppt Design.

PowerPoint Slides Circular Flow Chart Ppt Designs
PowerPoint Slides Circular Flow Chart PPT Designs-Flowchart is a simple mapping tool that shows the sequence of actions within a process. Flowchart is widely used in business, education and economic presentations to help the audience visualize the content better, or to find flaws in a process.-PowerPoint Slides Circular Flow Chart PPT Designs Whatever the facet you have in mind? You will find it covered by our PowerPoint Slides Circular Flow Chart Ppt Designs.
PowerPoint Slides Circular Flow Chart Ppt Layout
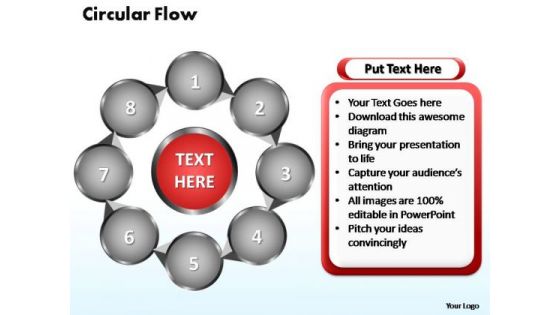
PowerPoint Slides Circular Flow Chart PPT Layout-Flowchart is a simple mapping tool that shows the sequence of actions within a process. Flowchart is widely used in business, education and economic presentations to help the audience visualize the content better, or to find flaws in a process.-PowerPoint Slides Circular Flow Chart PPT Layout Exclaim to the world with our PowerPoint Slides Circular Flow Chart Ppt Layout. Advertise your ability to everyone around.
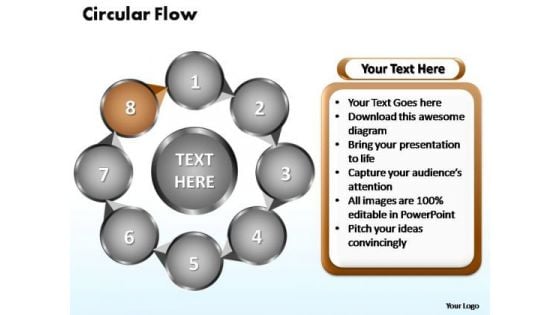
PowerPoint Slides Circular Flow Chart Ppt Layouts
PowerPoint Slides Circular Flow Chart PPT Layouts-Flowchart is a simple mapping tool that shows the sequence of actions within a process. Flowchart is widely used in business, education and economic presentations to help the audience visualize the content better, or to find flaws in a process.-PowerPoint Slides Circular Flow Chart PPT Layouts Get enormous praises with our PowerPoint Slides Circular Flow Chart Ppt Layouts. Dont pass up this opportunity to shine.
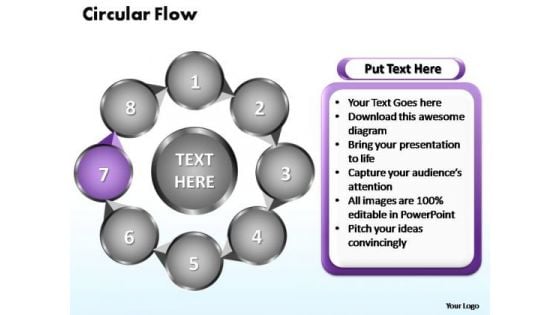
PowerPoint Slides Circular Flow Chart Ppt Slide
PowerPoint Slides Circular Flow Chart PPT Slide-Flowchart is a simple mapping tool that shows the sequence of actions within a process. Flowchart is widely used in business, education and economic presentations to help the audience visualize the content better, or to find flaws in a process.-PowerPoint Slides Circular Flow Chart PPT Slide Champion your favourite cause with our PowerPoint Slides Circular Flow Chart Ppt Slide. They give your argument added depth.
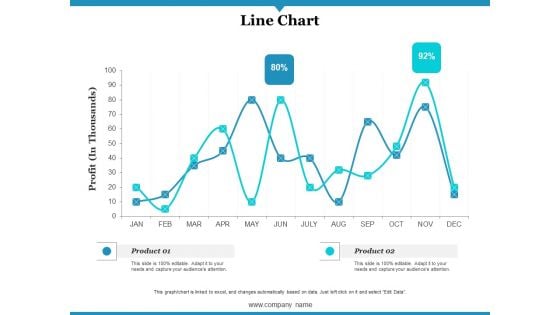
Line Chart Ppt PowerPoint Presentation Gallery Infographics
This is a line chart ppt powerpoint presentation gallery infographics. This is a two stage process. The stages in this process are profit, product, line chart.

Dollar Chart Money PowerPoint Template 0610
3d rendered pie chart on white background Our Dollar Chart Money PowerPoint Template 0610 are really considerate. They give everyone equal attention.
Area Chart Ppt PowerPoint Presentation Icon Microsoft
This is a area chart ppt powerpoint presentation icon microsoft. This is a two stage process. The stages in this process are business, strategy, analysis, planning, area chart.
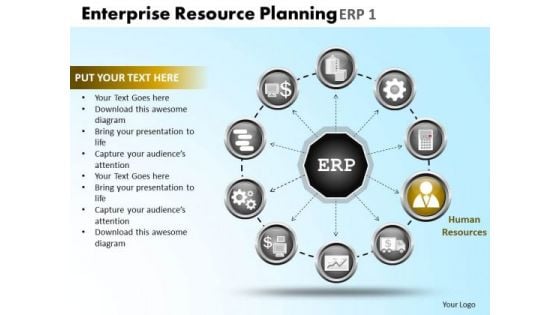
PowerPoint Presentation Chart Financial Planning Ppt Slidelayout
Exert some pressure with our PowerPoint Presentation Chart Financial Planning Ppt Slidelayout. Get the decision in your favour.
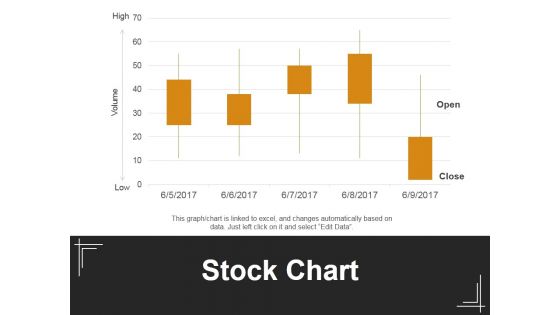
Stock Chart Ppt PowerPoint Presentation Slides Guidelines
This is a stock chart ppt powerpoint presentation slides guidelines. This is a five stage process. The stages in this process are stock chart, volume, low, close, open.


 Continue with Email

 Home
Home


