Revenue Chart
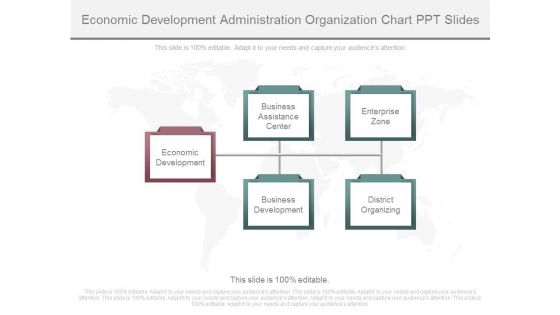
Economic Development Administration Organization Chart Ppt Slides
This is a economic development administration organization chart ppt slides. This is a five stage process. The stages in this process are economic development, business assistance center, business development, enterprise zone, district organizing.
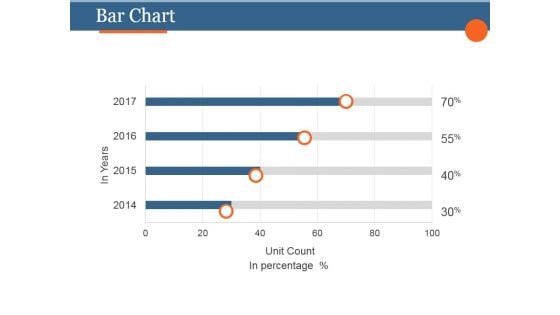
Bar Chart Ppt PowerPoint Presentation Layouts
This is a bar chart ppt powerpoint presentation layouts. This is a four stage process. The stages in this process are business, strategy, marketing, analysis, finance.
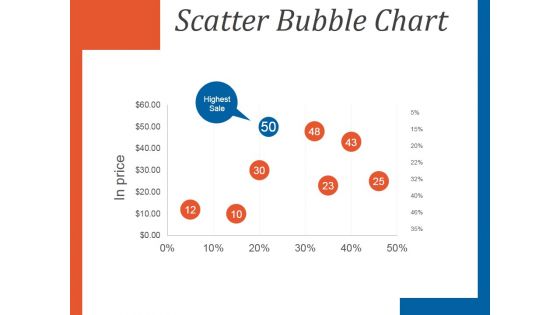
Scatter Bubble Chart Ppt PowerPoint Presentation Slides
This is a scatter bubble chart ppt powerpoint presentation slides. This is a eight stage process. The stages in this process are in price, highest sale, business, management.
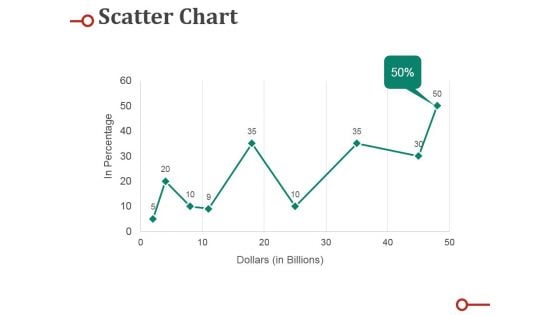
Scatter Chart Ppt PowerPoint Presentation Professional Deck
This is a scatter chart ppt powerpoint presentation professional deck. This is a nine stage process. The stages in this process are percentage, business, marketing, graph, line.
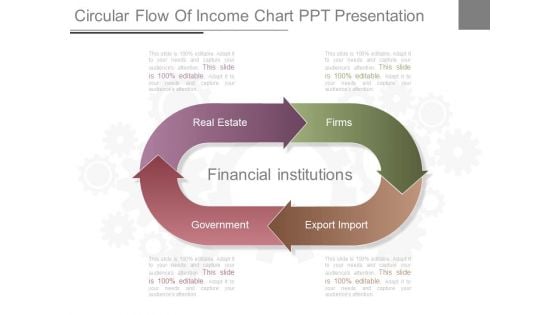
Circular Flow Of Income Chart Ppt Presentation
This is a circular flow of income chart ppt presentation. This is a four stage process. The stages in this process are real estate, government, financial institutions, export import, firms.
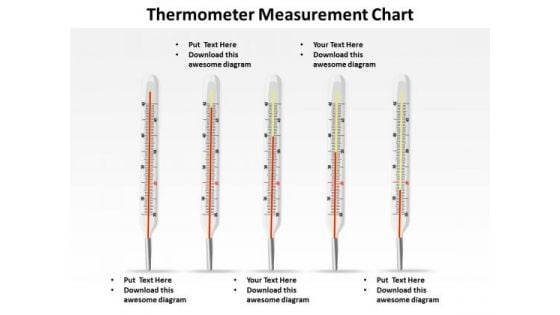
Sales Diagram Thermometer Measurement Chart Marketing Diagram
Your Grasp Of Economics Is Well Known. Help Your Audience Comprehend Issues With Our Sales Diagram Thermometer Measurement Chart Marketing Diagram Powerpoint Templates.

Pareto Chart Ppt PowerPoint Presentation Ideas
This is a pareto chart ppt powerpoint presentation ideas. This is a four stage process. The stages in this process are bar graph, finance, marketing, strategy, analysis, business.
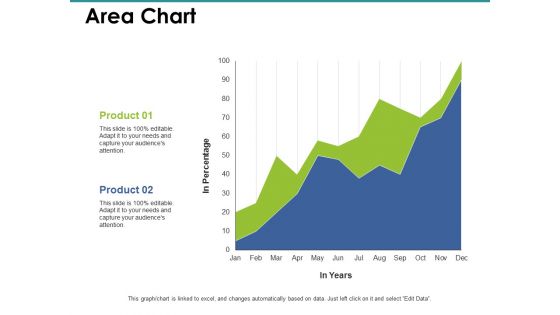
Area Chart Ppt PowerPoint Presentation Gallery Diagrams
This is a area chart ppt powerpoint presentation gallery diagrams. This is a two stage process. The stages in this process are finance, marketing, management, investment, analysis.
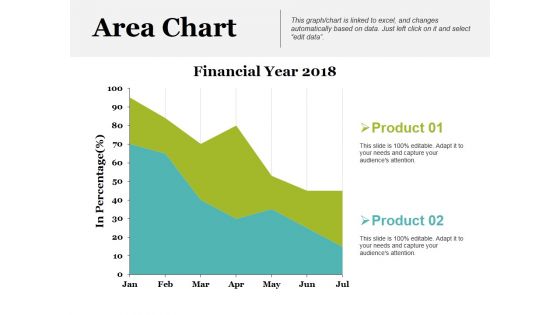
Area Chart Ppt PowerPoint Presentation Show Backgrounds
This is a area chart ppt powerpoint presentation show backgrounds. This is a two stage process. The stages in this process are financial year, product, in percentage.
Stock Chart Ppt PowerPoint Presentation Inspiration Icon
This is a stock chart ppt powerpoint presentation inspiration icon. This is a two stage process. The stages in this process are high, volume, low, product, close.
Stock Chart Ppt PowerPoint Presentation Icon Format
This is a stock chart ppt powerpoint presentation icon format. This is a two stage process. The stages in this process are product, close, high, volume, low.
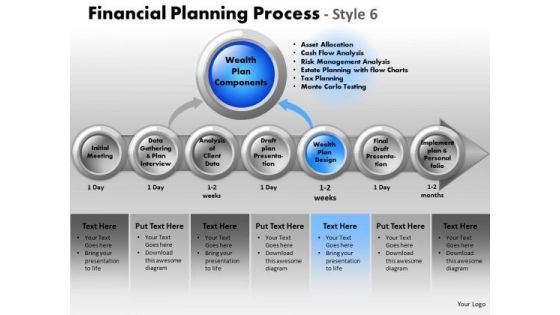
PowerPoint Backgrounds Chart Financial Planning Ppt Layout
PowerPoint Backgrounds Chart Financial Planning PPT Layout-These high quality powerpoint pre-designed slides and powerpoint templates have been carefully created by our professional team to help you impress your audience. All slides have been created and are 100% editable in powerpoint. Each and every property of any graphic - color, size, orientation, shading, outline etc. can be modified to help you build an effective powerpoint presentation. Any text can be entered at any point in the powerpoint template or slide. Simply DOWNLOAD, TYPE and PRESENT! You will find our PowerPoint Backgrounds Chart Financial Planning Ppt Layout are cut out for it. Designed to draw in audience appreciation.
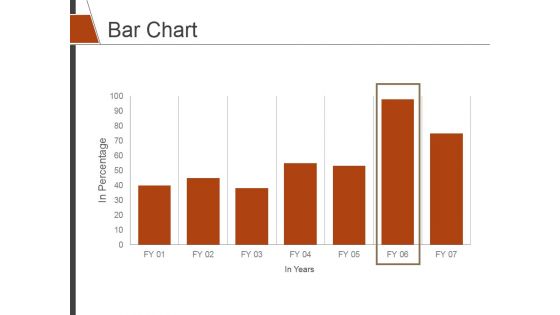
Bar Chart Ppt PowerPoint Presentation Slides Shapes
This is a bar chart ppt powerpoint presentation slides shapes. This is a seven stage process. The stages in this process are bar graph, finance, marketing, strategy, analysis.
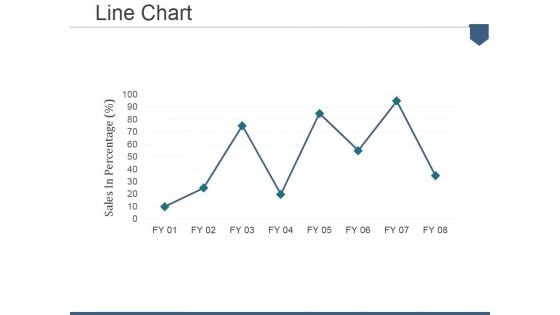
Line Chart Ppt PowerPoint Presentation Summary Portfolio
This is a line chart ppt powerpoint presentation summary portfolio. This is a eight stage process. The stages in this process are finance, planning, management, business, process, strategy.
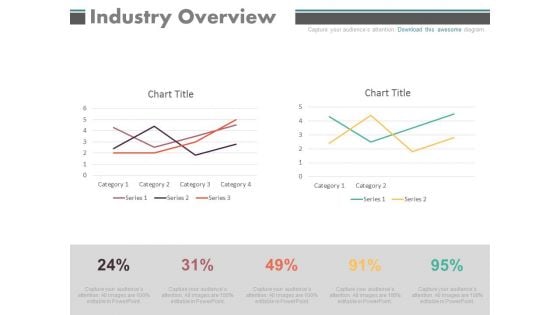
Industry Overview Percentage Chart Ppt Slides
This is a industry overview percentage chart ppt slides. This is a two stage process. The stages in this process are business, marketing.
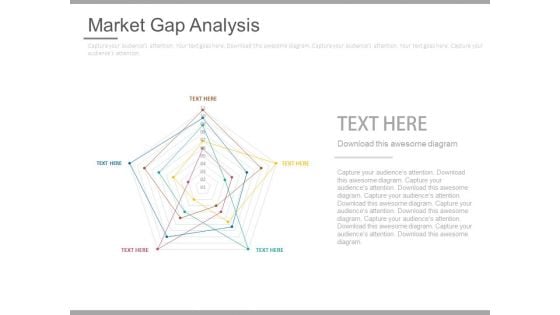
Market Gap Analysis Chart Ppt Slides
This is a market gap analysis chart ppt slides. This is a one stage process. The stages in this process are business, marketing.
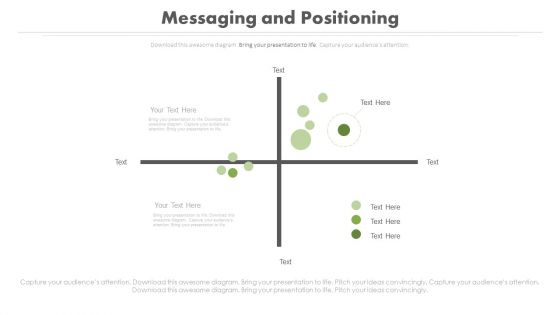
Messaging And Positioning Line Chart Ppt Slides
This is a messaging and positioning line chart ppt slides. This is a two stage process. The stages in this process are business, marketing.
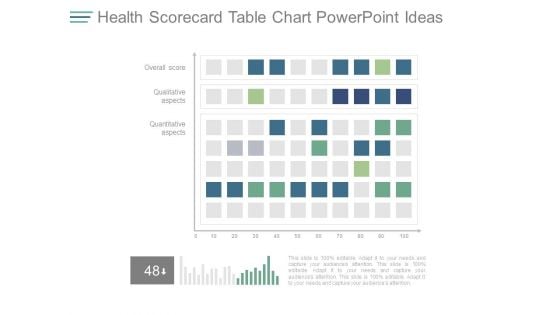
Health Scorecard Table Chart Powerpoint Ideas
This is a health scorecard table chart powerpoint ideas. This is a two stage process. The stages in this process are overall score, qualitative aspects, quantitative aspects.
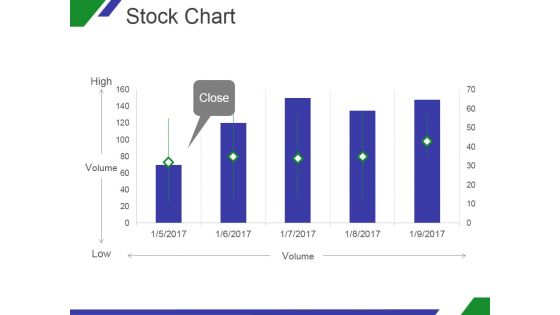
Stock Chart Ppt PowerPoint Presentation Slides
This is a stock chart ppt powerpoint presentation slides. This is a five stage process. The stages in this process are close, volume, high, low.
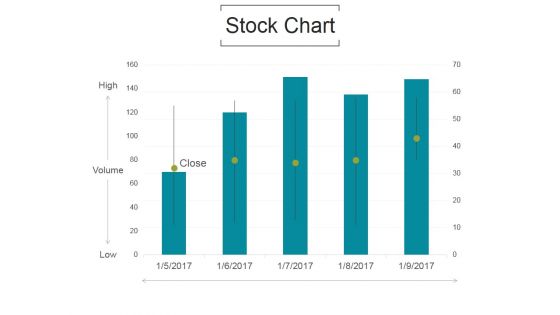
Stock Chart Ppt PowerPoint Presentation Example File
This is a stock chart ppt powerpoint presentation example file. This is a five stage process. The stages in this process are volume, high, low, close.

Stock Chart Ppt PowerPoint Presentation Inspiration
This is a stock chart ppt powerpoint presentation inspiration. This is a five stage process. The stages in this process are high, volume, low, close.

Stock Chart Ppt PowerPoint Presentation Professional
This is a stock chart ppt powerpoint presentation professional. This is a five stage process. The stages in this process are high, volume, low, close.
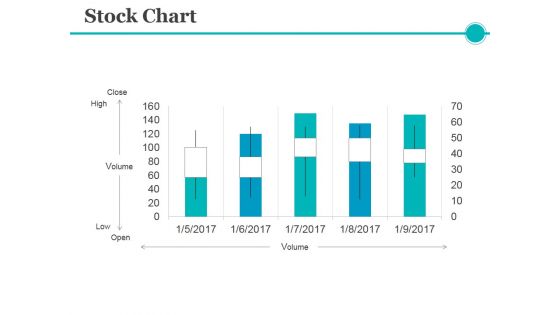
Stock Chart Ppt PowerPoint Presentation Ideas Example
This is a stock chart ppt powerpoint presentation ideas example. This is a five stage process. The stages in this process are volume, close, high, low, open.

Stock Chart Ppt PowerPoint Presentation Ideas Brochure
This is a stock chart ppt powerpoint presentation ideas brochure. This is a five stage process. The stages in this process are high, volume, low, close.
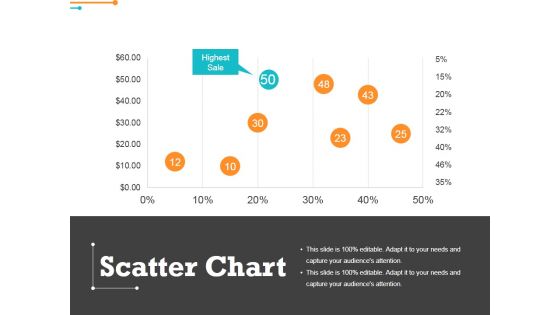
Scatter Chart Ppt PowerPoint Presentation Outline Graphics
This is a scatter chart ppt powerpoint presentation outline graphics. This is a eight stage process. The stages in this process are highest sale, percentage, finance, business.
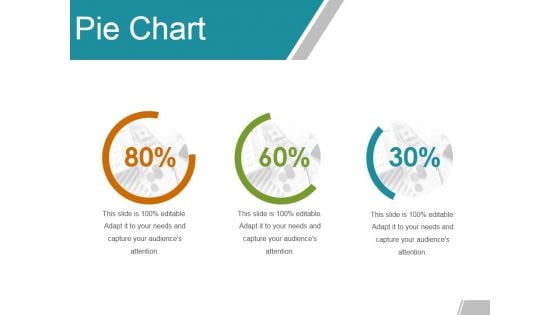
Pie Chart Ppt PowerPoint Presentation Summary Slide
This is a pie chart ppt powerpoint presentation summary slide. This is a three stage process. The stages in this process are percentage, finance, marketing, business.
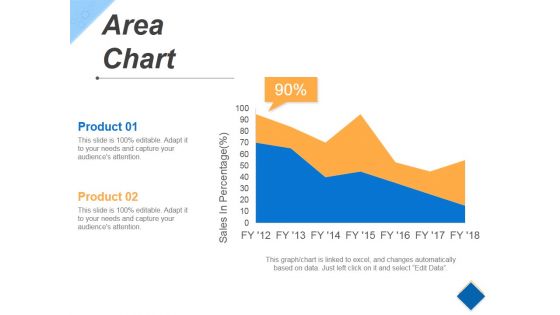
Area Chart Ppt PowerPoint Presentation Slides Gridlines
This is a area chart ppt powerpoint presentation slides gridlines. This is a two stage process. The stages in this process are business, finance, marketing, percentage.
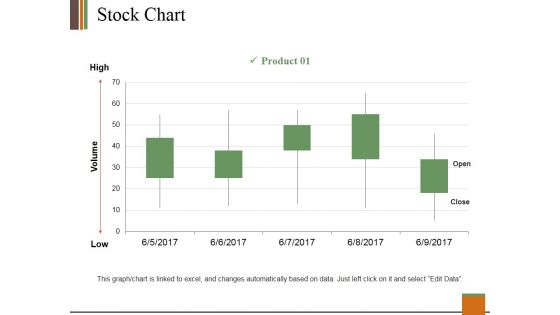
Stock Chart Ppt PowerPoint Presentation Slides Clipart
This is a stock chart ppt powerpoint presentation slides clipart. This is a one stage process. The stages in this process are product, high, volume, low, open, close.
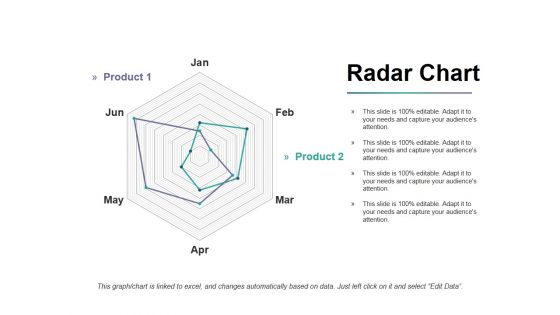
Radar Chart Ppt PowerPoint Presentation Infographics Portfolio
This is a radar chart ppt powerpoint presentation infographics portfolio. This is a two stage process. The stages in this process are product, finance, shapes, business, marketing.
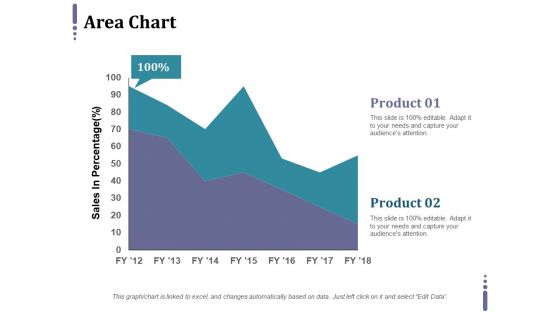
Area Chart Ppt PowerPoint Presentation Professional Grid
This is a area chart ppt powerpoint presentation professional grid. This is a two stage process. The stages in this process are product, sales in percentage, business.
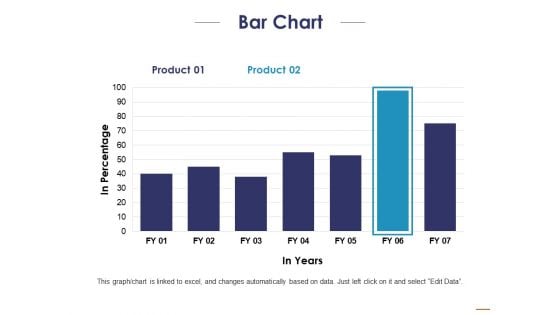
Bar Chart Ppt PowerPoint Presentation Portfolio Inspiration
This is a bar chart ppt powerpoint presentation portfolio inspiration. This is a two stage process. The stages in this process are product, in percentage, in years.

Stock Chart Ppt PowerPoint Presentation Layouts Outfit
This is a stock chart ppt powerpoint presentation layouts outfit. This is a two stage process. The stages in this process are close, high, volume, low, open.
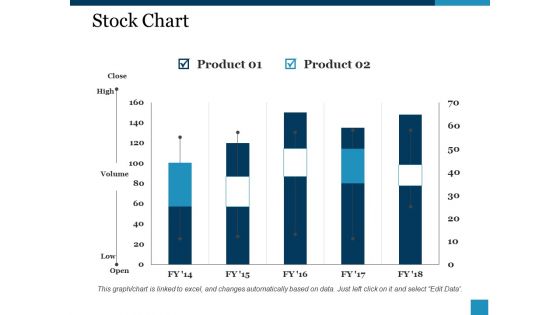
Stock Chart Ppt PowerPoint Presentation Guide
This is a stock chart ppt powerpoint presentation guide. This is a two stage process. The stages in this process are product, close, high, volume, low.
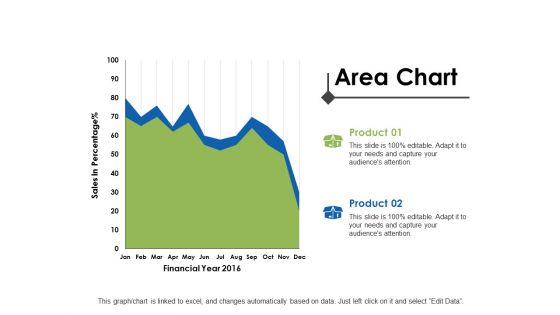
Area Chart Ppt PowerPoint Presentation Summary Model
This is a area chart ppt powerpoint presentation summary model. This is a two stage process. The stages in this process are analysis, finance, marketing, management, investment.
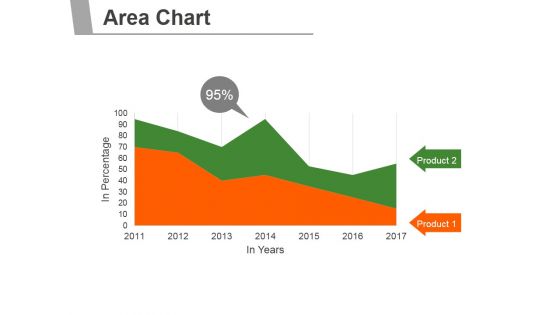
Area Chart Ppt PowerPoint Presentation Graphics
This is a area chart ppt powerpoint presentation graphics. This is a two stage process. The stages in this process are business, marketing, management, product, finance.
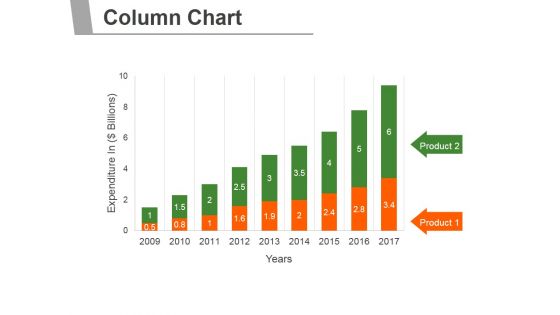
Column Chart Ppt PowerPoint Presentation Introduction
This is a column chart ppt powerpoint presentation introduction. This is a nine stage process. The stages in this process are business, marketing, management, growth, timeline.
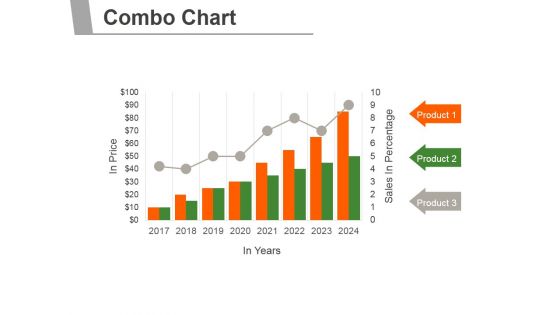
Combo Chart Ppt PowerPoint Presentation Inspiration
This is a combo chart ppt powerpoint presentation inspiration. This is a eight stage process. The stages in this process are business, marketing, management, growth, timeline.
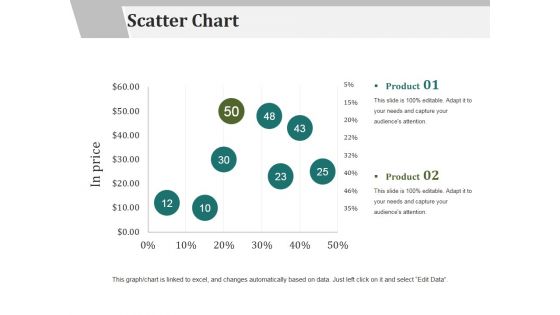
Scatter Chart Ppt PowerPoint Presentation Gallery Layout
This is a scatter chart ppt powerpoint presentation gallery layout. This is a two stage process. The stages in this process are financial, marketing, management, strategy, planning.
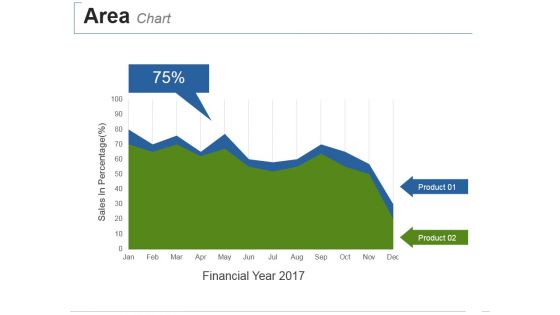
Area Chart Ppt PowerPoint Presentation Summary Deck
This is a area chart ppt powerpoint presentation summary deck. This is a two stage process. The stages in this process are sales in percentage, financial year.
Operating Expenses Analysis Pie Chart Ppt Icon
This is a operating expenses analysis pie chart ppt icon. This is a seven stage process. The stages in this process are finance, success, business, marketing, percentage.
Stock Chart Ppt PowerPoint Presentation Icon Microsoft
This is a stock chart ppt powerpoint presentation icon microsoft. This is a five stage process. The stages in this process are product, high, volume, low.
Pie Chart Ppt PowerPoint Presentation Layouts Icons
This is a pie chart ppt powerpoint presentation layouts icons. This is a three stage process. The stages in this process are business, finance, analysis, marketing, strategy.
Area Chart Ppt PowerPoint Presentation Summary Icon
This is a area chart ppt powerpoint presentation summary icon. This is a two stage process. The stages in this process are finance, marketing, management, investment, analysis.
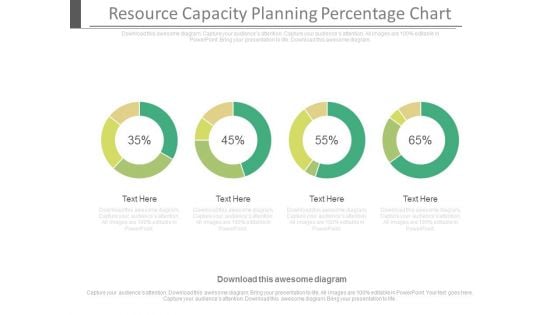
Resource Capacity Planning Percentage Chart Ppt Slides
This is a resource capacity planning percentage chart ppt slides. This is a four stage process. The stages in this process are business, finance, marketing.
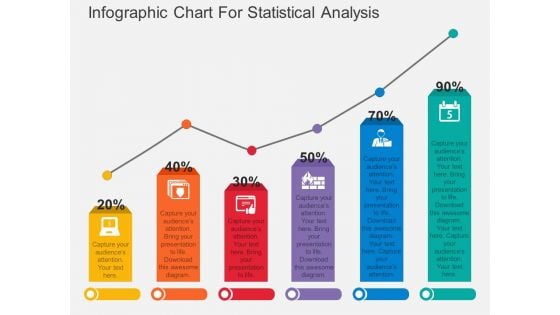
Infographic Chart For Statistical Analysis Powerpoint Template
Download this exclusive business diagram to display statistical analysis. This PowerPoint template contains bar chart with percentage values. This diagram is useful for business presentations.
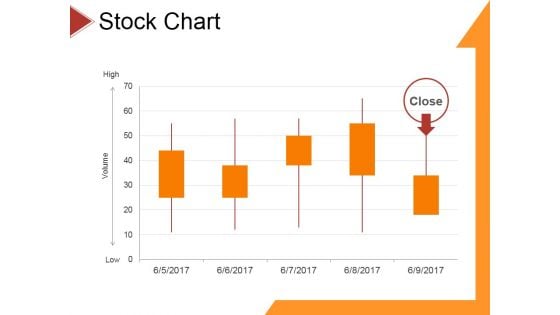
Stock Chart Ppt PowerPoint Presentation File Ideas
This is a stock chart ppt powerpoint presentation file ideas. This is a five stage process. The stages in this process are business, strategy, analysis, pretention, finance.
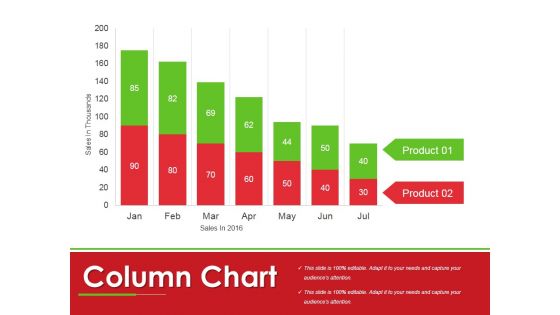
Column Chart Ppt PowerPoint Presentation Show Shapes
This is a column chart ppt powerpoint presentation show shapes. This is a two stage process. The stages in this process are sales, product, business, management, finance.
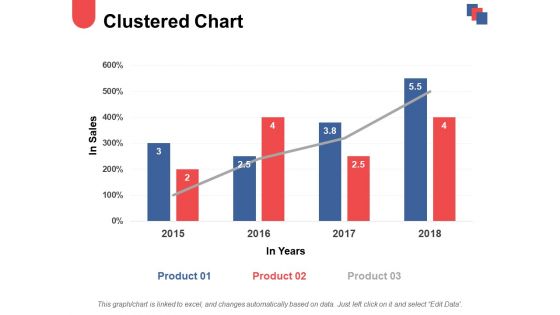
Clustered Chart Ppt PowerPoint Presentation Inspiration Templates
This is a clustered chart ppt powerpoint presentation inspiration templates. This is a three stage process. The stages in this process are finance, marketing, management, investment, analysis.
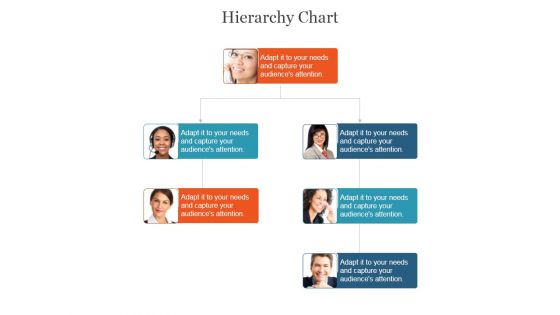
Hierarchy Chart Ppt PowerPoint Presentation Sample
This is a hierarchy chart ppt powerpoint presentation sample. This is a three stage process. The stages in this process are business, marketing, management, strategy, planning.
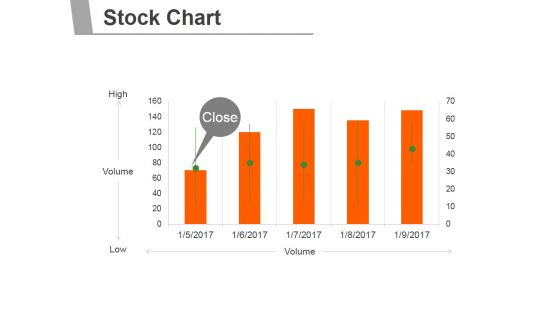
Stock Chart Ppt PowerPoint Presentation Design Templates
This is a stock chart ppt powerpoint presentation design templates. This is a five stage process. The stages in this process are business, marketing, finance, planning, management.
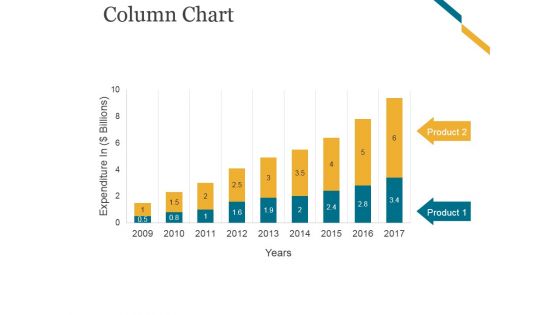
Column Chart Ppt PowerPoint Presentation Graphics
This is a column chart ppt powerpoint presentation graphics. This is a nine stage process. The stages in this process are business, marketing, growth, timeline, planning.
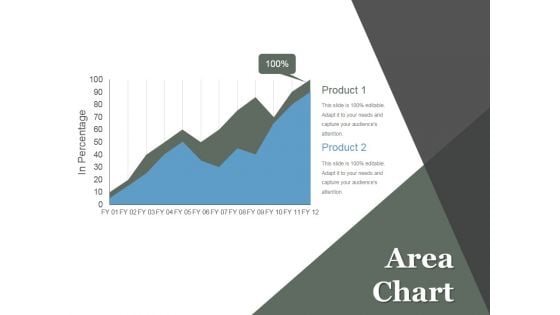
Area Chart Ppt PowerPoint Presentation Example File
This is a area chart ppt powerpoint presentation example file. This is a two stage process. The stages in this process are business, marketing, growth, planning, management.
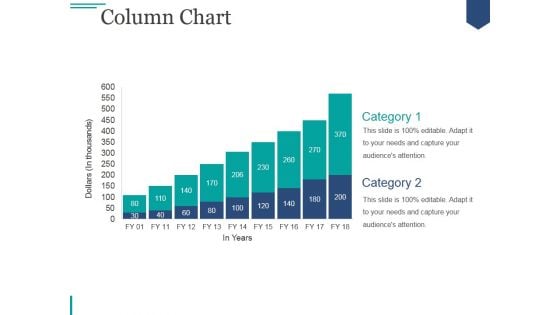
Column Chart Ppt PowerPoint Presentation Visuals
This is a column chart ppt powerpoint presentation visuals. This is a two stage process. The stages in this process are business, marketing, growth, strategy, planning.
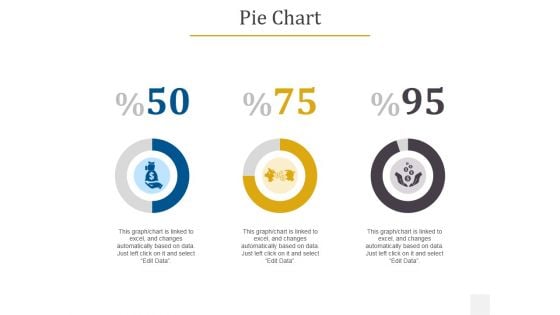
Pie Chart Ppt PowerPoint Presentation Infographics Aids
This is a pie chart ppt powerpoint presentation infographics aids. This is a three stage process. The stages in this process are business, finance, management, strategy, planning.
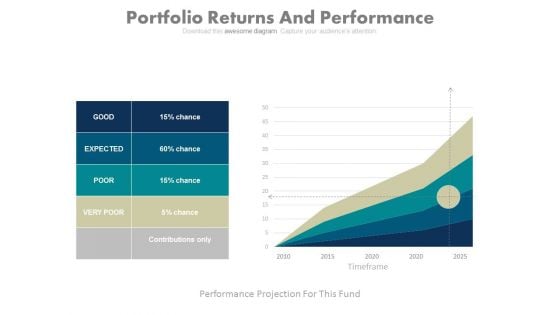
Portfolio Returns And Performance Chart Ppt Slides
This is a portfolio returns and performance chart ppt slides. This is a five stage process. The stages in this process are business, finance, marketing.
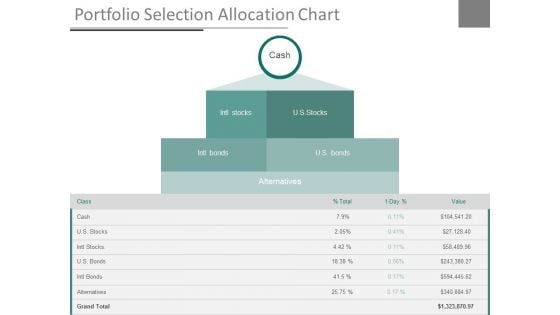
Portfolio Selection Allocation Chart Ppt Slides
This is a portfolio selection allocation chart ppt slides. This is a one stage process. The stages in this process are business, finance, marketing.
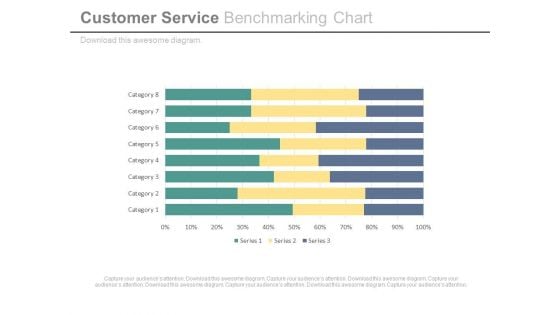
Customer Service Benchmarking Chart Ppt Slides
This is a customer service benchmarking chart ppt slides. This is a eight stage process. The stages in this process are finance, business, marketing.
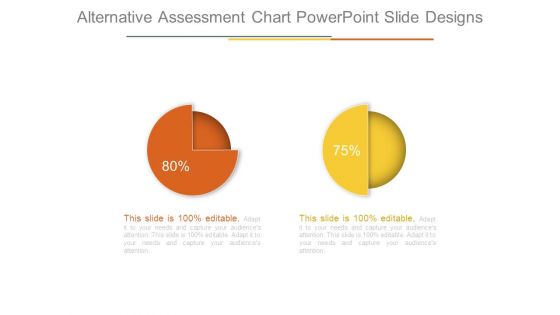
Alternative Assessment Chart Powerpoint Slide Designs
This is a alternative assessment chart powerpoint slide designs. This is a two stage process. The stages in this process are business, marketing, percentage, finance, success.
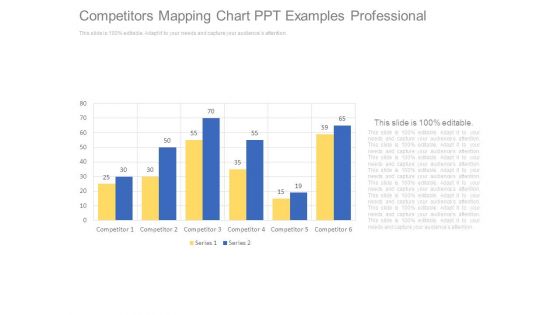
Competitors Mapping Chart Ppt Examples Professional
This is a competitors mapping chart ppt examples professional. This is a six stage process. The stages in this process are competitor, series.
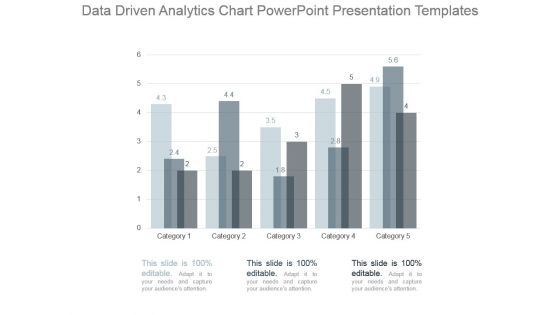
Data Driven Analytics Chart Powerpoint Presentation Templates
This is a data driven analytics chart powerpoint presentation templates. This is a five stage process. The stages in this process are category.


 Continue with Email

 Home
Home


