Revenue Chart
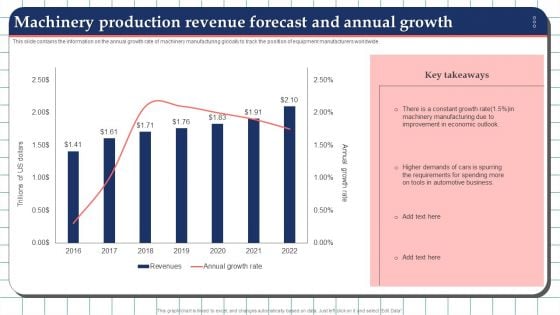
Machinery Production Revenue Forecast And Annual Growth Template PDF
This slide contains the information on the annual growth rate of machinery manufacturing globally to track the position of equipment manufacturers worldwide. Showcasing this set of slides titled Machinery Production Revenue Forecast And Annual Growth Template PDF. The topics addressed in these templates are Manufacturing, Economic, Growth Rate. All the content presented in this PPT design is completely editable. Download it and make adjustments in color, background, font etc. as per your unique business setting.
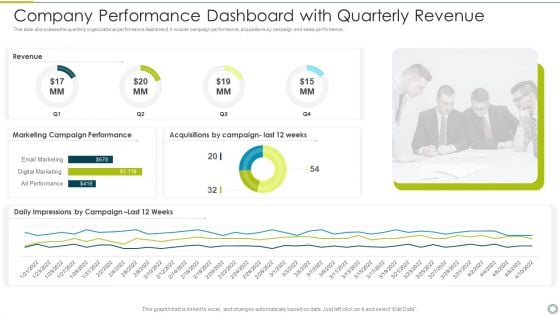
Company Performance Dashboard With Quarterly Revenue Download PDF
This slide showcases the quarterly organizational performance dashboard. It include campaign performance, acquisitions by campaign and sales performance. Showcasing this set of slides titled company performance dashboard with quarterly revenue download pdf. The topics addressed in these templates are marketing, performance. All the content presented in this PPT design is completely editable. Download it and make adjustments in color, background, font etc. as per your unique business setting.
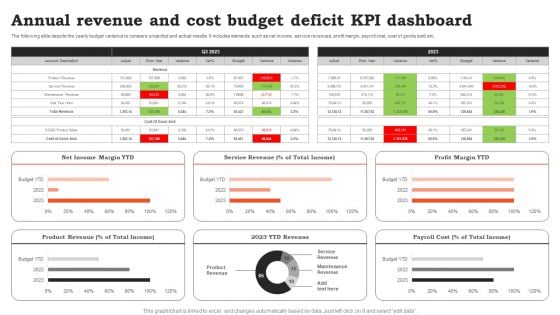
Annual Revenue And Cost Budget Deficit KPI Dashboard Ideas PDF
The following slide depicts the yearly budget variance to compare projected and actual results. It includes elements such as net income, service revenues, profit margin, payroll cost, cost of goods sold etc. Showcasing this set of slides titled Annual Revenue And Cost Budget Deficit KPI Dashboard Ideas PDF. The topics addressed in these templates are Cost Budget, Deficit KPI Dashboard. All the content presented in this PPT design is completely editable. Download it and make adjustments in color, background, font etc. as per your unique business setting.

Monthly Financials Metrics With Revenue And Gross Profit Professional PDF
This slide displays P and L variance analysis to closely monitor key financial parameters of the company. It includes details about sales, discounts allowed, freight income, customer finance charges, etc. Showcasing this set of slides titled Monthly Financials Metrics With Revenue And Gross Profit Professional PDF. The topics addressed in these templates are Amount, Current Month, Profit. All the content presented in this PPT design is completely editable. Download it and make adjustments in color, background, font etc. as per your unique business setting.
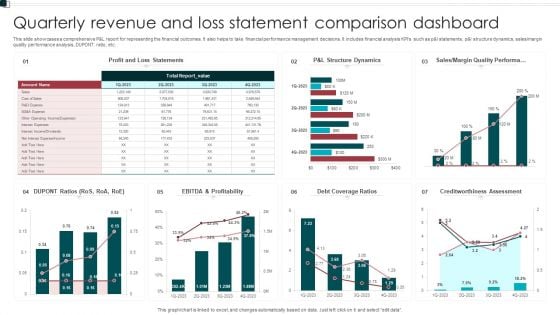
Quarterly Revenue And Loss Statement Comparison Dashboard Portrait PDF
This slide showcases a comprehensive P and L report for representing the financial outcomes. It also helps to take financial performance management decisions. It includes financial analysis KPIs such as p and l statements, p and l structure dynamics, sales or margin quality performance analysis, DUPONT ratio, etc. Showcasing this set of slides titled Quarterly Revenue And Loss Statement Comparison Dashboard Portrait PDF. The topics addressed in these templates are Profitability, Debt Coverage Ratios, Margin Quality Performa. All the content presented in this PPT design is completely editable. Download it and make adjustments in color, background, font etc. as per your unique business setting.
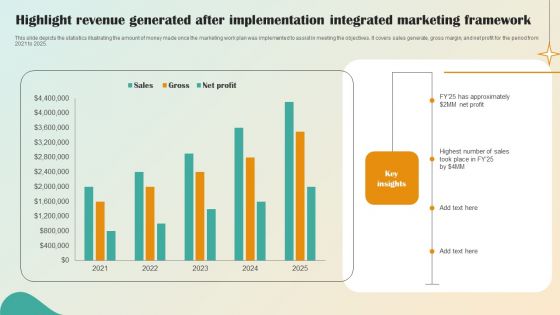
Highlight Revenue Generated After Implementation Integrated Marketing Framework Professional PDF
This slide depicts the statistics illustrating the amount of money made once the marketing work plan was implemented to assist in meeting the objectives. It covers sales generate, gross margin, and net profit for the period from 2021 to 2025.Showcasing this set of slides titled Highlight Revenue Generated After Implementation Integrated Marketing Framework Professional PDF. The topics addressed in these templates are Highest Number, Sales Took. All the content presented in this PPT design is completely editable. Download it and make adjustments in color, background, font etc. as per your unique business setting.
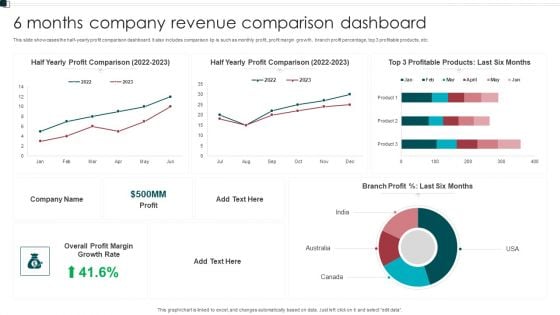
6 Months Company Revenue Comparison Dashboard Graphics PDF
This slide showcases the half yearly profit comparison dashboard. It also includes comparison kp is such as monthly profit, profit margin growth, branch profit percentage, top 3 profitable products, etc. Showcasing this set of slides titled 6 Months Company Revenue Comparison Dashboard Graphics PDF. The topics addressed in these templates are Growth Rate, Overall Profit Margin, Branch Profit. All the content presented in this PPT design is completely editable. Download it and make adjustments in color, background, font etc. as per your unique business setting.
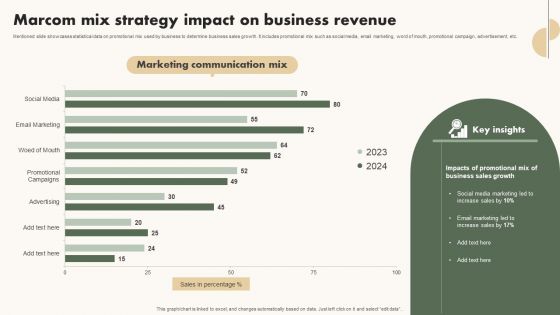
Marcom Mix Strategy Impact On Business Revenue Themes PDF
Mentioned slide showcases statistical data on promotional mix used by business to determine business sales growth. It includes promotional mix such as social media, email marketing, word of mouth, promotional campaign, advertisement, etc. Showcasing this set of slides titled Marcom Mix Strategy Impact On Business Revenue Themes PDF. The topics addressed in these templates are Social Media Marketing Led, Increase Sales, Email Marketing Led. All the content presented in this PPT design is completely editable. Download it and make adjustments in color, background, font etc. as per your unique business setting.
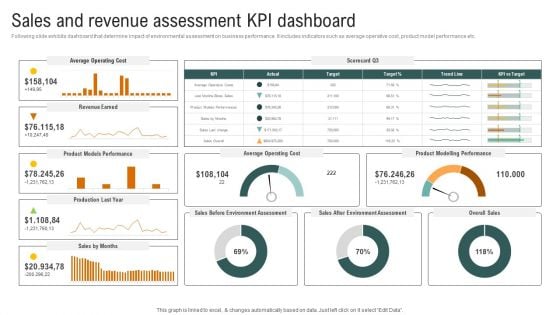
Sales And Revenue Assessment Kpi Dashboard Brochure PDF
Following slide exhibits dashboard that determine impact of environmental assessment on business performance. It includes indicators such as average operative cost, product model performance etc. If your project calls for a presentation, then Slidegeeks is your go-to partner because we have professionally designed, easy-to-edit templates that are perfect for any presentation. After downloading, you can easily edit Sales And Revenue Assessment Kpi Dashboard Brochure PDF and make the changes accordingly. You can rearrange slides or fill them with different images. Check out all the handy templates
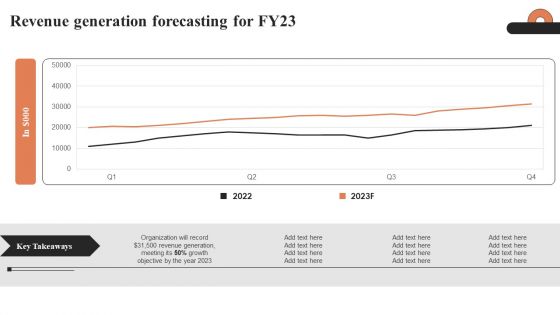
Revenue Generation Forecasting For Fy23 Ppt Portfolio Gallery PDF
Coming up with a presentation necessitates that the majority of the effort goes into the content and the message you intend to convey. The visuals of a PowerPoint presentation can only be effective if it supplements and supports the story that is being told. Keeping this in mind our experts created Revenue Generation Forecasting For Fy23 Ppt Portfolio Gallery PDF to reduce the time that goes into designing the presentation. This way, you can concentrate on the message while our designers take care of providing you with the right template for the situation.
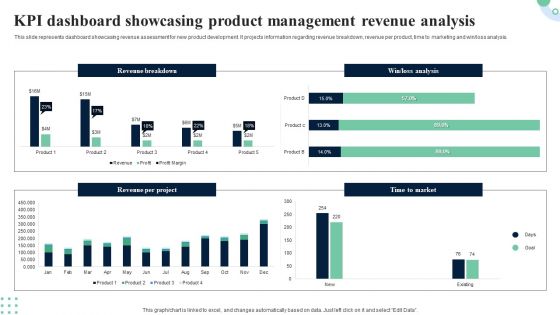
KPI Dashboard Showcasing Product Management Revenue Analysis Portrait PDF
This slide provides dashboard showcasing product development project overview with completion status. It provides information regarding cash flow statements, completion progress, project overview and product approval status. Pitch your topic with ease and precision using this KPI Dashboard Showcasing Product Management Revenue Analysis Portrait PDF. This layout presents information on Completion Progress, Product Approval Status, Cash Flow Statements. It is also available for immediate download and adjustment. So, changes can be made in the color, design, graphics or any other component to create a unique layout.
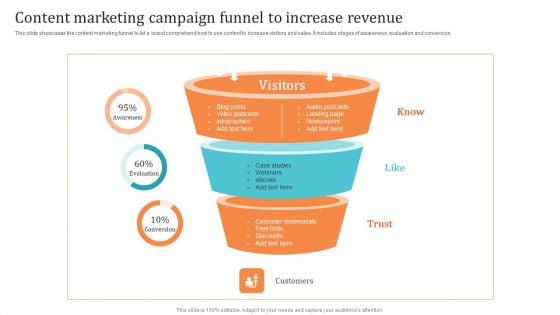
Content Marketing Campaign Funnel To Increase Revenue Themes PDF
This slide showcases the content marketing funnel to let a brand comprehend how to use content to increase visitors and sales. It includes stages of awareness, evaluation and conversion. Present like a pro with Content Marketing Campaign Funnel To Increase Revenue Themes PDF Create beautiful presentations together with your team, using our easy to use presentation slides. Share your ideas in real time and make changes on the fly by downloading our templates. So whether you are in the office, on the go, or in a remote location, you can stay in sync with your team and present your ideas with confidence. With Slidegeeks presentation got a whole lot easier. Grab these presentations today.
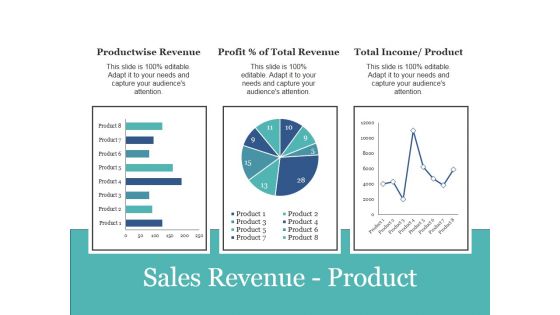
Sales Revenue Product Ppt PowerPoint Presentation Infographic Template Backgrounds
This is a sales revenue product ppt powerpoint presentation infographic template backgrounds. This is a three stage process. The stages in this process are product wise revenue, profit percent of total revenue, total income product.
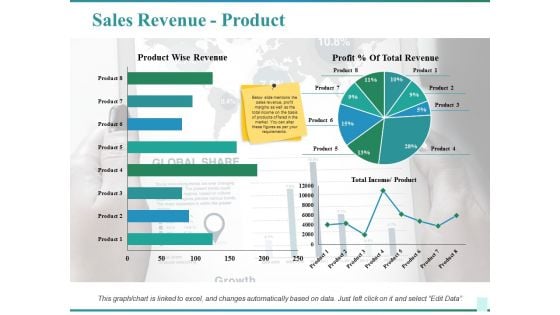
Sales Revenue Product Ppt PowerPoint Presentation Outline Portfolio
This is a sales revenue product ppt powerpoint presentation outline portfolio. This is a three stage process. The stages in this process are total income product, total revenue, product wise revenue, sales, business.
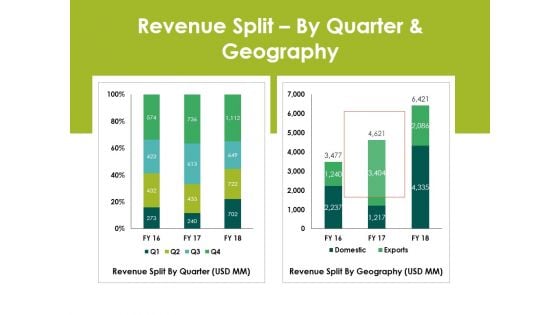
Revenue Splitby Quarter And Geography Ppt PowerPoint Presentation Layout
This is a revenue splitby quarter and geography ppt powerpoint presentation layout. This is a two stage process. The stages in this process are revenue split by quarter, revenue split by geography.
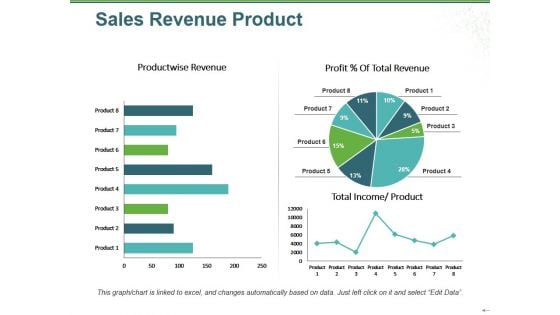
Sales Revenue Product Ppt PowerPoint Presentation Infographic Template Infographic Template
This is a sales revenue product ppt powerpoint presentation infographic template infographic template. This is a three stage process. The stages in this process are product wise revenue, total income, product, profit total revenue, pie.
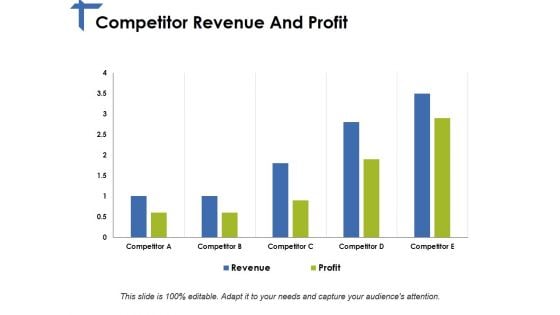
Competitor Revenue And Profit Ppt PowerPoint Presentation Pictures Good
This is a competitor revenue and profit ppt powerpoint presentation pictures good. This is a five stage process. The stages in this process are competitor, revenue, profit.
Competitor Revenue And Profit Ppt PowerPoint Presentation Icon Slide Download
This is a competitor revenue and profit ppt powerpoint presentation icon slide download. This is a five stage process. The stages in this process are revenue, profit, finance, marketing, strategy, analysis, business.
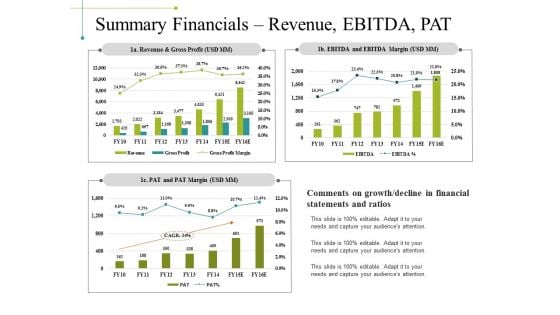
Summary Financials Revenue Ebitda Pat Ppt PowerPoint Presentation Inspiration Templates
This is a summary financials revenue ebitda pat ppt powerpoint presentation inspiration templates. This is a three stage process. The stages in this process are revenue and gross profit, pat and pat margin, ebitda and ebitda margin, business, marketing.
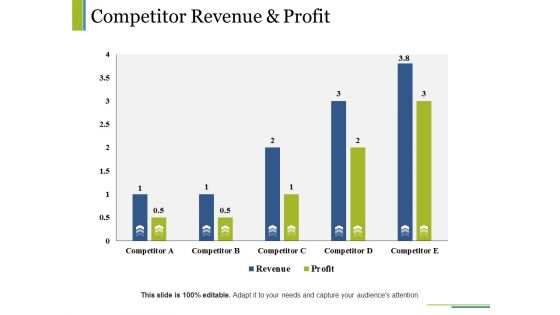
Competitor Revenue And Profit Ppt PowerPoint Presentation Slides Objects
This is a competitor revenue and profit ppt powerpoint presentation slides objects. This is a five stage process. The stages in this process are business, marketing, graph, finance, revenue.
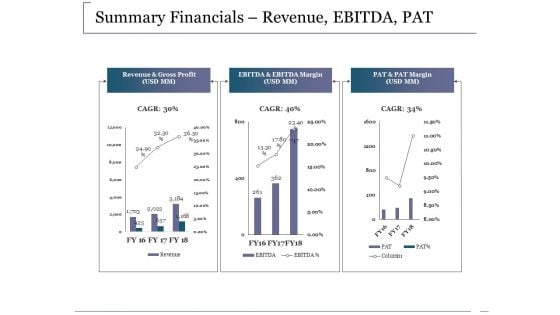
Summary Financials Revenue Ebitda Pat Ppt PowerPoint Presentation Outline Infographics
This is a summary financials revenue ebitda pat ppt powerpoint presentation outline infographics. This is a three stage process. The stages in this process are revenue and gross profit, ebitda and ebitda margin, pat and pat margin, business, marketing.
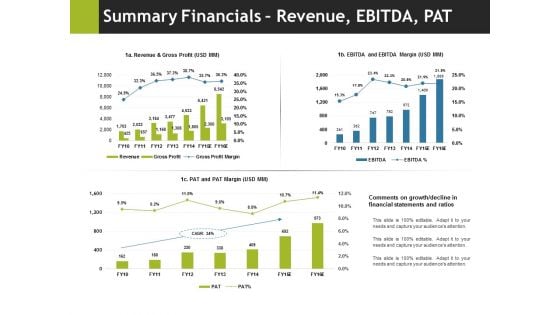
Summary Financials Revenue Ebitda Pat Ppt PowerPoint Presentation Pictures Outline
This is a summary financials revenue ebitda pat ppt powerpoint presentation pictures outline. This is a three stage process. The stages in this process are business, marketing, pat and pat margin, ebitda and ebitda margin, revenue and gross profit.
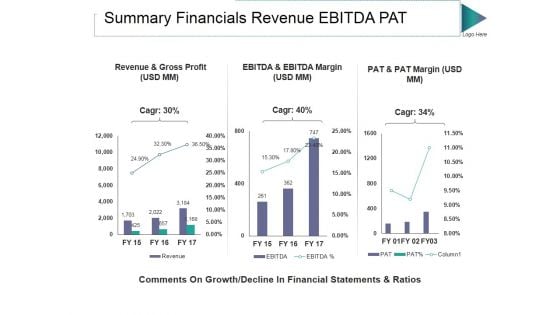
Summary Financials Revenue Ebitda Pat Ppt PowerPoint Presentation Visuals
This is a summary financials revenue ebitda pat ppt powerpoint presentation visuals. This is a three stage process. The stages in this process are revenue and gross profit, pat and pat margin, ebitda and ebitda margin.
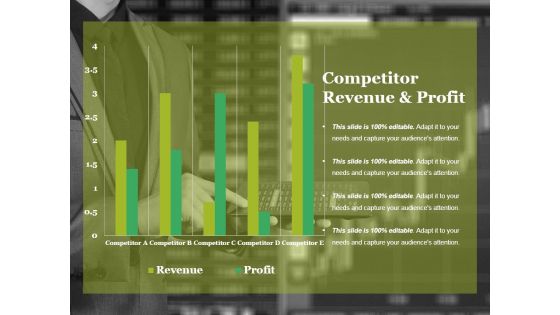
Competitor Revenue And Profit Ppt PowerPoint Presentation Model Templates
This is a competitor revenue and profit ppt powerpoint presentation model templates. This is a five stage process. The stages in this process are revenue, profit, competitor, bar graph, business.
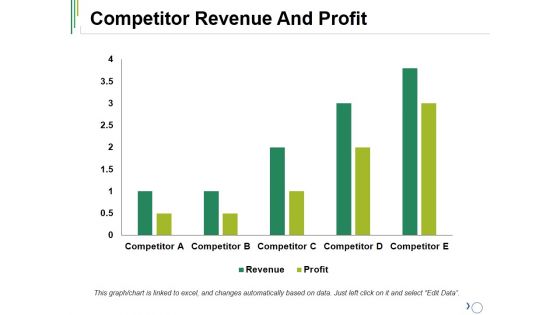
Competitor Revenue And Profit Ppt PowerPoint Presentation Layouts Vector
This is a competitor revenue and profit ppt powerpoint presentation layouts vector. This is a five stage process. The stages in this process are competitor, profit, revenue, bar graph, success.
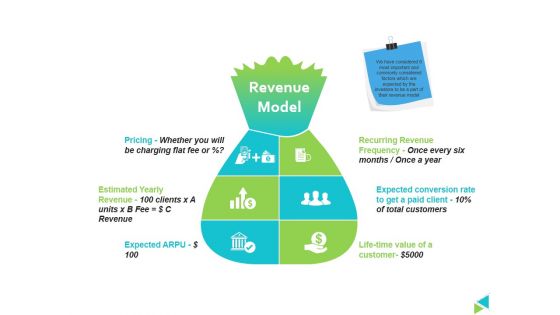
Revenue Model Ppt PowerPoint Presentation File Designs Download
This is a revenue model ppt powerpoint presentation file designs download. This is a six stage process. The stages in this process are pricing, estimated yearly revenue, life time value of a customer, recurring revenue frequency once every six months once a year.
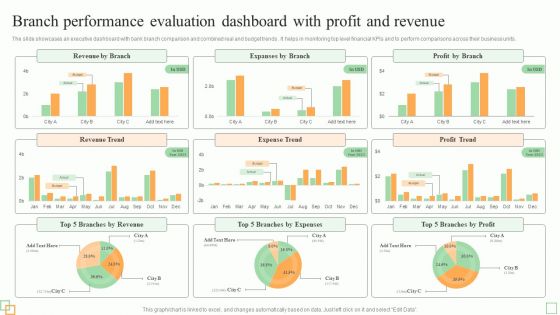
Branch Performance Evaluation Dashboard With Profit And Revenue Diagrams PDF
The slides showcases tips for enhancing branchs workforce performance and efficiency. It covers utilize transaction analysis data, schedule idle time, incent staff for efficiency, get bottom support and use part-time staff.Persuade your audience using this Best Practices To Improve Branch Workforce Performance Evaluation And Efficiency Introduction PDF. This PPT design covers five stages, thus making it a great tool to use. It also caters to a variety of topics including Market Opportunities, Customer Branch, Unnecessary Labor. Download this PPT design now to present a convincing pitch that not only emphasizes the topic but also showcases your presentation skills.
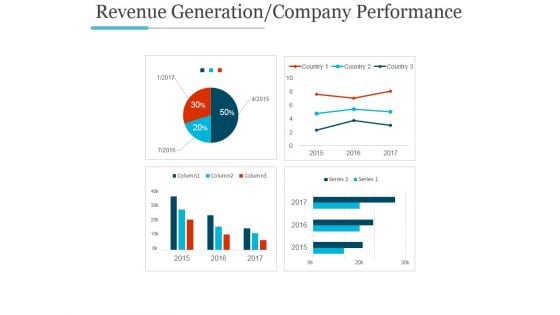
Revenue Generation Company Performance Ppt PowerPoint Presentation Inspiration
This is a revenue generation company performance ppt powerpoint presentation inspiration. This is a four stage process. The stages in this process are graph, growth, success, business, marketing.
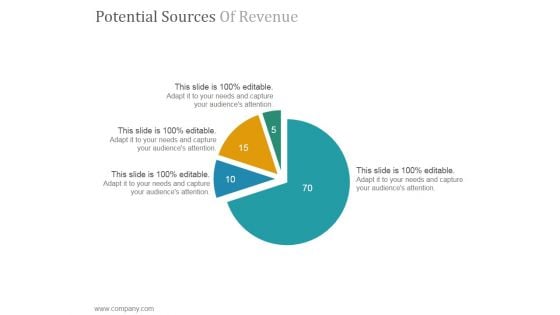
Potential Sources Of Revenue Ppt PowerPoint Presentation Sample
This is a potential sources of revenue ppt powerpoint presentation sample. This is a four stage process. The stages in this process are pie, division, business, market, operation.
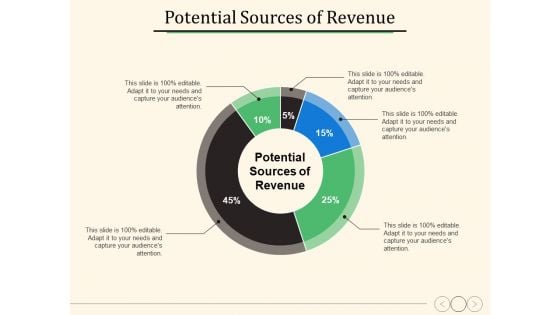
Potential Sources Of Revenue Ppt PowerPoint Presentation Show Information
This is a potential sources of revenue ppt powerpoint presentation show information. This is a five stage process. The stages in this process are percentage, product, management, business.
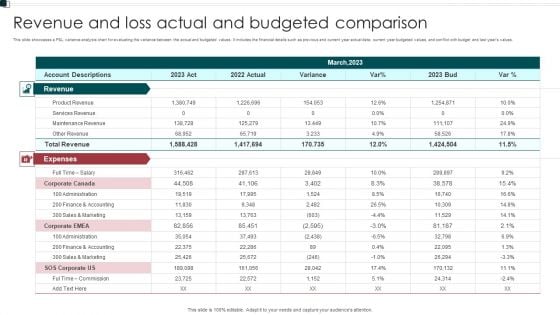
Revenue And Loss Actual And Budgeted Comparison Elements PDF
This slide showcases a P and L variance analysis chart for evaluating the variance between the actual and budgeted values. It includes the financial details such as previous and current year actual data current year budgeted values, and conflict with budget and last years values. Showcasing this set of slides titled Revenue And Loss Actual And Budgeted Comparison Elements PDF. The topics addressed in these templates are Expenses, Administration, Commission. All the content presented in this PPT design is completely editable. Download it and make adjustments in color, background, font etc. as per your unique business setting.
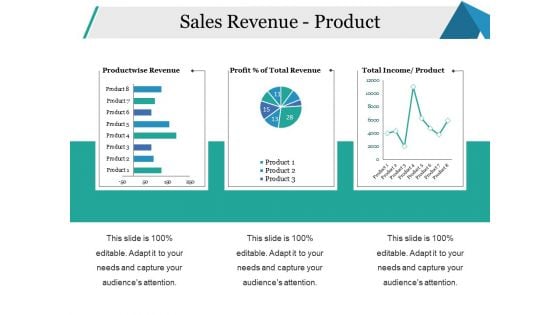
Sales Revenue Product Ppt PowerPoint Presentation Styles Skills
This is a sales revenue product ppt powerpoint presentation styles skills. This is a three stage process. The stages in this process are productwise revenue, income product, business, percentage, strategy.
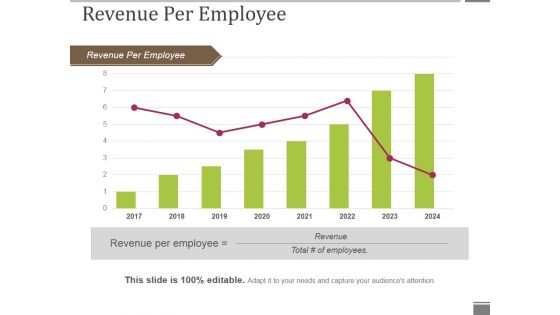
Revenue Per Employee Ppt PowerPoint Presentation Inspiration Objects
This is a revenue per employee ppt powerpoint presentation inspiration objects. This is a eight stage process. The stages in this process are revenue per employee, growth, marketing, business, planning.
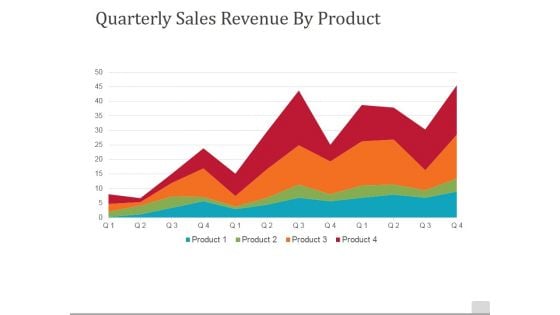
Quarterly Sales Revenue By Product Ppt PowerPoint Presentation File Background
This is a quarterly sales revenue by product ppt powerpoint presentation file background. This is a four stage process. The stages in this process are quarterly, sales revenue by product, business, marketing, success.
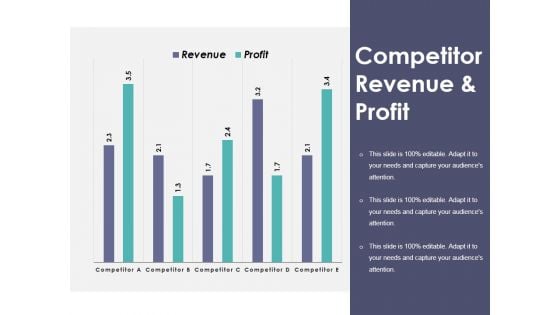
Competitor Revenue And Profit Ppt PowerPoint Presentation Outline Elements
This is a competitor revenue and profit ppt powerpoint presentation outline elements. This is a five stage process. The stages in this process are bar graph, marketing, strategy, finance, planning.
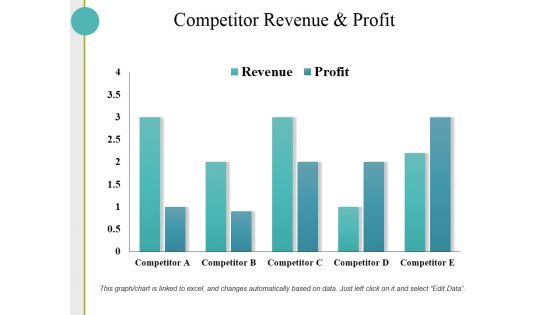
Competitor Revenue And Profit Ppt PowerPoint Presentation Inspiration Slide Portrait
This is a competitor revenue and profit ppt powerpoint presentation inspiration slide portrait. This is a five stage process. The stages in this process are business, finance, analysis, growth, investment.
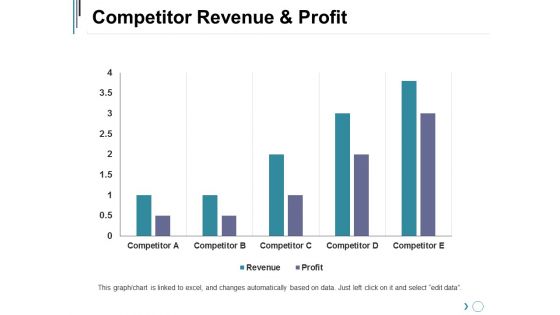
Competitor Revenue And Profit Ppt PowerPoint Presentation Professional Graphics Pictures
This is a competitor revenue and profit ppt powerpoint presentation professional graphics pictures. This is a five stage process. The stages in this process are business, marketing, strategy, graph, finance.
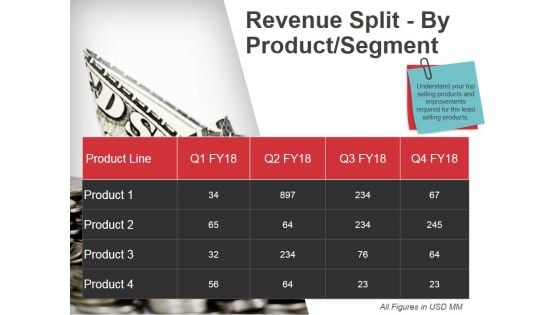
Revenue Split By Product Segment Ppt PowerPoint Presentation Ideas Graphics
This is a revenue split by product segment ppt powerpoint presentation ideas graphics. This is a four stage process. The stages in this process are business, marketing, bar graph, success.
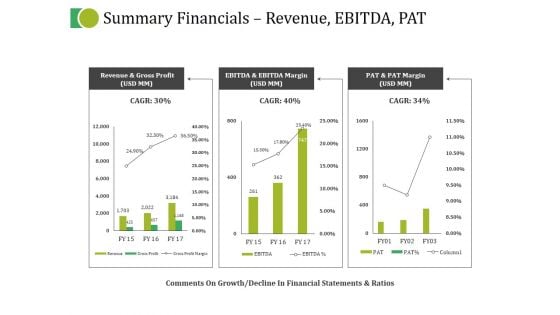
Summary Financials Revenue Ebitda Pat Ppt PowerPoint Presentation Infographics Inspiration
This is a summary financials revenue ebitda pat ppt powerpoint presentation infographics inspiration. This is a three stage process. The stages in this process are business, marketing, strategy, planning, finance.
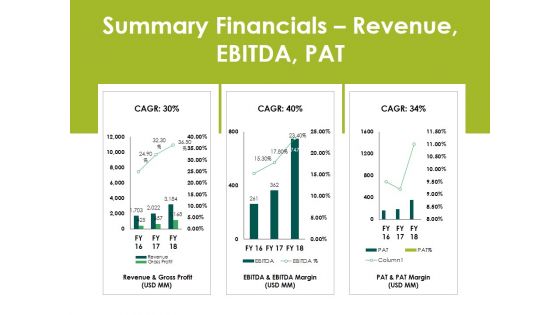
Summary Financials Revenue Ebitda Pat Ppt PowerPoint Presentation Infographics Ideas
This is a summary financials revenue ebitda pat ppt powerpoint presentation infographics ideas. This is a three stage process. The stages in this process are business, finance, analysis, marketing, strategy.
Revenue Generation Company Performance Ppt PowerPoint Presentation Styles Icon
This is a revenue generation company performance ppt powerpoint presentation styles icon. This is a four stage process. The stages in this process are business, marketing, success, financials, management.
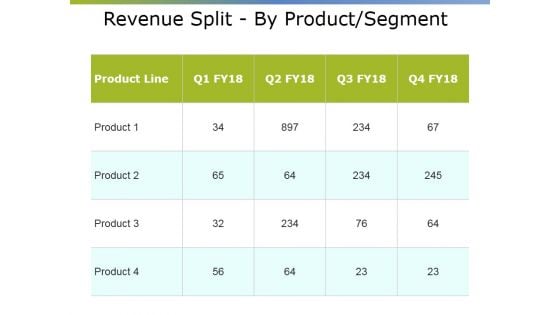
Revenue Split By Product Segment Ppt PowerPoint Presentation Styles Elements
This is a revenue split by product segment ppt powerpoint presentation styles elements. This is a four stage process. The stages in this process are business, marketing, planning, finance, strategy.
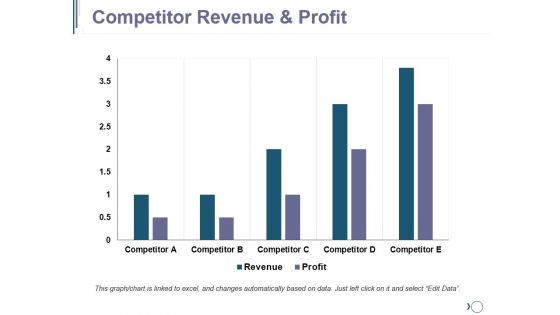
Competitor Revenue And Profit Ppt PowerPoint Presentation Pictures Background Images
This is a competitor revenue and profit ppt powerpoint presentation pictures background images. This is a five stage process. The stages in this process are business, marketing, strategy, planning, finance.
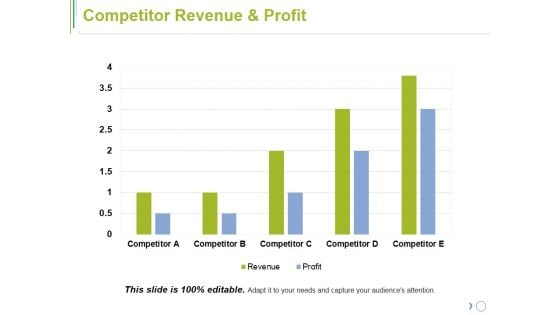
Competitor Revenue And Profit Ppt PowerPoint Presentation Slides Influencers
This is a competitor revenue and profit ppt powerpoint presentation slides influencers. This is a five stage process. The stages in this process are business, marketing, strategy, planning, growth.
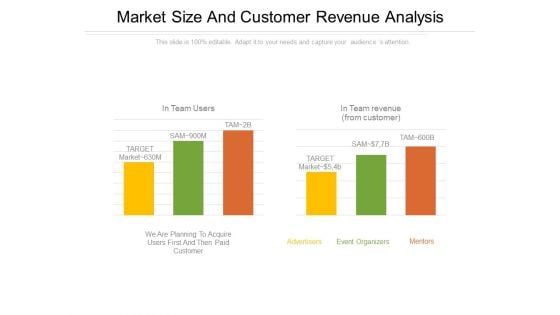
Market Size And Customer Revenue Analysis PowerPoint Presentation Examples
This is a market size and customer revenue analysis powerpoint presentation examples. This is a two stage process. The stages in this process are advertisers, mentors, event organizers, target, in team users.
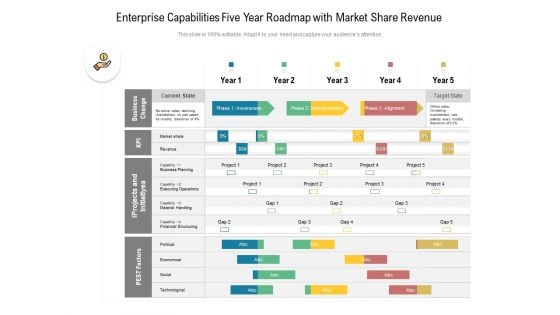
Enterprise Capabilities Five Year Roadmap With Market Share Revenue Pictures
We present our enterprise capabilities five year roadmap with market share revenue pictures. This PowerPoint layout is easy-to-edit so you can change the font size, font type, color, and shape conveniently. In addition to this, the PowerPoint layout is Google Slides compatible, so you can share it with your audience and give them access to edit it. Therefore, download and save this well-researched enterprise capabilities five year roadmap with market share revenue pictures in different formats like PDF, PNG, and JPG to smoothly execute your business plan.

Improving Business Revenue Bar Graph Ppt PowerPoint Presentation Infographic Template
This is a improving business revenue bar graph ppt powerpoint presentation infographic template. This is a six stage process. The stages in this process are graph, arrow, finance, percentage, success.
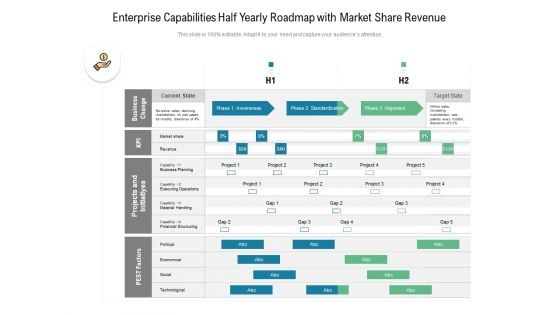
Enterprise Capabilities Half Yearly Roadmap With Market Share Revenue Microsoft
Presenting our innovatively-structured enterprise capabilities half yearly roadmap with market share revenue microsoft Template. Showcase your roadmap process in different formats like PDF, PNG, and JPG by clicking the download button below. This PPT design is available in both Standard Screen and Widescreen aspect ratios. It can also be easily personalized and presented with modified font size, font type, color, and shapes to measure your progress in a clear way.
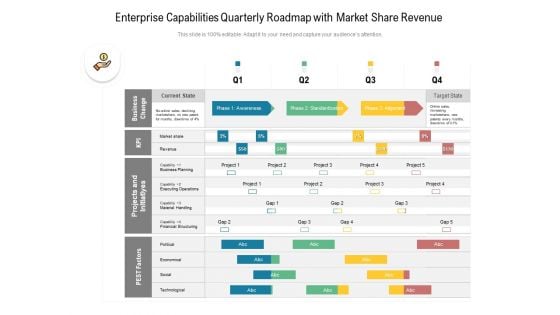
Enterprise Capabilities Quarterly Roadmap With Market Share Revenue Information
Introducing our enterprise capabilities quarterly roadmap with market share revenue information. This PPT presentation is Google Slides compatible, therefore, you can share it easily with the collaborators for measuring the progress. Also, the presentation is available in both standard screen and widescreen aspect ratios. So edit the template design by modifying the font size, font type, color, and shapes as per your requirements. As this PPT design is fully editable it can be presented in PDF, JPG and PNG formats.

Enterprise Capabilities Three Months Roadmap With Market Share Revenue Topics
Presenting our jaw-dropping enterprise capabilities three months roadmap with market share revenue topics. You can alternate the color, font size, font type, and shapes of this PPT layout according to your strategic process. This PPT presentation is compatible with Google Slides and is available in both standard screen and widescreen aspect ratios. You can also download this well-researched PowerPoint template design in different formats like PDF, JPG, and PNG. So utilize this visually-appealing design by clicking the download button given below.

Quarterly Effective Business Data Governance Execution Roadmap For Revenue Designs
Introducing our quarterly effective business data governance execution roadmap for revenue designs. This PPT presentation is Google Slides compatible, therefore, you can share it easily with the collaborators for measuring the progress. Also, the presentation is available in both standard screen and widescreen aspect ratios. So edit the template design by modifying the font size, font type, color, and shapes as per your requirements. As this PPT design is fully editable it can be presented in PDF, JPG and PNG formats.
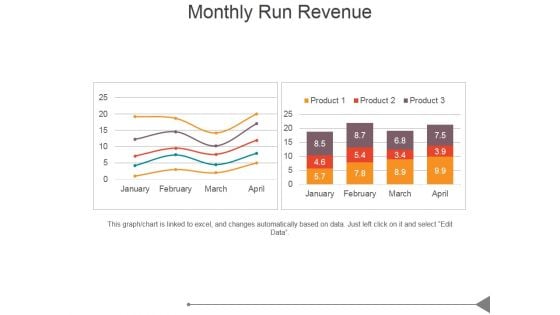
Monthly Run Revenue Ppt PowerPoint Presentation Design Ideas
This is a monthly run revenue ppt powerpoint presentation design ideas. This is a two stage process. The stages in this process are business, marketing, success, bar graph, growth.
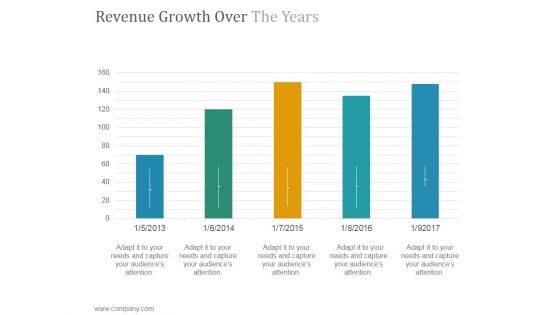
Revenue Growth Over The Years Ppt PowerPoint Presentation Example 2015
This is a revenue growth over the years ppt powerpoint presentation example 2015. This is a five stage process. The stages in this process are success, product, growth, graph, business.
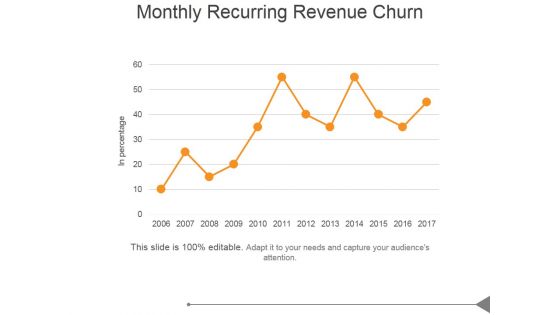
Monthly Recurring Revenue Churn Ppt PowerPoint Presentation Images
This is a monthly recurring revenue churn ppt powerpoint presentation images. This is a five stage process. The stages in this process are business, marketing, success, bar graph, growth.
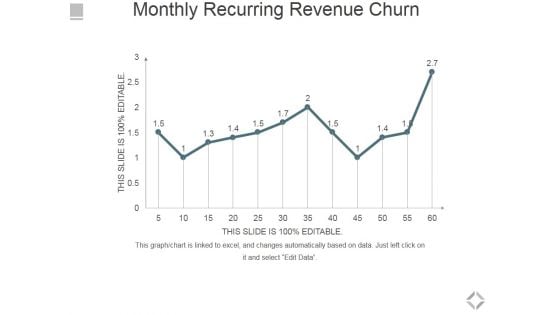
Monthly Recurring Revenue Churn Ppt PowerPoint Presentation Infographics Microsoft
This is a monthly recurring revenue churn ppt powerpoint presentation infographics microsoft. This is a one stage process. The stages in this process are bar graph, business, marketing, success, growth.
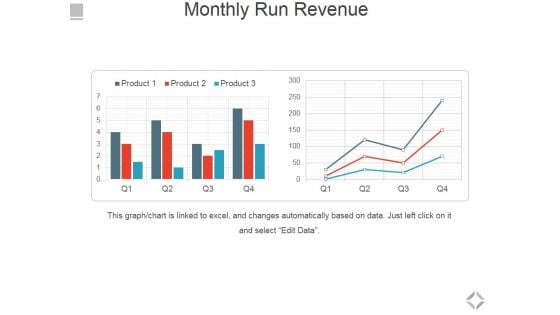
Monthly Run Revenue Ppt PowerPoint Presentation Show Styles
This is a monthly run revenue ppt powerpoint presentation show styles. This is a two stage process. The stages in this process are bar graph, business, marketing, success, growth.
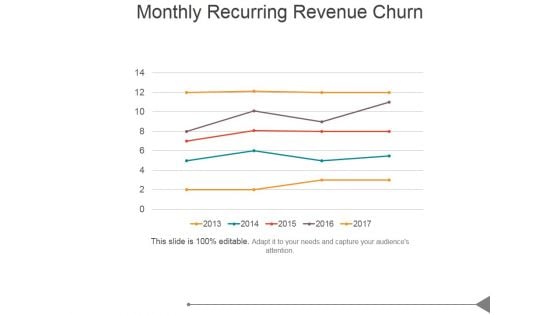
Monthly Recurring Revenue Churn Template 1 Ppt PowerPoint Presentation Clipart
This is a monthly recurring revenue churn template 1 ppt powerpoint presentation clipart. This is a one stage process. The stages in this process are business, marketing, success, in percentage, growth.
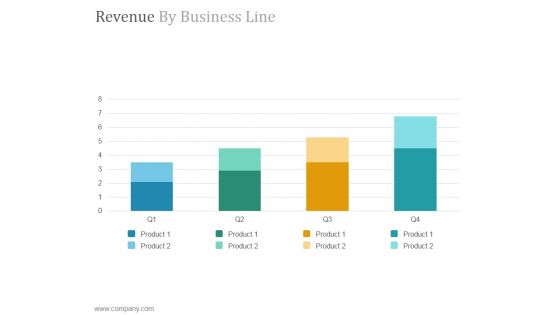
Revenue By Business Line Ppt PowerPoint Presentation Example File
This is a revenue by business line ppt powerpoint presentation example file. This is a four stage process. The stages in this process are product, growth, graph, business, success.
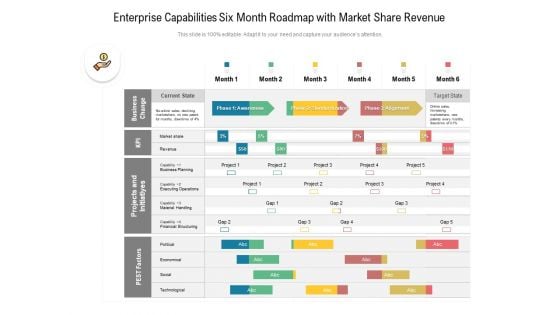
Enterprise Capabilities Six Month Roadmap With Market Share Revenue Template
Presenting the enterprise capabilities six month roadmap with market share revenue template. The template includes a roadmap that can be used to initiate a strategic plan. Not only this, the PowerPoint slideshow is completely editable and you can effortlessly modify the font size, font type, and shapes according to your needs. This PPT slide can be easily reached in standard screen and widescreen aspect ratios. The set is also available in various formats like PDF, PNG, and JPG. So download and use it multiple times as per your knowledge.
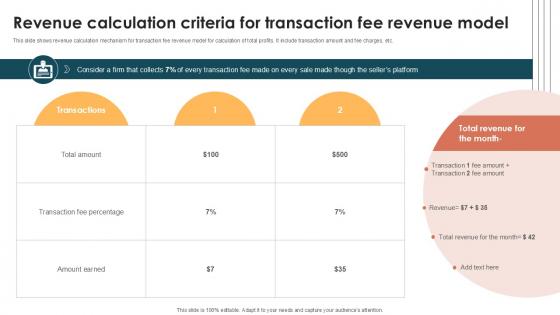
Revenue Calculation Criteria For Internet Based Trade Structure Ppt Template
This slide shows revenue calculation mechanism for transaction fee revenue model for calculation of total profits. It include transaction amount and fee charges, etc. If you are looking for a format to display your unique thoughts, then the professionally designed Revenue Calculation Criteria For Internet Based Trade Structure Ppt Template is the one for you. You can use it as a Google Slides template or a PowerPoint template. Incorporate impressive visuals, symbols, images, and other charts. Modify or reorganize the text boxes as you desire. Experiment with shade schemes and font pairings. Alter, share or cooperate with other people on your work. Download Revenue Calculation Criteria For Internet Based Trade Structure Ppt Template and find out how to give a successful presentation. Present a perfect display to your team and make your presentation unforgettable. This slide shows revenue calculation mechanism for transaction fee revenue model for calculation of total profits. It include transaction amount and fee charges, etc.


 Continue with Email

 Home
Home


