Revenue Chart
Volume Open High Low Close Chart Ppt PowerPoint Presentation Icon Design Inspiration
This is a volume open high low close chart ppt powerpoint presentation icon design inspiration. This is a three stage process. The stages in this process are close, high, low, volume, open.
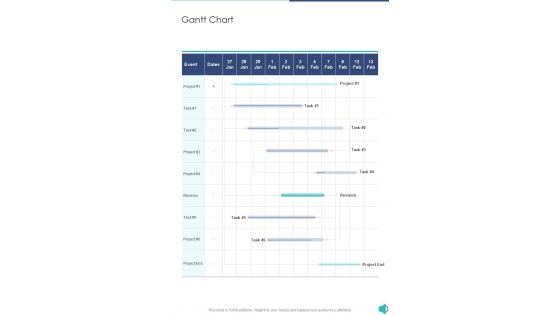
Audiocast Capital Raising Proposal Template Gantt Chart One Pager Sample Example Document
Presenting you an exemplary Audiocast Capital Raising Proposal Template Gantt Chart One Pager Sample Example Document. Our one-pager comprises all the must-have essentials of an inclusive document. You can edit it with ease, as its layout is completely editable. With such freedom, you can tweak its design and other elements to your requirements. Download this Audiocast Capital Raising Proposal Template Gantt Chart One Pager Sample Example Document brilliant piece now.
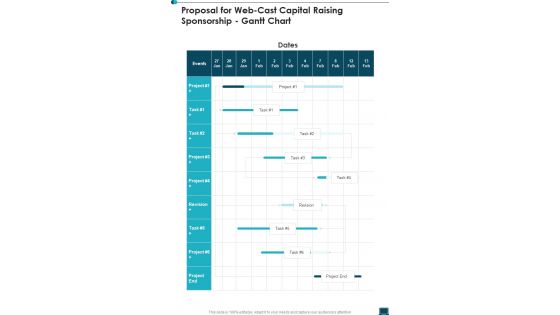
Proposal For Web Cast Capital Raising Sponsorship Gantt Chart One Pager Sample Example Document
Presenting you an exemplary Proposal For Web Cast Capital Raising Sponsorship Gantt Chart One Pager Sample Example Document. Our one-pager comprises all the must-have essentials of an inclusive document. You can edit it with ease, as its layout is completely editable. With such freedom, you can tweak its design and other elements to your requirements. Download this Proposal For Web Cast Capital Raising Sponsorship Gantt Chart One Pager Sample Example Document brilliant piece now.
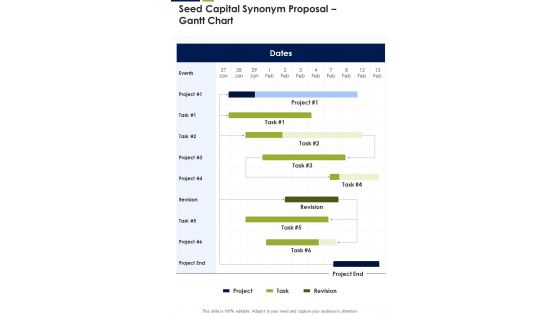
Seed Capital Synonym Proposal Gantt Chart One Pager Sample Example Document
Presenting you an exemplary Seed Capital Synonym Proposal Gantt Chart One Pager Sample Example Document. Our one-pager comprises all the must-have essentials of an inclusive document. You can edit it with ease, as its layout is completely editable. With such freedom, you can tweak its design and other elements to your requirements. Download this Seed Capital Synonym Proposal Gantt Chart One Pager Sample Example Document brilliant piece now.
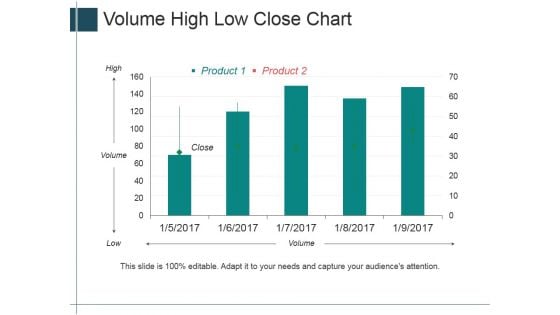
Volume High Low Close Chart Ppt PowerPoint Presentation Summary Layout Ideas
This is a volume high low close chart ppt powerpoint presentation summary layout ideas. This is a five stage process. The stages in this process are high, volume, low, close, product.
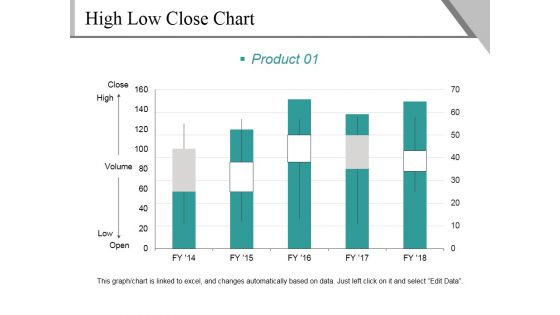
High Low Close Chart Template 1 Ppt PowerPoint Presentation Infographics Graphics Design
This is a high low close chart template 1 ppt powerpoint presentation infographics graphics design. This is a five stage process. The stages in this process are close, high, volume, low, open, product.
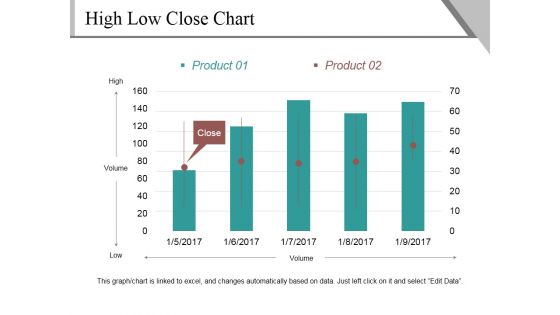
High Low Close Chart Template 2 Ppt PowerPoint Presentation Outline Show
This is a high low close chart template 2 ppt powerpoint presentation outline show. This is a five stage process. The stages in this process are high, volume, low, close, product.
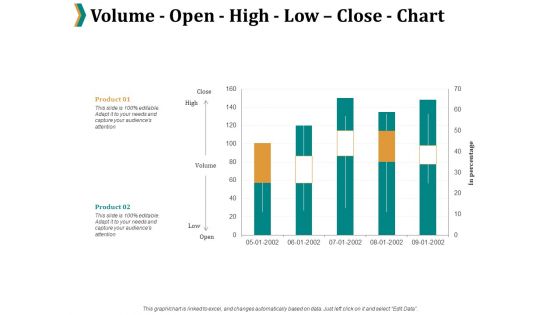
Volume Open High Low Close Chart Ppt PowerPoint Presentation Professional Maker
This is a volume open high low close chart ppt powerpoint presentation professional maker. This is a two stage process. The stages in this process are percentage, product, marketing.
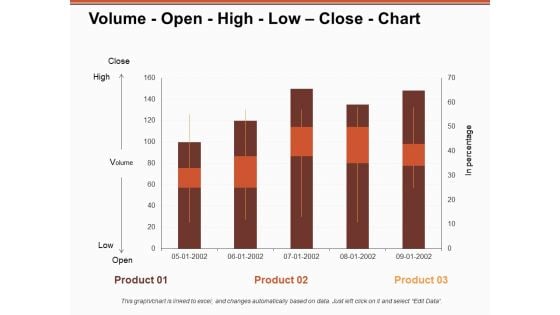
Volume Open High Low Close Chart Ppt PowerPoint Presentation Model Inspiration
This is a volume open high low close chart ppt powerpoint presentation model inspiration. This is a three stage process. The stages in this process are business, management, strategy, marketing, sales.
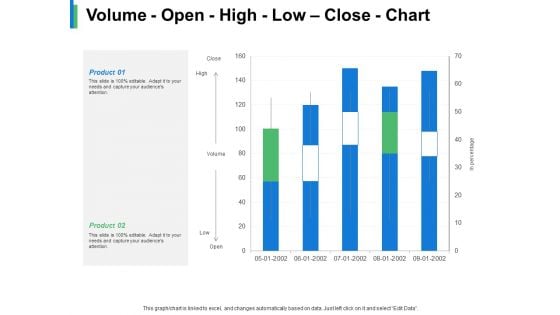
Volume Open High Low Close Chart Product Ppt PowerPoint Presentation Gallery Example
This is a volume open high low close chart product ppt powerpoint presentation gallery example. This is a two stage process. The stages in this process are business, management, strategy, marketing, sales.
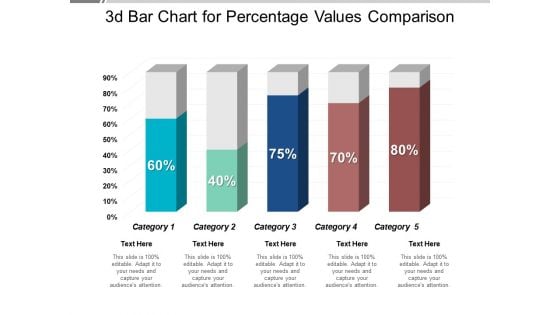
3D Bar Chart For Percentage Values Comparison Ppt PowerPoint Presentation Professional Visual Aids
This is a 3d bar chart for percentage values comparison ppt powerpoint presentation professional visual aids. This is a five stage process. The stages in this process are art, colouring, paint brush.

Column Chart Employee Value Proposition Ppt PowerPoint Presentation Slides Graphics Design
This is a column chart employee value proposition ppt powerpoint presentation slides graphics design. This is a two stage process. The stages in this process are business, management, strategy, analysis, marketing.
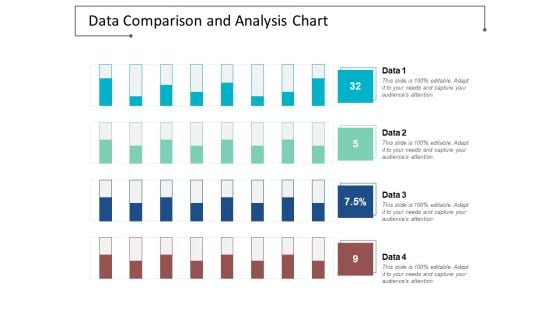
Data Comparison And Analysis Chart Ppt Powerpoint Presentation File Background Images
This is a data comparison and analysis chart ppt powerpoint presentation file background images. This is a four stage process. The stages in this process are data presentation, content presentation, information presentation.
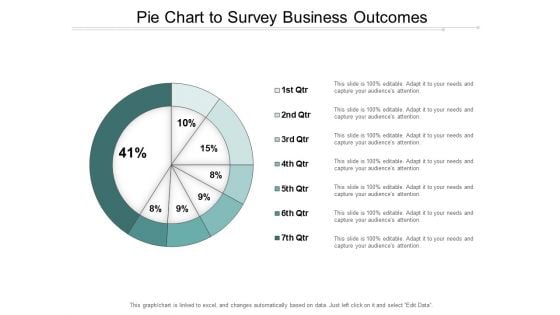
Pie Chart To Survey Business Outcomes Ppt Powerpoint Presentation Infographic Template Gridlines
This is a pie chart to survey business outcomes ppt powerpoint presentation infographic template gridlines. This is a seven stage process. The stages in this process are business outcomes, business results, business output.
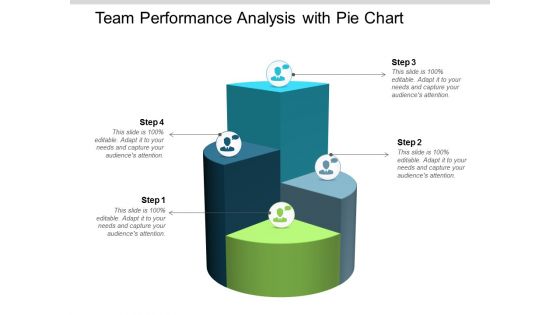
Team Performance Analysis With Pie Chart Ppt Powerpoint Presentation Infographic Template Slideshow
This is a team performance analysis with pie chart ppt powerpoint presentation infographic template slideshow. This is a four stage process. The stages in this process are team performance, member performance, group performance.
Business Diagram Pie Chart With Icons For Financial Analysis Presentation Template
This professional business diagram slide has been designed with pie chart and icons. It contains concept of financial analysis. Use this slide to build exclusive presentations for your viewers.
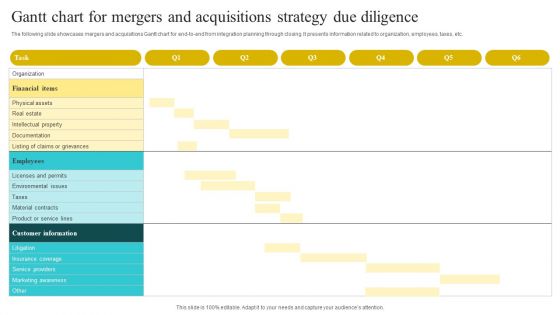
Gantt Chart For Mergers And Acquisitions Strategy Due Diligence Brochure PDF
The following slide showcases mergers and acquisitions Gantt chart for end-to-end from integration planning through closing. It presents information related to organization, employees, taxes, etc. Showcasing this set of slides titled Gantt Chart For Mergers And Acquisitions Strategy Due Diligence Brochure PDF. The topics addressed in these templates are Organization, Financial Items, Employees. All the content presented in this PPT design is completely editable. Download it and make adjustments in color, background, font etc. as per your unique business setting.
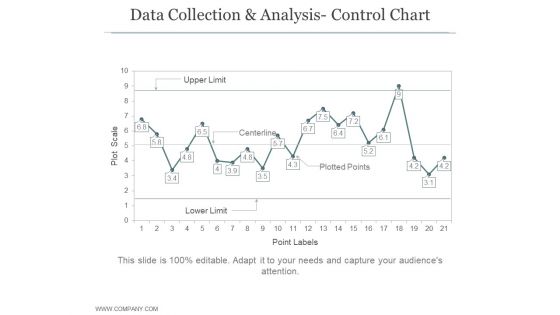
Data Collection And Analysis Control Chart Ppt PowerPoint Presentation Example File
This is a data collection and analysis control chart ppt powerpoint presentation example file. This is a four stage process. The stages in this process are business, strategy, marketing, bar graph, growth strategy.

Bar Chart For Business Growth PowerPoint Templates Ppt Backgrounds For Slides 0513
Get the doers into action. Activate them with our Bar Chart For Business Growth PowerPoint Templates PPT Backgrounds For Slides. Put your money on our business PowerPoint Templates. Your ideas will rake in the dollars. Put in a dollop of our marketing PowerPoint Templates. Give your thoughts a distinctive flavour. Fence in problems with our Bar Chart For Business Growth PowerPoint Templates Ppt Backgrounds For Slides 0513. Try us out and see what a difference our templates make.
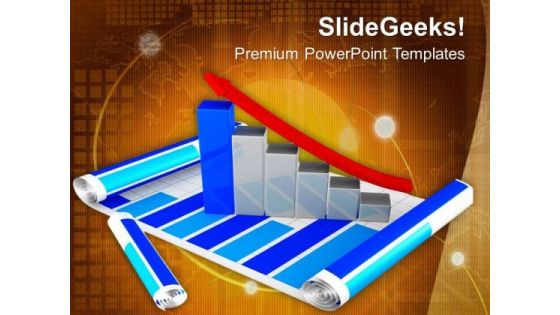
Business Bar Chart Finance And Growth PowerPoint Templates Ppt Backgrounds For Slides 0513
Establish your dominion with our Business Bar Chart Finance And Growth PowerPoint Templates PPT Backgrounds For Slides. Rule the stage with your thoughts. Your ideas demand attention. Our arrows powerpoint templates will get it done. Your listeners will never doodle. Our business powerpoint templates will hold their concentration. Detail goals with our Business Bar Chart Finance And Growth PowerPoint Templates Ppt Backgrounds For Slides 0513. Download without worries with our money back guaranteee.
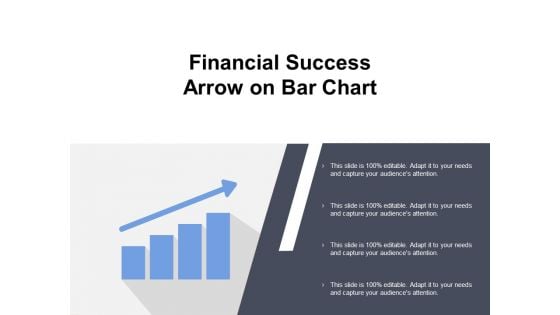
Financial Success Arrow On Bar Chart Ppt PowerPoint Presentation Ideas Display
This is a financial success arrow on bar chart ppt powerpoint presentation ideas display. This is a four stage process. The stages in this process are rising arrow, growing arrow, increasing arrow.
Clustered Bar Chart Yearly Operating Plan Ppt PowerPoint Presentation Styles Icon
This is a clustered bar chart yearly operating plan ppt powerpoint presentation styles icon. This is a four stage process. The stages in this process are business, management, strategy, analysis, marketing.
Competitive Analysis Template 6 Scatter Chart Ppt PowerPoint Presentation Icon Example Topics
This is a competitive analysis template 6 scatter chart ppt powerpoint presentation icon example topics. This is a eight stage process. The stages in this process are users interface, data import, example, pricing, support, update, tutorials, easy to use.
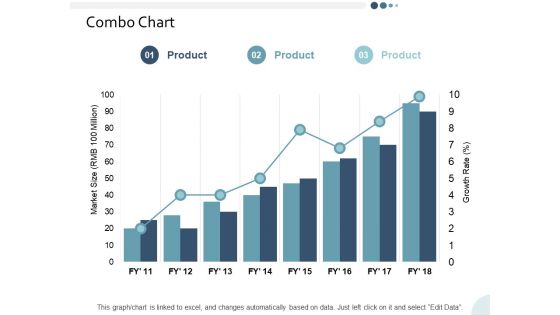
Combo Chart Yearly Operating Plan Ppt PowerPoint Presentation Infographic Template Skills
This is a combo chart yearly operating plan ppt powerpoint presentation infographic template skills. This is a three stage process. The stages in this process are business, management, strategy, analysis, marketing.
Chart With Magnifying Glass For Business Research Ppt PowerPoint Presentation Inspiration Shapes
This is a chart with magnifying glass for business research ppt powerpoint presentation inspiration shapes. This is a two stage process. The stages in this process are metrics icon, kpis icon, statistics icon.
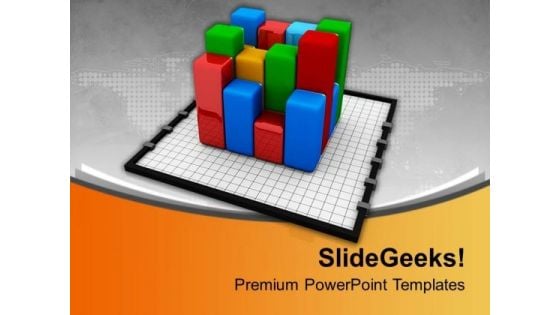
Bar Graph On Chart Marketing PowerPoint Templates Ppt Backgrounds For Slides 0213
We present our Bar Graph On Chart Marketing PowerPoint Templates PPT Backgrounds For Slides 0213.Use our Marketing PowerPoint Templates because Our PowerPoint Templates and Slides ensures Effective communication. They help you put across your views with precision and clarity. Download our Success PowerPoint Templates because Our PowerPoint Templates and Slides offer you the needful to organise your thoughts. Use them to list out your views in a logical sequence. Use our Business PowerPoint Templates because Our PowerPoint Templates and Slides will definately Enhance the stature of your presentation. Adorn the beauty of your thoughts with their colourful backgrounds. Present our Money PowerPoint Templates because Our PowerPoint Templates and Slides are created by a hardworking bunch of busybees. Always flitting around with solutions gauranteed to please. Present our Finance PowerPoint Templates because Our PowerPoint Templates and Slides have the Brilliant backdrops. Guaranteed to illuminate the minds of your audience.Use these PowerPoint slides for presentations relating to Marketing bar graph chart, finance, marketing, success, business, money. The prominent colors used in the PowerPoint template are Green, Blue, Red. Analyse the figures with our Bar Graph On Chart Marketing PowerPoint Templates Ppt Backgrounds For Slides 0213. You will find answers emerging.
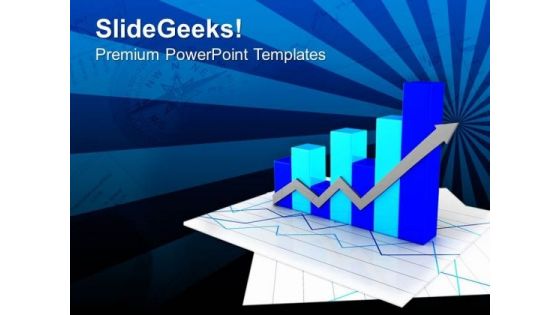
Business Chart Bar Graph PowerPoint Templates Ppt Backgrounds For Slides 0513
Doll up your thoughts with our Business Chart Bar Graph PowerPoint Templates PPT Backgrounds For Slides. They will make a pretty picture. They say a dog is man's best friend. Our Marketing PowerPoint Templates come a close second. Establish the dominance of your ideas. Our ArrowsPowerPoint Templates will put them on top. Earn the esteem of your colleagues with our Business Chart Bar Graph PowerPoint Templates Ppt Backgrounds For Slides 0513. Give your thoughts that something special.
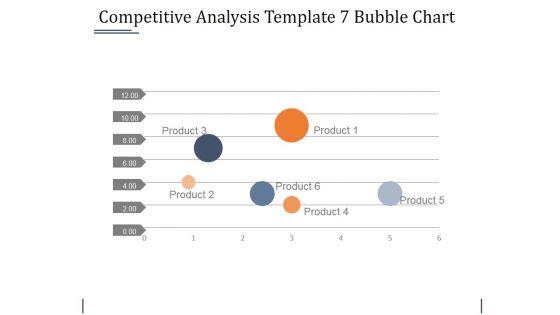
Competitive Analysis Template 7 Bubble Chart Ppt PowerPoint Presentation Summary Guidelines
This is a competitive analysis template 7 bubble chart ppt powerpoint presentation summary guidelines. This is a six stage process. The stages in this process are business, bubble, management, strategy, marketing.
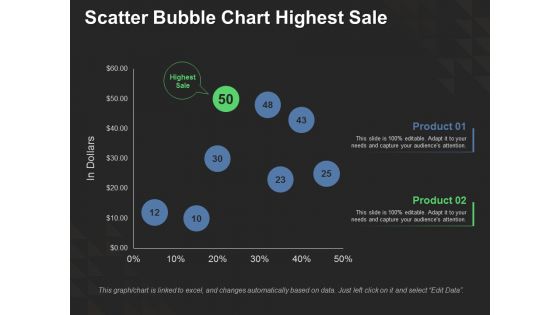
Scatter Bubble Chart Highest Sale Ppt PowerPoint Presentation Show Slide Download
This is a scatter bubble chart highest sale ppt powerpoint presentation show slide download. This is a two stage process. The stages in this process are finance, investment, analysis, business, marketing.
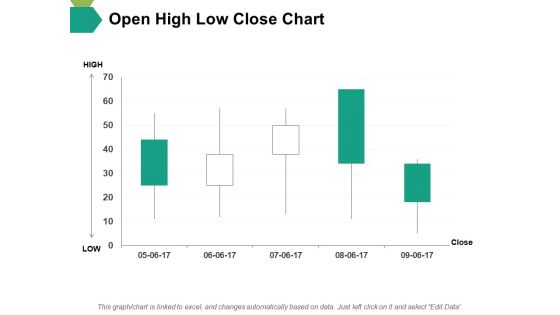
Open High Low Close Chart Ppt PowerPoint Presentation Slides File Formats
This is a open high low close chart ppt powerpoint presentation slides file formats. This is a five stage process. The stages in this process are open, high, low, close, finance.
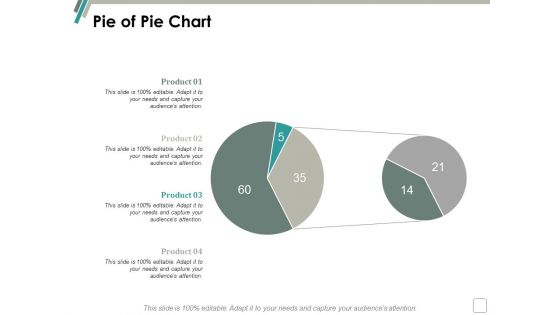
Pie Of Pie Chart Finance Ppt Powerpoint Presentation File Design Templates
This is a pie of pie chart finance ppt powerpoint presentation file design templates. This is a four stage process. The stages in this process are finance, marketing, management, investment, analysis.

Donut Chart Finance Marketing Ppt Powerpoint Presentation Infographics Skills Ppt Powerpoint Presentation File Skills
This is a donut chart finance marketing ppt powerpoint presentation infographics skills ppt powerpoint presentation file skills. This is a four stage process. The stages in this process are finance, marketing, management, investment, analysis.
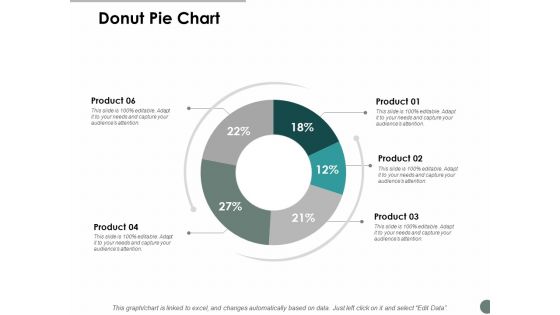
Donut Pie Chart Marketing Ppt Powerpoint Presentation Infographic Template Graphics Template
This is a donut pie chart marketing ppt powerpoint presentation infographic template graphics template. This is a six stage process. The stages in this process are finance, marketing, management, investment, analysis.

Money Growth With Bar Chart PowerPoint Templates Ppt Backgrounds For Slides 0413
We present our Money Growth With Bar Chart PowerPoint Templates PPT Backgrounds For Slides 0413.Use our Money PowerPoint Templates because You are working at that stage with an air of royalty. Let our PowerPoint Templates and Slides be the jewels in your crown. Download and present our Finance PowerPoint Templates because Our PowerPoint Templates and Slides help you meet the demand of the Market. Just browse and pick the slides that appeal to your intuitive senses. Present our Business PowerPoint Templates because Our PowerPoint Templates and Slides have the Brilliant backdrops. Guaranteed to illuminate the minds of your audience. Download our Globe PowerPoint Templates because You should Bet on your luck with our PowerPoint Templates and Slides. Be assured that you will hit the jackpot. Download and present our Signs PowerPoint Templates because You canTake a leap off the starting blocks with our PowerPoint Templates and Slides. They will put you ahead of the competition in quick time.Use these PowerPoint slides for presentations relating to Business chart and globe, money, business, finance, globe, signs. The prominent colors used in the PowerPoint template are Blue, White, Green. Our Money Growth With Bar Chart PowerPoint Templates Ppt Backgrounds For Slides 0413 will give a clarion call. People will fall over each other to come hear you.
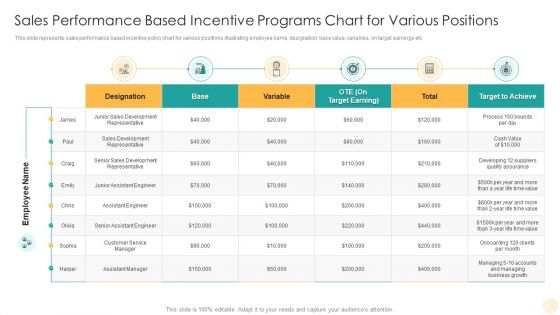
Sales Performance Based Incentive Programs Chart For Various Positions Rules PDF
This slide represents sales performance based incentive policy chart for various positions illustrating employee name, designation, base value, variables, on target earnings etc. Showcasing this set of slides titled Sales Performance Based Incentive Programs Chart For Various Positions Rules PDF. The topics addressed in these templates are Sales Development Representative, Target To Achieve, Target Earning. All the content presented in this PPT design is completely editable. Download it and make adjustments in color, background, font etc. as per your unique business setting.
Vector Showing Financial Ratio Evaluation Chart Icon Ppt PowerPoint Presentation Gallery Inspiration PDF
Persuade your audience using this vector showing financial ratio evaluation chart icon ppt powerpoint presentation gallery inspiration pdf. This PPT design covers three stages, thus making it a great tool to use. It also caters to a variety of topics including vector showing financial ratio evaluation chart icon. Download this PPT design now to present a convincing pitch that not only emphasizes the topic but also showcases your presentation skills.
Manager Analyzing Trends From Financial Modelling Chart Vector Icon Portrait PDF
Persuade your audience using this manager analyzing trends from financial modelling chart vector icon portrait pdf. This PPT design covers three stages, thus making it a great tool to use. It also caters to a variety of topics including manager analyzing trends from financial modelling chart vector icon. Download this PPT design now to present a convincing pitch that not only emphasizes the topic but also showcases your presentation skills.

Businessmen Presenting Financial Chart PowerPoint Templates Ppt Backgrounds For Slides 0613
Open Up Doors That Lead To Success. Our Businessmen Presenting Financial Chart Power Point Templates PPT Backgrounds For Slides Provide The Handles. Opportunity Will Come Knocking At Your Door. Welcome It With Our Leadership Power Point Templates. Our Business Power Point Templates Abhor Doodling. They Never Let The Interest Flag. Your thought process will never falter. Our Businessmen Presenting Financial Chart PowerPoint Templates Ppt Backgrounds For Slides 0613 will steer them along correctly.

Growth Arrow Chart Showing Good Financial Condition Ppt PowerPoint Presentation Pictures Summary PDF
Persuade your audience using this growth arrow chart showing good financial condition ppt powerpoint presentation pictures summary pdf. This PPT design covers two stages, thus making it a great tool to use. It also caters to a variety of topics including growth arrow chart showing good financial condition. Download this PPT design now to present a convincing pitch that not only emphasizes the topic but also showcases your presentation skills.
Bullish Stock Trading Chart With Dollar Symbol Vector Icon Ppt PowerPoint Presentation Icon Infographic Template PDF
Presenting bullish stock trading chart with dollar symbol vector icon ppt powerpoint presentation icon infographic template pdf to dispense important information. This template comprises three stages. It also presents valuable insights into the topics including bullish stock trading chart with dollar symbol vector icon. This is a completely customizable PowerPoint theme that can be put to use immediately. So, download it and address the topic impactfully.
Accounting Ratio Assessment With Growth Chart Icon Ppt PowerPoint Presentation Show Inspiration PDF
Persuade your audience using this Accounting Ratio Assessment With Growth Chart Icon Ppt PowerPoint Presentation Show Inspiration PDF. This PPT design covers three stages, thus making it a great tool to use. It also caters to a variety of topics including Accounting Ratio, Assessment Growth, Chart Icon. Download this PPT design now to present a convincing pitch that not only emphasizes the topic but also showcases your presentation skills.
Cost Structure Assessment Chart With Down Flow Vector Icon Ppt PowerPoint Presentation File Demonstration PDF
Presenting cost structure assessment chart with down flow vector icon ppt powerpoint presentation file demonstration pdf to dispense important information. This template comprises one stages. It also presents valuable insights into the topics including cost structure assessment chart with down flow vector icon. This is a completely customizable PowerPoint theme that can be put to use immediately. So, download it and address the topic impactfully.
Chart Icon With Magnifying Glass Depicting Decline In Sales Ppt PowerPoint Presentation Gallery Layout PDF
Presenting chart icon with magnifying glass depicting decline in sales ppt powerpoint presentation gallery layout pdf to dispense important information. This template comprises three stages. It also presents valuable insights into the topics including chart icon with magnifying glass depicting decline in sales. This is a completely customizable PowerPoint theme that can be put to use immediately. So, download it and address the topic impactfully.
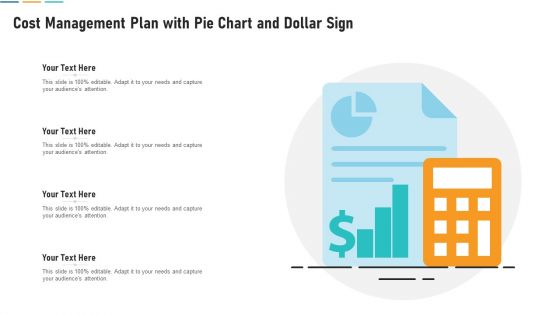
Cost Management Plan With Pie Chart And Dollar Sign Mockup PDF
Persuade your audience using this cost management plan with pie chart and dollar sign mockup pdf. This PPT design covers four stages, thus making it a great tool to use. It also caters to a variety of topics including cost management plan with pie chart and dollar sign. Download this PPT design now to present a convincing pitch that not only emphasizes the topic but also showcases your presentation skills.
Pie Chart With Dollar Symbol For Market Share Vector Icon Ppt PowerPoint Presentation File Show PDF
Persuade your audience using this pie chart with dollar symbol for market share vector icon ppt powerpoint presentation file show pdf. This PPT design covers three stages, thus making it a great tool to use. It also caters to a variety of topics including pie chart with dollar symbol for market share vector icon. Download this PPT design now to present a convincing pitch that not only emphasizes the topic but also showcases your presentation skills.
Statistical Assessment Scatter Chart Icon Ppt PowerPoint Presentation Infographic Template PDF
Persuade your audience using this statistical assessment scatter chart icon ppt powerpoint presentation infographic template pdf. This PPT design covers three stages, thus making it a great tool to use. It also caters to a variety of topics including statistical assessment scatter chart icon. Download this PPT design now to present a convincing pitch that not only emphasizes the topic but also showcases your presentation skills.
Business Stakeholder With Finance Chart Vector Icon Ppt PowerPoint Presentation File Portfolio PDF
Persuade your audience using this business stakeholder with finance chart vector icon ppt powerpoint presentation file portfolio pdf. This PPT design covers one stages, thus making it a great tool to use. It also caters to a variety of topics including business stakeholder with finance chart vector icon. Download this PPT design now to present a convincing pitch that not only emphasizes the topic but also showcases your presentation skills.
5 Years Mutual Funds Performance Comparative Analysis Chart Icon Ppt Show Gridlines PDF
Persuade your audience using this 5 Years Mutual Funds Performance Comparative Analysis Chart Icon Ppt Show Gridlines PDF. This PPT design covers three stages, thus making it a great tool to use. It also caters to a variety of topics including 5 Years, Mutual Funds, Performance Comparative, Analysis, Chart Icon. Download this PPT design now to present a convincing pitch that not only emphasizes the topic but also showcases your presentation skills.
Scatter Chart With Horizontal And Vertical Axis Ppt PowerPoint Presentation Icon Infographics PDF
Persuade your audience using this scatter chart with horizontal and vertical axis ppt powerpoint presentation icon infographics pdf. This PPT design covers three stages, thus making it a great tool to use. It also caters to a variety of topics including scatter chart with horizontal and vertical axis. Download this PPT design now to present a convincing pitch that not only emphasizes the topic but also showcases your presentation skills.
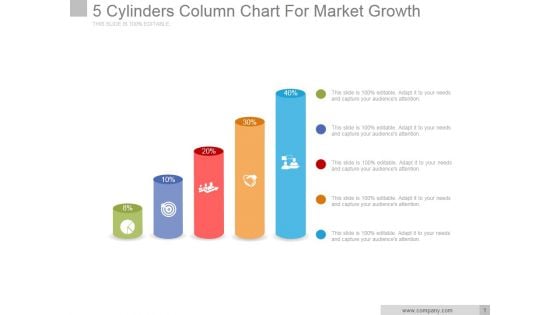
5 Cylinders Column Chart For Market Growth Ppt PowerPoint Presentation Outline
This is a 5 cylinders column chart for market growth ppt powerpoint presentation outline. This is a five stage process. The stages in this process are business, marketing, icons, growth, finance.
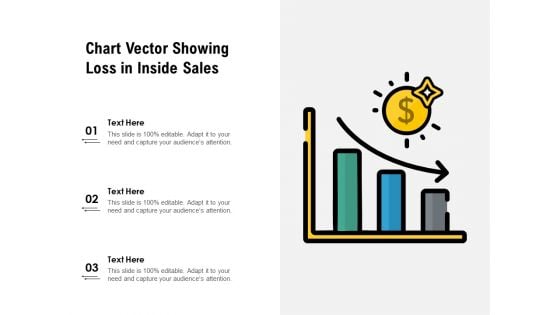
Chart Vector Showing Loss In Inside Sales Ppt PowerPoint Presentation Gallery Guide PDF
Persuade your audience using this chart vector showing loss in inside sales ppt powerpoint presentation gallery guide pdf. This PPT design covers three stages, thus making it a great tool to use. It also caters to a variety of topics including chart vector showing loss in inside sales. Download this PPT design now to present a convincing pitch that not only emphasizes the topic but also showcases your presentation skills.
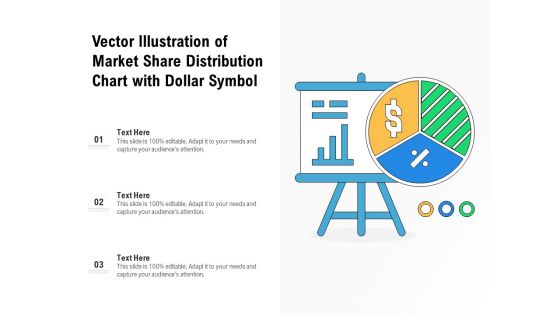
Vector Illustration Of Market Share Distribution Chart With Dollar Symbol Ppt PowerPoint Presentation File Outline PDF
Persuade your audience using this vector illustration of market share distribution chart with dollar symbol ppt powerpoint presentation file outline pdf. This PPT design covers three stages, thus making it a great tool to use. It also caters to a variety of topics including vector illustration of market share distribution chart with dollar symbol. Download this PPT design now to present a convincing pitch that not only emphasizes the topic but also showcases your presentation skills.
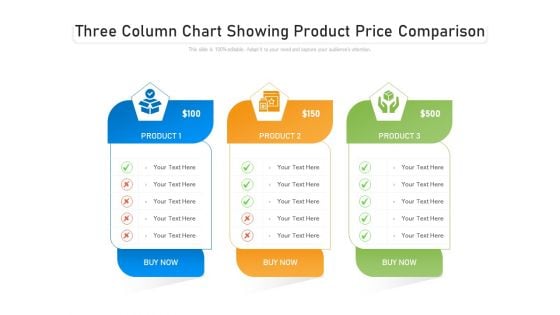
Three Column Chart Showing Product Price Comparison Ppt PowerPoint Presentation Ideas Deck PDF
Persuade your audience using this three column chart showing product price comparison ppt powerpoint presentation ideas deck pdf. This PPT design covers three stages, thus making it a great tool to use. It also caters to a variety of topics including three column chart showing product price comparison. Download this PPT design now to present a convincing pitch that not only emphasizes the topic but also showcases your presentation skills.
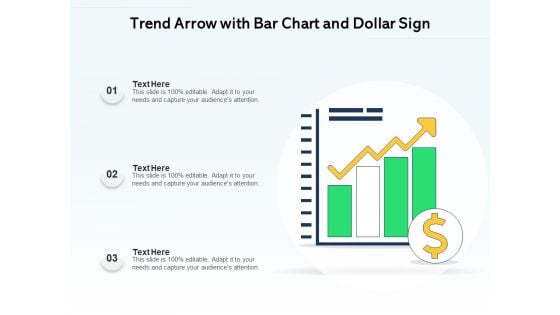
Trend Arrow With Bar Chart And Dollar Sign Ppt PowerPoint Presentation Influencers PDF
Persuade your audience using this trend arrow with bar chart and dollar sign ppt powerpoint presentation influencers pdf. This PPT design covers three stages, thus making it a great tool to use. It also caters to a variety of topics including trend arrow with bar chart and dollar sign. Download this PPT design now to present a convincing pitch that not only emphasizes the topic but also showcases your presentation skills.
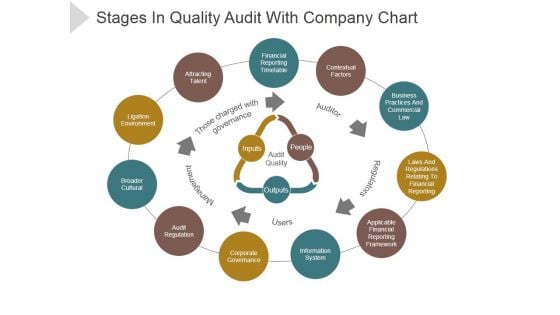
Stages In Quality Audit With Company Chart Ppt PowerPoint Presentation Files
This is a stages in quality audit with company chart ppt powerpoint presentation files. This is a eleven stage process. The stages in this process are financial reporting timetable, contextual factors, business practices and commercial law, applicable financial reporting framework.
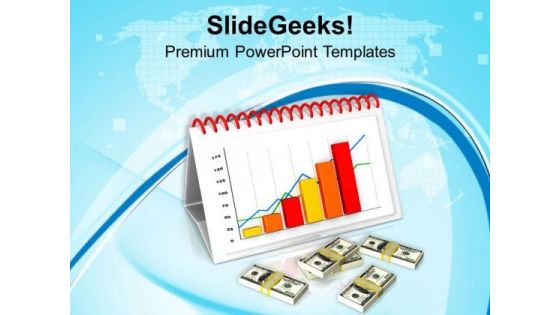
Calendar With Growing Chart Finance PowerPoint Templates Ppt Backgrounds For Slides 0413
We present our Calendar With Growing Chart Finance PowerPoint Templates PPT Backgrounds For Slides 0413.Present our Business PowerPoint Templates because You have a driving passion to excel in your field. Our PowerPoint Templates and Slides will prove ideal vehicles for your ideas. Use our Success PowerPoint Templates because our PowerPoint Templates and Slides are the string of your bow. Fire of your ideas and conquer the podium. Download our Money PowerPoint Templates because You canTake a leap off the starting blocks with our PowerPoint Templates and Slides. They will put you ahead of the competition in quick time. Use our Finance PowerPoint Templates because Our PowerPoint Templates and Slides are innately eco-friendly. Their high recall value negate the need for paper handouts. Download our Marketing PowerPoint Templates because It will Raise the bar of your Thoughts. They are programmed to take you to the next level.Use these PowerPoint slides for presentations relating to Calendar with growing chart, business, success, money, finance, marketing. The prominent colors used in the PowerPoint template are Red, Orange , Yellow. Display performance management with our Calendar With Growing Chart Finance PowerPoint Templates Ppt Backgrounds For Slides 0413. They will make you look good.
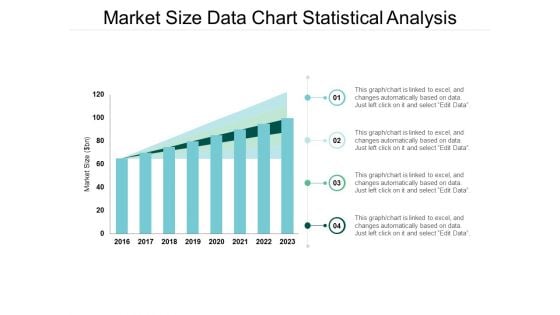
Market Size Data Chart Statistical Analysis Ppt Powerpoint Presentation Model Format
This is a market size data chart statistical analysis ppt powerpoint presentation model format. The topics discussed in this diagram are market growth, market opportunity, market profitability. This is a completely editable PowerPoint presentation, and is available for immediate download.
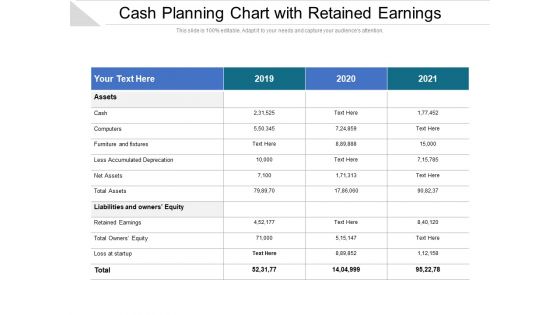
Cash Planning Chart With Retained Earnings Ppt PowerPoint Presentation Gallery Samples PDF
Presenting this set of slides with name cash planning chart with retained earnings ppt powerpoint presentation gallery samples pdf. The topics discussed in these slides are liabilities, equity, accumulated. This is a completely editable PowerPoint presentation and is available for immediate download. Download now and impress your audience.
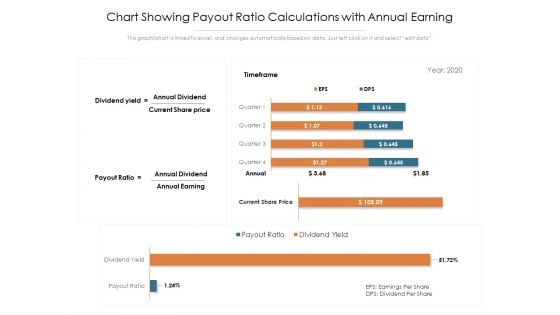
Chart Showing Payout Ratio Calculations With Annual Earning Ppt PowerPoint Presentation Inspiration Examples PDF
Presenting this set of slides with name chart showing payout ratio calculations with annual earning ppt powerpoint presentation inspiration examples pdf. The topics discussed in these slides are timeframe, dividend yield, payout ratio, annual dividend, annual earning, annual. This is a completely editable PowerPoint presentation and is available for immediate download. Download now and impress your audience.
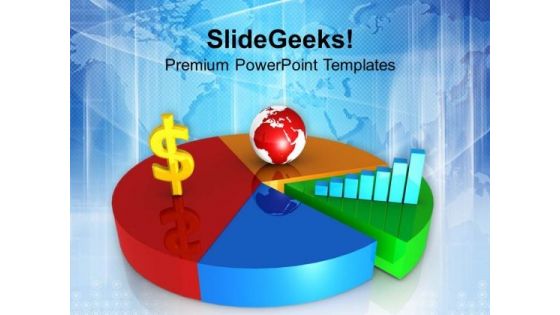
Dollar Fluctuation Glabaly With Pie Chart PowerPoint Templates Ppt Backgrounds For Slides 0313
We present our Dollar Fluctuation Glabaly With Pie Chart PowerPoint Templates PPT Backgrounds For Slides 0313.Download our Money PowerPoint Templates because Our PowerPoint Templates and Slides will give you great value for your money. Be assured of finding the best projection to highlight your words. Use our Finance PowerPoint Templates because You have the co-ordinates for your destination of success. Let our PowerPoint Templates and Slides map out your journey. Download and present our Marketing PowerPoint Templates because You have the co-ordinates for your destination of success. Let our PowerPoint Templates and Slides map out your journey. Use our Business PowerPoint Templates because Our PowerPoint Templates and Slides will fulfill your every need. Use them and effectively satisfy the desires of your audience. Present our Success PowerPoint Templates because You can Connect the dots. Fan expectations as the whole picture emerges.Use these PowerPoint slides for presentations relating to Pie chart, finance, marketing, business, success, money. The prominent colors used in the PowerPoint template are Yellow, Green, Red. People often criticise without any cause. With our Dollar Fluctuation Glabaly With Pie Chart PowerPoint Templates Ppt Backgrounds For Slides 0313 you won't give a fig.


 Continue with Email

 Home
Home


