Revenue Chart
Stacked Line Ppt PowerPoint Presentation Icon Professional
This is a stacked line ppt powerpoint presentation icon professional. This is a three stage process. The stages in this process are Business, Financial, Marketing, Graph, Strategy Revenue In Percentage.
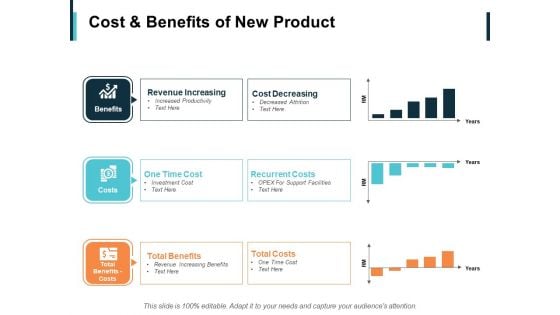
Cost And Benefits Of New Product Ppt PowerPoint Presentation Inspiration Diagrams
This is a cost and benefits of new product ppt powerpoint presentation inspiration diagrams. This is a three stage process. The stages in this process are recurrent costs, cost decreasing, revenue increasing, benefits, costs.
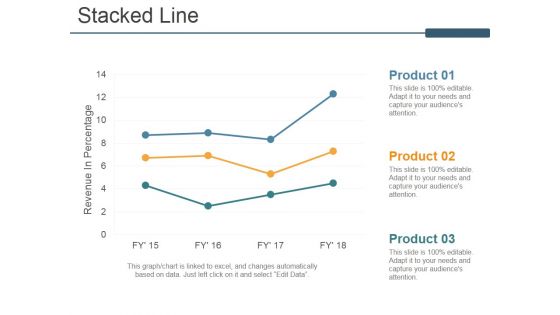
Stacked Line Ppt PowerPoint Presentation Ideas Model
This is a stacked line ppt powerpoint presentation ideas model. This is a three stage process. The stages in this process are revenue in percentage, stacked line, product, business, marketing.
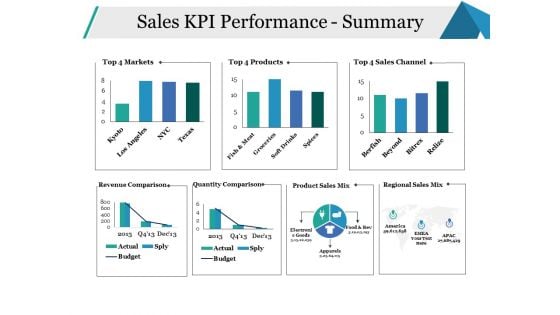
Sales KPI Performance Summary Ppt PowerPoint Presentation Infographics Model
This is a sales kpi performance summary ppt powerpoint presentation infographics model. This is a seven stage process. The stages in this process are sales channel, revenue comparison, quantity comparison, business, marketing.
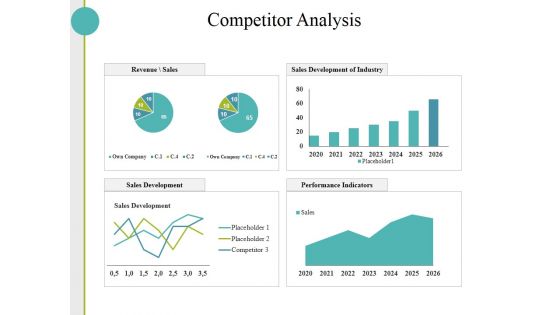
Competitor Analysis Ppt PowerPoint Presentation Layouts Slides
This is a competitor analysis ppt powerpoint presentation layouts slides. This is a four stage process. The stages in this process are sales development, performance indicators, sales development of industry, revenue sales.
Competitor Analysis Ppt PowerPoint Presentation Visual Aids Model
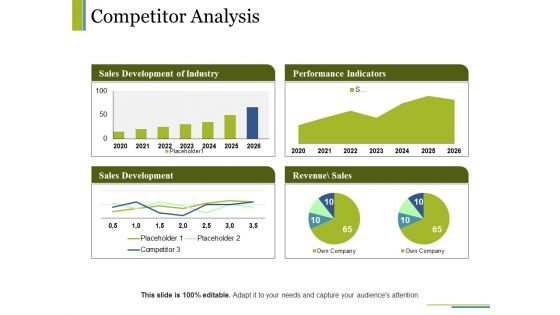
This is a competitor analysis ppt powerpoint presentation visual aids model. This is a four stage process. The stages in this process are sales development of industry, performance indicators, sales development, revenue sales, business.
Stacked Line Ppt PowerPoint Presentation Professional Graphics Pictures
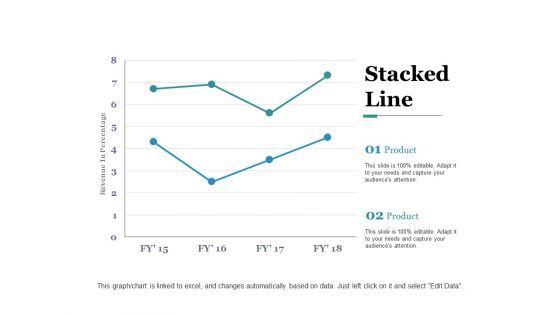
This is a stacked line ppt powerpoint presentation professional graphics pictures. This is a two stage process. The stages in this process are revenue in percentage, business, marketing, graph, finance.
Sales Dashboard Template 2 Ppt PowerPoint Presentation Clipart
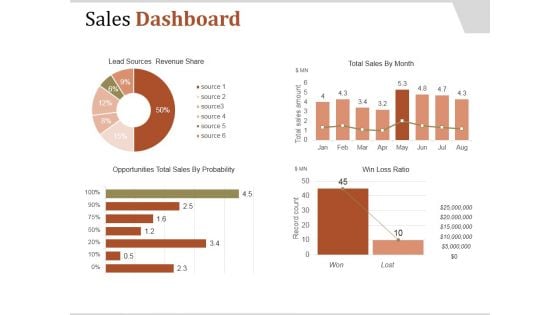
This is a sales dashboard template 2 ppt powerpoint presentation clipart. This is a four stage process. The stages in this process are lead sources revenue share, total sales by month, win loss ratio, opportunities total sales by probability.
Stacked Line Ppt PowerPoint Presentation Show
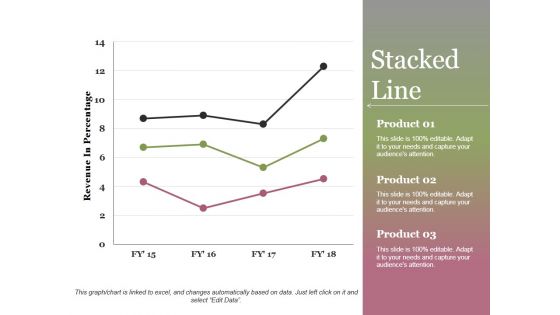
This is a stacked line ppt powerpoint presentation show. This is a three stage process. The stages in this process are revenue in percentage, product, stacked line, growth, success.
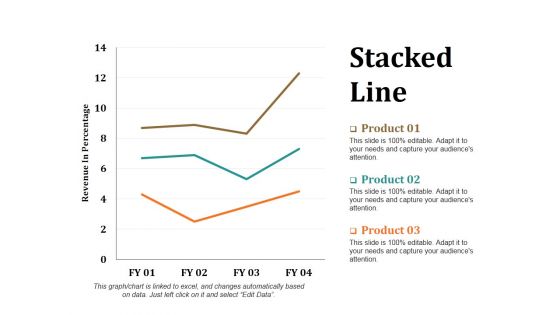
Stacked Line Ppt PowerPoint Presentation Layouts Portrait
This is a stacked line ppt powerpoint presentation layouts portrait. This is a three stage process. The stages in this process are revenue in percentage, stacked line, product, growth, success.
Customer Attrition In A Bpo - Dashboard Icons PDF
Deliver an awe-inspiring pitch with this creative customer attrition in a bpo - dashboard icons pdf. bundle. Topics like web chart performance, telecom churn overview metrics, customer care call performance, telecom churn overview metrics, monthly revenue lost can be discussed with this completely editable template. It is available for immediate download depending on the needs and requirements of the user.
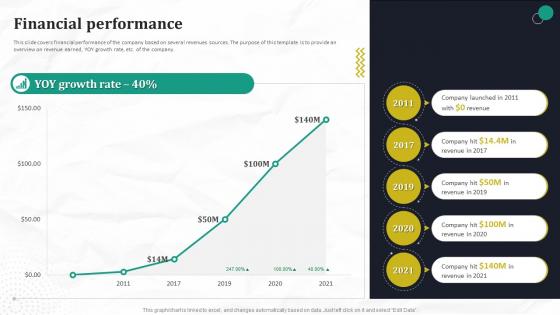
Financial Performance Automated Workflow Software Funding Pitch Deck For Company
This slide covers financial performance of the company based on several revenues sources. The purpose of this template is to provide an overview on revenue earned, YOY growth rate, etc. of the company. From laying roadmaps to briefing everything in detail, our templates are perfect for you. You can set the stage with your presentation slides. All you have to do is download these easy-to-edit and customizable templates. Financial Performance Automated Workflow Software Funding Pitch Deck For Company will help you deliver an outstanding performance that everyone would remember and praise you for. Do download this presentation today. This slide covers financial performance of the company based on several revenues sources. The purpose of this template is to provide an overview on revenue earned, YOY growth rate, etc. of the company.
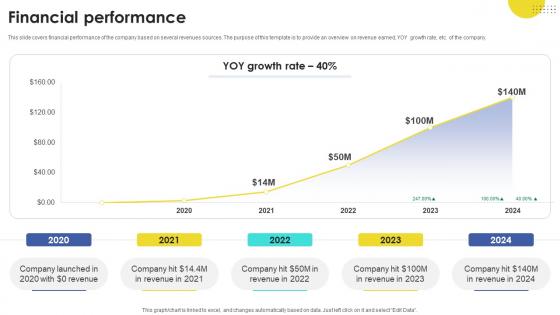
Financial Performance Task Automation Company Investor Funding Elevator Pitch Deck
This slide covers financial performance of the company based on several revenues sources. The purpose of this template is to provide an overview on revenue earned, YOY growth rate, etc. of the company. From laying roadmaps to briefing everything in detail, our templates are perfect for you. You can set the stage with your presentation slides. All you have to do is download these easy-to-edit and customizable templates. Financial Performance Task Automation Company Investor Funding Elevator Pitch Deck will help you deliver an outstanding performance that everyone would remember and praise you for. Do download this presentation today. This slide covers financial performance of the company based on several revenues sources. The purpose of this template is to provide an overview on revenue earned, YOY growth rate, etc. of the company.
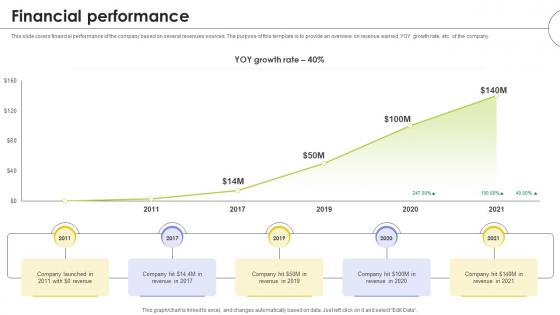
Financial Performance Web Based Automated Tool Platform Pitch Deck Ppt Slides
This slide covers financial performance of the company based on several revenues sources. The purpose of this template is to provide an overview on revenue earned, YOY growth rate, etc. of the company. From laying roadmaps to briefing everything in detail, our templates are perfect for you. You can set the stage with your presentation slides. All you have to do is download these easy-to-edit and customizable templates. Financial Performance Web Based Automated Tool Platform Pitch Deck Ppt Slides will help you deliver an outstanding performance that everyone would remember and praise you for. Do download this presentation today. This slide covers financial performance of the company based on several revenues sources. The purpose of this template is to provide an overview on revenue earned, YOY growth rate, etc. of the company.
Financial Projections Foreign Exchange Company Investor Funding Elevator Pitch Deck
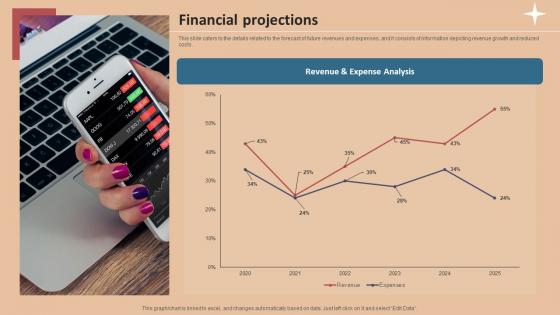
This slide caters to the details related to the forecast of future revenues and expenses, and it consists of information depicting revenue growth and reduced costs. Slidegeeks is here to make your presentations a breeze with Financial Projections Foreign Exchange Company Investor Funding Elevator Pitch Deck With our easy-to-use and customizable templates, you can focus on delivering your ideas rather than worrying about formatting. With a variety of designs to choose from, you are sure to find one that suits your needs. And with animations and unique photos, illustrations, and fonts, you can make your presentation pop. So whether you are giving a sales pitch or presenting to the board, make sure to check out Slidegeeks first This slide caters to the details related to the forecast of future revenues and expenses, and it consists of information depicting revenue growth and reduced costs.
Workforce Productivity Improvement Negative Impact Of Human Resource Issues On Company Template Pdf
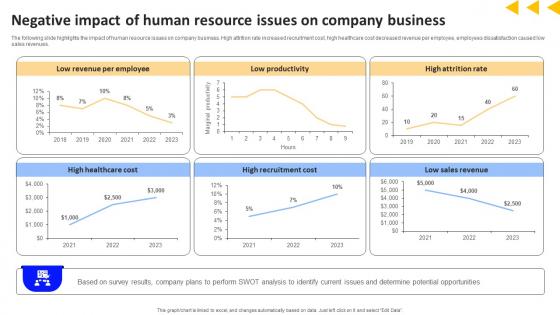
The following slide highlights the impact of human resource issues on company business. High attrition rate increased recruitment cost, high healthcare cost decreased revenue per employee, employees dissatisfaction caused low sales revenues. Create an editable Workforce Productivity Improvement Negative Impact Of Human Resource Issues On Company Template Pdf that communicates your idea and engages your audience. Whether you are presenting a business or an educational presentation, pre designed presentation templates help save time. Workforce Productivity Improvement Negative Impact Of Human Resource Issues On Company Template Pdf is highly customizable and very easy to edit, covering many different styles from creative to business presentations. Slidegeeks has creative team members who have crafted amazing templates. So, go and get them without any delay. The following slide highlights the impact of human resource issues on company business. High attrition rate increased recruitment cost, high healthcare cost decreased revenue per employee, employees dissatisfaction caused low sales revenues.
Web Designing Icon Investor Funding Elevator Pitch Deck Financial Performance Slides PDF
Following slide provides information about business revenue generation on yearly basis. It includes revenue in USD and annual revenue. Coming up with a presentation necessitates that the majority of the effort goes into the content and the message you intend to convey. The visuals of a PowerPoint presentation can only be effective if it supplements and supports the story that is being told. Keeping this in mind our experts created Web Designing Icon Investor Funding Elevator Pitch Deck Financial Performance Slides PDF to reduce the time that goes into designing the presentation. This way, you can concentrate on the message while our designers take care of providing you with the right template for the situation.
SMS Marketing Performance Analytics Report SMS Promotional Tactics Structure PDF
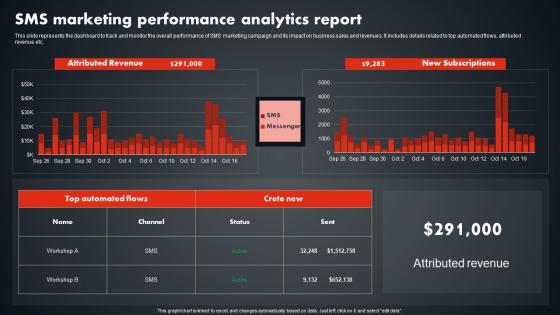
This slide represents the dashboard to track and monitor the overall performance of SMS marketing campaign and its impact on business sales and revenues. It includes details related to top automated flows, attributed revenue etc. From laying roadmaps to briefing everything in detail, our templates are perfect for you. You can set the stage with your presentation slides. All you have to do is download these easy-to-edit and customizable templates. SMS Marketing Performance Analytics Report SMS Promotional Tactics Structure PDF will help you deliver an outstanding performance that everyone would remember and praise you for. Do download this presentation today. This slide represents the dashboard to track and monitor the overall performance of SMS marketing campaign and its impact on business sales and revenues. It includes details related to top automated flows, attributed revenue etc.
SMS Marketing Performance Analytics Report Text Message Marketing Strategies Structure Pdf
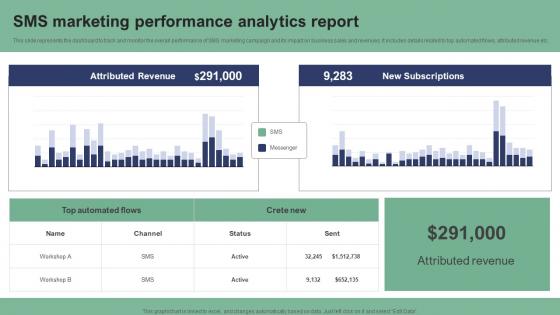
This slide represents the dashboard to track and monitor the overall performance of SMS marketing campaign and its impact on business sales and revenues. It includes details related to top automated flows, attributed revenue etc. From laying roadmaps to briefing everything in detail, our templates are perfect for you. You can set the stage with your presentation slides. All you have to do is download these easy-to-edit and customizable templates. SMS Marketing Performance Analytics Report Text Message Marketing Strategies Structure Pdf will help you deliver an outstanding performance that everyone would remember and praise you for. Do download this presentation today. This slide represents the dashboard to track and monitor the overall performance of SMS marketing campaign and its impact on business sales and revenues. It includes details related to top automated flows, attributed revenue etc.
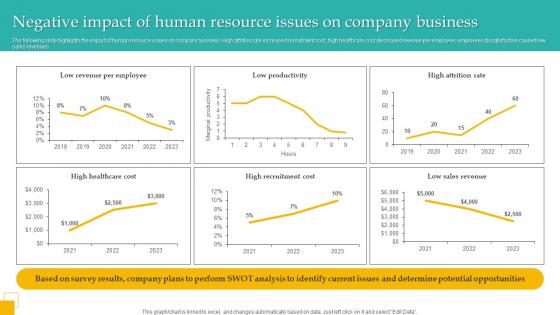
Negative Impact Of Human Resource Issues On Company Business Pictures Pdf
The following slide highlights the impact of human resource issues on company business. High attrition rate increased recruitment cost, high healthcare cost decreased revenue per employee, employees dissatisfaction caused low sales revenues. The Negative Impact Of Human Resource Issues On Company Business Pictures Pdf is a compilation of the most recent design trends as a series of slides. It is suitable for any subject or industry presentation, containing attractive visuals and photo spots for businesses to clearly express their messages. This template contains a variety of slides for the user to input data, such as structures to contrast two elements, bullet points, and slides for written information. Slidegeeks is prepared to create an impression. The following slide highlights the impact of human resource issues on company business. High attrition rate increased recruitment cost, high healthcare cost decreased revenue per employee, employees dissatisfaction caused low sales revenues.
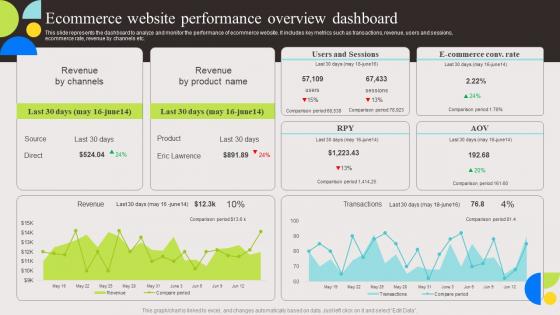
Ecommerce Website Performance Evaluation And Deployment Of Enhanced Elements Pdf
This slide represents the dashboard to analyze and monitor the performance of ecommerce website. It includes key metrics such as transactions, revenue, users and sessions, ecommerce rate, revenue by channels etc. If you are looking for a format to display your unique thoughts, then the professionally designed Ecommerce Website Performance Evaluation And Deployment Of Enhanced Elements Pdf is the one for you. You can use it as a Google Slides template or a PowerPoint template. Incorporate impressive visuals, symbols, images, and other charts. Modify or reorganize the text boxes as you desire. Experiment with shade schemes and font pairings. Alter, share or cooperate with other people on your work. Download Ecommerce Website Performance Evaluation And Deployment Of Enhanced Elements Pdf and find out how to give a successful presentation. Present a perfect display to your team and make your presentation unforgettable. This slide represents the dashboard to analyze and monitor the performance of ecommerce website. It includes key metrics such as transactions, revenue, users and sessions, ecommerce rate, revenue by channels etc.
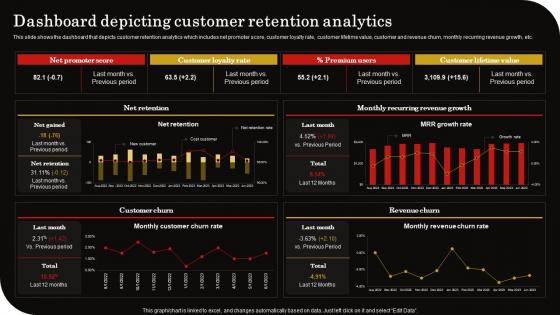
Dashboard Depicting Customer Retention Client Retention Strategy To Reduce Churn Rate Professional Pdf
This slide shows the dashboard that depicts customer retention analytics which includes net promoter score, customer loyalty rate, customer lifetime value, customer and revenue churn, monthly recurring revenue growth, etc. If you are looking for a format to display your unique thoughts, then the professionally designed Dashboard Depicting Customer Retention Client Retention Strategy To Reduce Churn Rate Professional Pdf is the one for you. You can use it as a Google Slides template or a PowerPoint template. Incorporate impressive visuals, symbols, images, and other charts. Modify or reorganize the text boxes as you desire. Experiment with shade schemes and font pairings. Alter, share or cooperate with other people on your work. Download Dashboard Depicting Customer Retention Client Retention Strategy To Reduce Churn Rate Professional Pdf and find out how to give a successful presentation. Present a perfect display to your team and make your presentation unforgettable. This slide shows the dashboard that depicts customer retention analytics which includes net promoter score, customer loyalty rate, customer lifetime value, customer and revenue churn, monthly recurring revenue growth, etc.

Expenditure Split Food Delivery Company Profile CP SS V
The slide showcase revenue split of Swiggy. It include different revenue sources such as outsourcing support cost, communication and technology cost, advertising and promotional expenses, loss on order cancellation and others . If you are looking for a format to display your unique thoughts, then the professionally designed Expenditure Split Food Delivery Company Profile CP SS V is the one for you. You can use it as a Google Slides template or a PowerPoint template. Incorporate impressive visuals, symbols, images, and other charts. Modify or reorganize the text boxes as you desire. Experiment with shade schemes and font pairings. Alter, share or cooperate with other people on your work. Download Expenditure Split Food Delivery Company Profile CP SS V and find out how to give a successful presentation. Present a perfect display to your team and make your presentation unforgettable. The slide showcase revenue split of Swiggy. It include different revenue sources such as outsourcing support cost, communication and technology cost, advertising and promotional expenses, loss on order cancellation and others .

Expenditure Split Grocery Delivery Company Profile CP SS V
The slide showcase revenue split of Swiggy. It include different revenue sources such as outsourcing support cost, communication and technology cost, advertising and promotional expenses, loss on order cancellation and others . If you are looking for a format to display your unique thoughts, then the professionally designed Expenditure Split Grocery Delivery Company Profile CP SS V is the one for you. You can use it as a Google Slides template or a PowerPoint template. Incorporate impressive visuals, symbols, images, and other charts. Modify or reorganize the text boxes as you desire. Experiment with shade schemes and font pairings. Alter, share or cooperate with other people on your work. Download Expenditure Split Grocery Delivery Company Profile CP SS V and find out how to give a successful presentation. Present a perfect display to your team and make your presentation unforgettable. The slide showcase revenue split of Swiggy. It include different revenue sources such as outsourcing support cost, communication and technology cost, advertising and promotional expenses, loss on order cancellation and others .
Process Enhancement Plan To Boost Sales Performance Monthly Sales Performance Tracking And Monitoring Dashboard Professional PDF
This slide showcases a dashboard presenting various metrics to measure and analyze sales performance for revenue growth. It includes key components such as number of sales, revenue, profit, cost, sales revenue, sales increment, cost analysis and cross sell. Create an editable Process Enhancement Plan To Boost Sales Performance Monthly Sales Performance Tracking And Monitoring Dashboard Professional PDF that communicates your idea and engages your audience. Whether youre presenting a business or an educational presentation, pre designed presentation templates help save time. Process Enhancement Plan To Boost Sales Performance Monthly Sales Performance Tracking And Monitoring Dashboard Professional PDF is highly customizable and very easy to edit, covering many different styles from creative to business presentations. Slidegeeks has creative team members who have crafted amazing templates. So, go and get them without any delay.
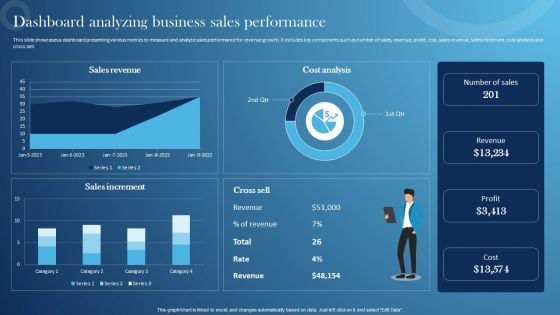
Inspecting Sales Optimization Areas Dashboard Analyzing Business Sales Performance Slides PDF
This slide showcases a dashboard presenting various metrics to measure and analyze sales performance for revenue growth. It includes key components such as number of sales, revenue, profit, cost, sales revenue, sales increment, cost analysis and cross sell. Create an editable Inspecting Sales Optimization Areas Dashboard Analyzing Business Sales Performance Slides PDF that communicates your idea and engages your audience. Whether youre presenting a business or an educational presentation, pre-designed presentation templates help save time. Inspecting Sales Optimization Areas Dashboard Analyzing Business Sales Performance Slides PDF is highly customizable and very easy to edit, covering many different styles from creative to business presentations. Slidegeeks has creative team members who have crafted amazing templates. So, go and get them without any delay.
Monthly Sales Performance Tracking And Monitoring Dashboard Sample PDF
This slide showcases a dashboard presenting various metrics to measure and analyze sales performance for revenue growth. It includes key components such as number of sales, revenue, profit, cost, sales revenue, sales increment, cost analysis and cross sell. Do you have to make sure that everyone on your team knows about any specific topic I yes, then you should give Monthly Sales Performance Tracking And Monitoring Dashboard Sample PDF a try. Our experts have put a lot of knowledge and effort into creating this impeccable Monthly Sales Performance Tracking And Monitoring Dashboard Sample PDF. You can use this template for your upcoming presentations, as the slides are perfect to represent even the tiniest detail. You can download these templates from the Slidegeeks website and these are easy to edit. So grab these today.
Monthly Sales Performance Tracking And Monitoring Dashboard Inspiration PDF
This slide showcases a dashboard presenting various metrics to measure and analyze sales performance for revenue growth. It includes key components such as number of sales, revenue, profit, cost, sales revenue, sales increment, cost analysis and cross sell. Coming up with a presentation necessitates that the majority of the effort goes into the content and the message you intend to convey. The visuals of a PowerPoint presentation can only be effective if it supplements and supports the story that is being told. Keeping this in mind our experts created Monthly Sales Performance Tracking And Monitoring Dashboard Inspiration PDF to reduce the time that goes into designing the presentation. This way, you can concentrate on the message while our designers take care of providing you with the right template for the situation.
Traditional Marketing Techniques Dashboard For Tracking Offline Marketing Event Pictures PDF
This slide covers metrics for analyzing the event revenue and registrations. It includes KPIs such as gross revenue, gross revenue from promos, total refund, total registration, visits to purchase conversion, check-in- status, etc. Slidegeeks is one of the best resources for PowerPoint templates. You can download easily and regulate Traditional Marketing Techniques Dashboard For Tracking Offline Marketing Event Pictures PDF for your personal presentations from our wonderful collection. A few clicks is all it takes to discover and get the most relevant and appropriate templates. Use our Templates to add a unique zing and appeal to your presentation and meetings. All the slides are easy to edit and you can use them even for advertisement purposes.
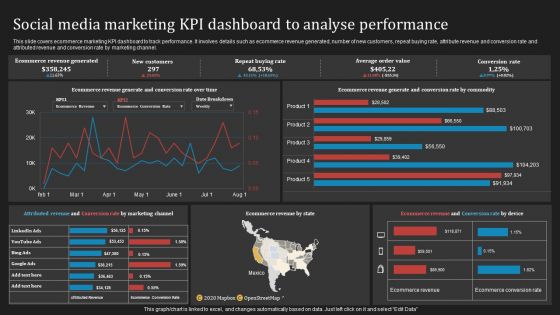
Deploying B2B Advertising Techniques For Lead Generation Social Media Marketing Kpi Dashboard Analyse Pictures PDF
This slide covers ecommerce marketing KPI dashboard to track performance. It involves details such as ecommerce revenue generated, number of new customers, repeat buying rate, attribute revenue and conversion rate and attributed revenue and conversion rate by marketing channel. Slidegeeks is here to make your presentations a breeze with Deploying B2B Advertising Techniques For Lead Generation Social Media Marketing Kpi Dashboard Analyse Pictures PDF With our easy to use and customizable templates, you can focus on delivering your ideas rather than worrying about formatting. With a variety of designs to choose from, you are sure to find one that suits your needs. And with animations and unique photos, illustrations, and fonts, you can make your presentation pop. So whether you are giving a sales pitch or presenting to the board, make sure to check out Slidegeeks first.
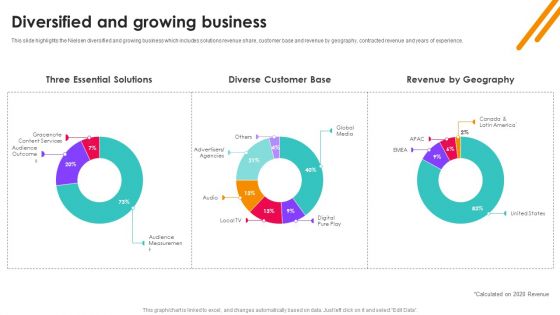
Nielsen Business Profile Diversified And Growing Business Ppt PowerPoint Presentation File Ideas PDF
This slide highlights the Nielsen diversified and growing business which includes solutions revenue share, customer base and revenue by geography, contracted revenue and years of experience. Presenting this PowerPoint presentation, titled Nielsen Business Profile Diversified And Growing Business Ppt PowerPoint Presentation File Ideas PDF, with topics curated by our researchers after extensive research. This editable presentation is available for immediate download and provides attractive features when used. Download now and captivate your audience. Presenting this Nielsen Business Profile Diversified And Growing Business Ppt PowerPoint Presentation File Ideas PDF. Our researchers have carefully researched and created these slides with all aspects taken into consideration. This is a completely customizable Nielsen Business Profile Diversified And Growing Business Ppt PowerPoint Presentation File Ideas PDF that is available for immediate downloading. Download now and make an impact on your audience. Highlight the attractive features available with our PPTs.
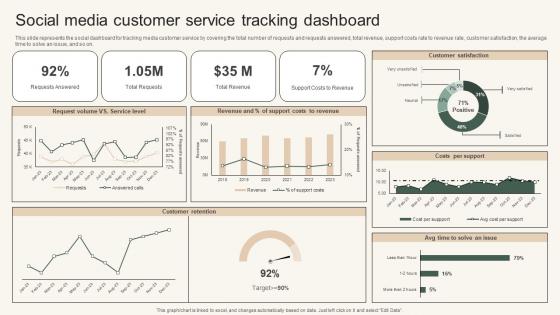
Social Media Customer Service Instant Messenger For Internal Business Operations Diagrams Pdf
This slide represents the social dashboard for tracking media customer service by covering the total number of requests and requests answered, total revenue, support costs rate to revenue rate, customer satisfaction, the average time to solve an issue, and so on. Whether you have daily or monthly meetings, a brilliant presentation is necessary. Social Media Customer Service Instant Messenger For Internal Business Operations Diagrams Pdf can be your best option for delivering a presentation. Represent everything in detail using Social Media Customer Service Instant Messenger For Internal Business Operations Diagrams Pdf and make yourself stand out in meetings. The template is versatile and follows a structure that will cater to your requirements. All the templates prepared by Slidegeeks are easy to download and edit. Our research experts have taken care of the corporate themes as well. So, give it a try and see the results. This slide represents the social dashboard for tracking media customer service by covering the total number of requests and requests answered, total revenue, support costs rate to revenue rate, customer satisfaction, the average time to solve an issue, and so on.
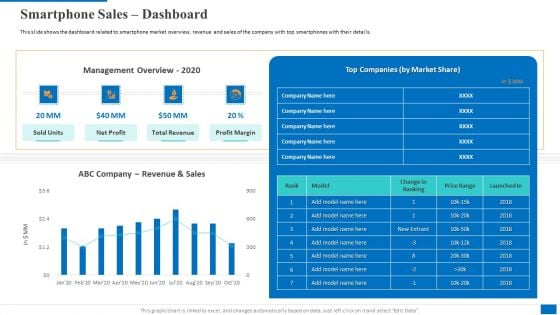
Smartphone Sales Dashboard Graphics PDF
This slide shows the dashboard related to smartphone market overview, revenue and sales of the company with top smartphones with their details.Deliver an awe inspiring pitch with this creative smartphone sales dashboard graphics pdf bundle. Topics like smartphone sales dashboard can be discussed with this completely editable template. It is available for immediate download depending on the needs and requirements of the user.
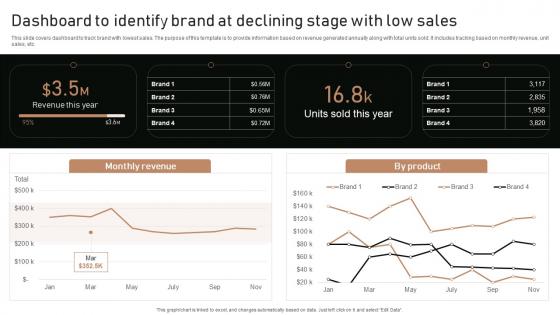
Execution Of Product Lifecycle Dashboard To Identify Brand At Declining Stage Ideas Pdf
This slide covers dashboard to track brand with lowest sales. The purpose of this template is to provide information based on revenue generated annually along with total units sold. It includes tracking based on monthly revenue, unit sales, etc. Get a simple yet stunning designed Execution Of Product Lifecycle Dashboard To Identify Brand At Declining Stage Ideas Pdf. It is the best one to establish the tone in your meetings. It is an excellent way to make your presentations highly effective. So, download this PPT today from Slidegeeks and see the positive impacts. Our easy-to-edit Execution Of Product Lifecycle Dashboard To Identify Brand At Declining Stage Ideas Pdf can be your go-to option for all upcoming conferences and meetings. So, what are you waiting for Grab this template today. This slide covers dashboard to track brand with lowest sales. The purpose of this template is to provide information based on revenue generated annually along with total units sold. It includes tracking based on monthly revenue, unit sales, etc.
Dashboard For Tracking Post Expansion Enhancing Global Presence Graphics Pdf
This slide covers the dashboard for analyzing fast food business sales by location. It includes KPIs such as the companys revenue by location, by type, top 5 expenses by account, top 5 expenses by department, cost of revenue year to date, etc.Find highly impressive Dashboard For Tracking Post Expansion Enhancing Global Presence Graphics Pdf on Slidegeeks to deliver a meaningful presentation. You can save an ample amount of time using these presentation templates. No need to worry to prepare everything from scratch because Slidegeeks experts have already done a huge research and work for you. You need to download Dashboard For Tracking Post Expansion Enhancing Global Presence Graphics Pdf for your upcoming presentation. All the presentation templates are 100Precent editable and you can change the color and personalize the content accordingly. Download now. This slide covers the dashboard for analyzing fast food business sales by location. It includes KPIs such as the companys revenue by location, by type, top 5 expenses by account, top 5 expenses by department, cost of revenue year to date, etc.
Dashboard For Tracking Impact Leveraging Logistics Automation Inspiration Pdf
This slide covers the dashboard for tracking vehicle efficiency after transport automation. It include KPIs such as truck turnaround time, average revenue per hour, truckload capacity, transit time, on-time pickup, and average revenue per mile.Do you have to make sure that everyone on your team knows about any specific topic I yes, then you should give Dashboard For Tracking Impact Leveraging Logistics Automation Inspiration Pdf a try. Our experts have put a lot of knowledge and effort into creating this impeccable Dashboard For Tracking Impact Leveraging Logistics Automation Inspiration Pdf. You can use this template for your upcoming presentations, as the slides are perfect to represent even the tiniest detail. You can download these templates from the Slidegeeks website and these are easy to edit. So grab these today. This slide covers the dashboard for tracking vehicle efficiency after transport automation. It include KPIs such as truck turnaround time, average revenue per hour, truckload capacity, transit time, on time pickup, and average revenue per mile.
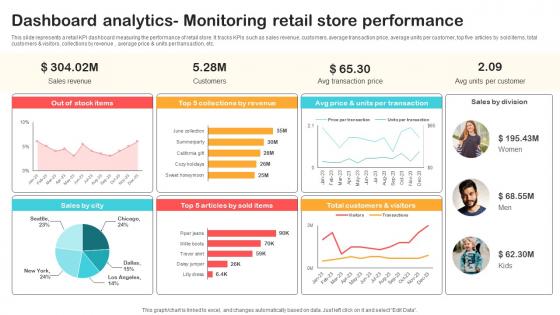
Dashboard Analytics Monitoring Retail Store Performance Optimizing Retail Operations With Digital DT SS V
This slide represents a retail KPI dashboard measuring the performance of retail store. It tracks KPIs such as sales revenue, customers, average transaction price, average units per customer, top five articles by sold items, total customers and visitors, collections by revenue , average price and units per transaction, etc.Are you in need of a template that can accommodate all of your creative concepts This one is crafted professionally and can be altered to fit any style. Use it with Google Slides or PowerPoint. Include striking photographs, symbols, depictions, and other visuals. Fill, move around, or remove text boxes as desired. Test out color palettes and font mixtures. Edit and save your work, or work with colleagues. Download Dashboard Analytics Monitoring Retail Store Performance Optimizing Retail Operations With Digital DT SS V and observe how to make your presentation outstanding. Give an impeccable presentation to your group and make your presentation unforgettable. This slide represents a retail KPI dashboard measuring the performance of retail store. It tracks KPIs such as sales revenue, customers, average transaction price, average units per customer, top five articles by sold items, total customers and visitors, collections by revenue , average price and units per transaction, etc.
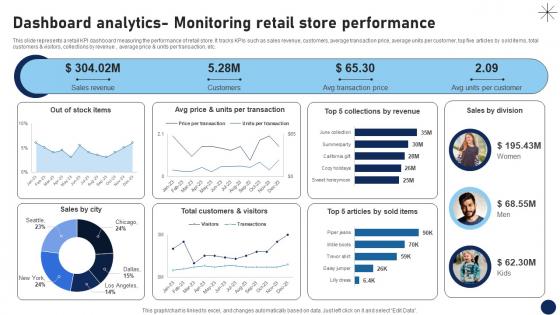
Dashboard Analytics Monitoring Retail Store Performance DT SS V
This slide represents a retail KPI dashboard measuring the performance of retail store. It tracks KPIs such as sales revenue, customers, average transaction price, average units per customer, top five articles by sold items, total customers and visitors, collections by revenue , average price and units per transaction, etc.Are you in need of a template that can accommodate all of your creative concepts This one is crafted professionally and can be altered to fit any style. Use it with Google Slides or PowerPoint. Include striking photographs, symbols, depictions, and other visuals. Fill, move around, or remove text boxes as desired. Test out color palettes and font mixtures. Edit and save your work, or work with colleagues. Download Dashboard Analytics Monitoring Retail Store Performance DT SS V and observe how to make your presentation outstanding. Give an impeccable presentation to your group and make your presentation unforgettable. This slide represents a retail KPI dashboard measuring the performance of retail store. It tracks KPIs such as sales revenue, customers, average transaction price, average units per customer, top five articles by sold items, total customers and visitors, collections by revenue , average price and units per transaction, etc.
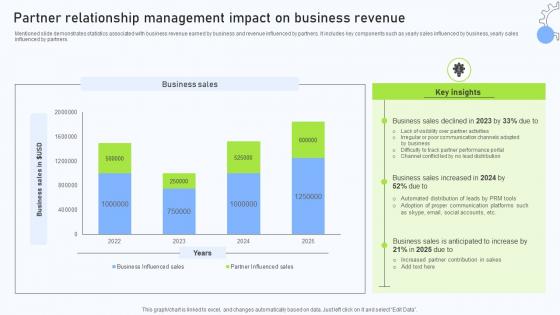
Relationship Management Automation Partner Relationship Management Impact
Mentioned slide demonstrates statistics associated with business revenue earned by business and revenue influenced by partners. It includes key components such as yearly sales influenced by business, yearly sales influenced by partners. Presenting this PowerPoint presentation, titled Relationship Management Automation Partner Relationship Management Impact, with topics curated by our researchers after extensive research. This editable presentation is available for immediate download and provides attractive features when used. Download now and captivate your audience. Presenting this Relationship Management Automation Partner Relationship Management Impact. Our researchers have carefully researched and created these slides with all aspects taken into consideration. This is a completely customizable Relationship Management Automation Partner Relationship Management Impact that is available for immediate downloading. Download now and make an impact on your audience. Highlight the attractive features available with our PPTs. Mentioned slide demonstrates statistics associated with business revenue earned by business and revenue influenced by partners. It includes key components such as yearly sales influenced by business, yearly sales influenced by partners.
Social Media Customer Service Tracking Dashboard Video Conferencing In Corporate Elements Pdf
This slide represents the social dashboard for tracking media customer service by covering the total number of requests and requests answered, total revenue, support costs rate to revenue rate, customer satisfaction, the average time to solve an issue, and so on. Presenting this PowerPoint presentation, titled Social Media Customer Service Tracking Dashboard Video Conferencing In Corporate Elements Pdf, with topics curated by our researchers after extensive research. This editable presentation is available for immediate download and provides attractive features when used. Download now and captivate your audience. Presenting this Social Media Customer Service Tracking Dashboard Video Conferencing In Corporate Elements Pdf. Our researchers have carefully researched and created these slides with all aspects taken into consideration. This is a completely customizable Social Media Customer Service Tracking Dashboard Video Conferencing In Corporate Elements Pdf that is available for immediate downloading. Download now and make an impact on your audience. Highlight the attractive features available with our PPTs. This slide represents the social dashboard for tracking media customer service by covering the total number of requests and requests answered, total revenue, support costs rate to revenue rate, customer satisfaction, the average time to solve an issue, and so on.
Social Media In Customer Support Social Media Customer Service Tracking Dashboard Structure Pdf
This slide represents the social dashboard for tracking media customer service by covering the total number of requests and requests answered, total revenue, support costs rate to revenue rate, customer satisfaction, the average time to solve an issue, and so on. This Social Media In Customer Support Social Media Customer Service Tracking Dashboard Structure Pdf from Slidegeeks makes it easy to present information on your topic with precision. It provides customization options, so you can make changes to the colors, design, graphics, or any other component to create a unique layout. It is also available for immediate download, so you can begin using it right away. Slidegeeks has done good research to ensure that you have everything you need to make your presentation stand out. Make a name out there for a brilliant performance. This slide represents the social dashboard for tracking media customer service by covering the total number of requests and requests answered, total revenue, support costs rate to revenue rate, customer satisfaction, the average time to solve an issue, and so on.
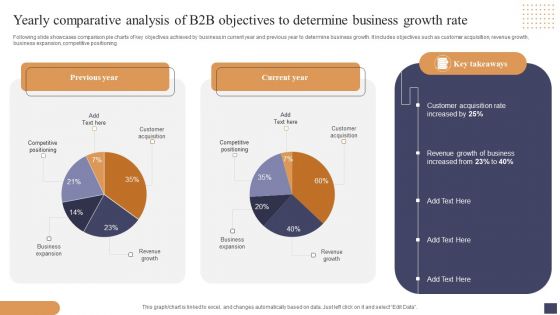
Yearly Comparative Analysis Of B2b Objectives To Determine Business Growth Rate Mockup PDF
Following slide showcases comparison pie charts of key objectives achieved by business in current year and previous year to determine business growth. It includes objectives such as customer acquisition, revenue growth, business expansion, competitive positioning. Showcasing this set of slides titled Yearly Comparative Analysis Of B2b Objectives To Determine Business Growth Rate Mockup PDF. The topics addressed in these templates are Customer Acquisition, Revenue Growth Business, Business Expansion. All the content presented in this PPT design is completely editable. Download it and make adjustments in color, background, font etc. as per your unique business setting.
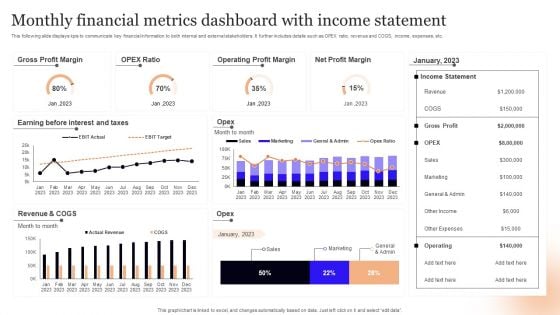
Monthly Financial Metrics Dashboard With Income Statement Infographics PDF
This following slide displays kpis to communicate key financial information to both internal and external stakeholders. It further includes details such as OPEX ratio, revenue and COGS, income, expenses, etc. Showcasing this set of slides titled Monthly Financial Metrics Dashboard With Income Statement Infographics PDF. The topics addressed in these templates are Gross Profit Margin, Taxes, Revenue. All the content presented in this PPT design is completely editable. Download it and make adjustments in color, background, font etc. as per your unique business setting.
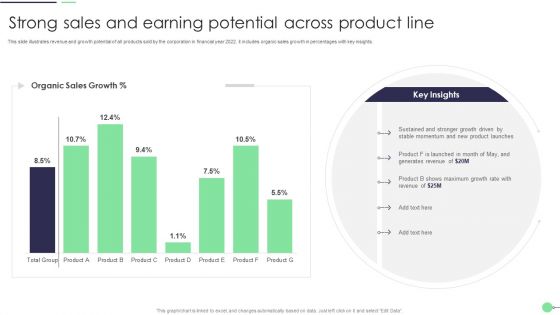
Strong Sales And Earning Potential Across Product Line Professional PDF
This slide illustrates revenue and growth potential of all products sold by the corporation in financial year 2022. it includes organic sales growth in percentages with key insights. Showcasing this set of slides titled Strong Sales And Earning Potential Across Product Line Professional PDF. The topics addressed in these templates are Product Launches, Generates Revenue, Growth Rate. All the content presented in this PPT design is completely editable. Download it and make adjustments in color, background, font etc. as per your unique business setting.
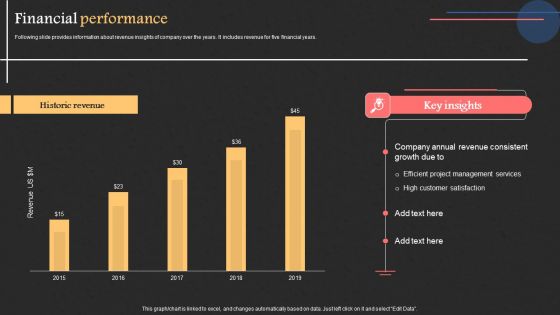
Project Management Software Capital Raising Deck Financial Performance Slides PDF
Following slide provides information about revenue insights of company over the years. It includes revenue for five financial years. This modern and well arranged Project Management Software Capital Raising Deck Financial Performance Slides PDF provides lots of creative possibilities. It is very simple to customize and edit with the Powerpoint Software. Just drag and drop your pictures into the shapes. All facets of this template can be edited with Powerpoint no extra software is necessary. Add your own material, put your images in the places assigned for them, adjust the colors, and then you can show your slides to the world, with an animated slide included.
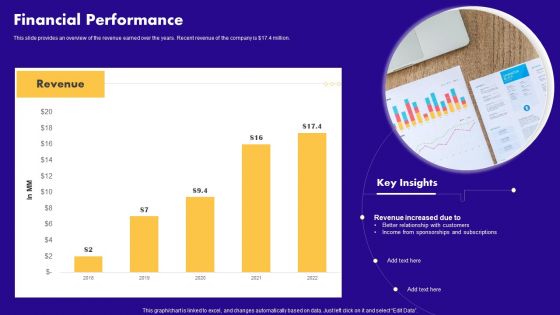
Audio Centric Firm Capital Raising Pitch Deck Financial Performance Guidelines PDF
This slide provides an overview of the revenue earned over the years. Recent revenue of the company is dollar 17.4 million. Crafting an eye catching presentation has never been more straightforward. Let your presentation shine with this tasteful yet straightforward Audio Centric Firm Capital Raising Pitch Deck Financial Performance Guidelines PDF template. It offers a minimalistic and classy look that is great for making a statement. The colors have been employed intelligently to add a bit of playfulness while still remaining professional. Construct the ideal Audio Centric Firm Capital Raising Pitch Deck Financial Performance Guidelines PDF that effortlessly grabs the attention of your audience Begin now and be certain to wow your customers.
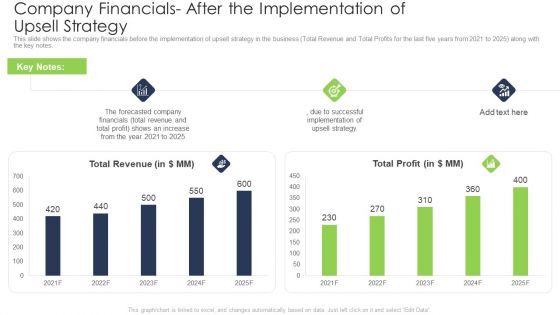
Company Financials After The Implementation Of Upsell Strategy Themes PDF
This slide shows the company financials before the implementation of upsell strategy in the business Total Revenue and Total Profits for the last five years from 2021 to 2025 along with the key notes. Deliver and pitch your topic in the best possible manner with this company financials after the implementation of upsell strategy themes pdf. Use them to share invaluable insights on revenue, financials, profit, strategy, implementation and impress your audience. This template can be altered and modified as per your expectations. So, grab it now.
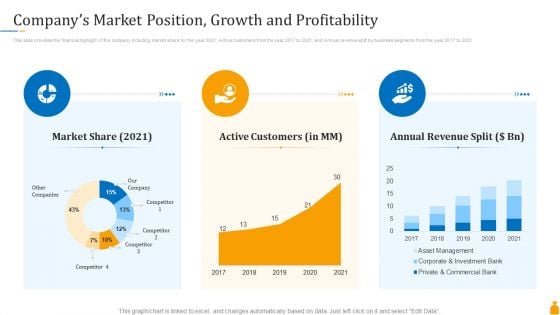
Financial Banking PPT Companys Market Position Growth And Profitability Portrait PDF
This slide provides the financial highlight of the company including market share for the year 2021, Active customers from the year 2017 to 2021, and Annual revenue split by business segments from the year 2017 to 2021. Deliver an awe-inspiring pitch with this creative financial banking ppt companys market position growth and profitability portrait pdf bundle. Topics like market share, active customers, annual revenue split can be discussed with this completely editable template. It is available for immediate download depending on the needs and requirements of the user.
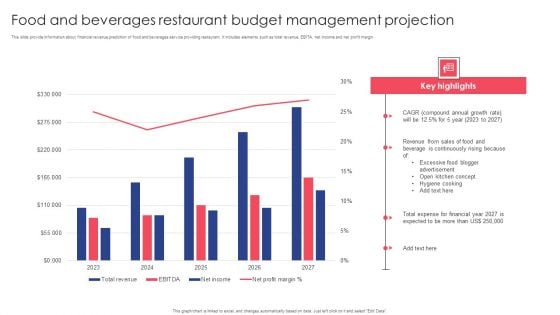
Food And Beverages Restaurant Budget Management Projection Brochure PDF
This slide provide information about financial revenue prediction of food and beverages service providing restaurant. It includes elements such as total revenue, EBITA, net income and net profit margin. Showcasing this set of slides titled Food And Beverages Restaurant Budget Management Projection Brochure PDF. The topics addressed in these templates are Compound Annual, Sales Food, Continuously Rising. All the content presented in this PPT design is completely editable. Download it and make adjustments in color, background, font etc. as per your unique business setting.
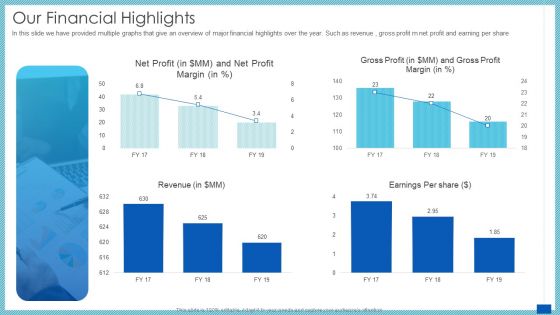
Evaluation Evolving Advanced Enterprise Development Marketing Tactics Our Financial Highlights Graphics PDF
In this slide we have provided multiple graphs that give an overview of major financial highlights over the year. Such as revenue , gross profit m net profit and earning per share. Deliver and pitch your topic in the best possible manner with this evaluation evolving advanced enterprise development marketing tactics our financial highlights graphics pdf. Use them to share invaluable insights on profit margin, revenue, earnings per share and impress your audience. This template can be altered and modified as per your expectations. So, grab it now.
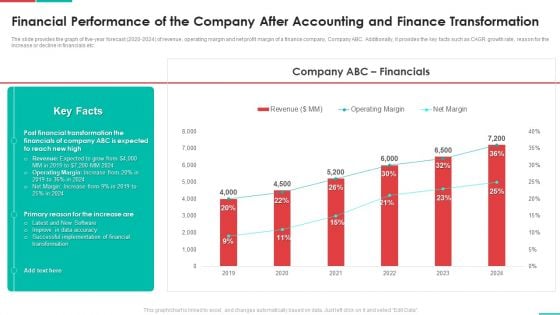
Roadmap For Financial Accounting Transformation Financial Performance Of The Company After Accounting Elements PDF
The slide provides the graph of five-year forecast 2020-2024 of revenue, operating margin and net profit margin of a finance company, Company ABC. Additionally, it provides the key facts such as CAGR growth rate, reason for the increase or decline in financials etc. Deliver and pitch your topic in the best possible manner with this roadmap for financial accounting transformation financial performance of the company after accounting elements pdf. Use them to share invaluable insights on implementation, financial, data accuracy, revenue and impress your audience. This template can be altered and modified as per your expectations. So, grab it now.
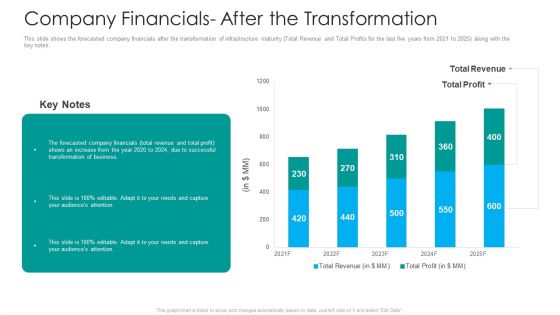
IT Facilities Maturity Framework For Strong Business Financial Position Company Financials After The Transformation Brochure PDF
This slide shows the forecasted company financials after the transformation of infrastructure maturity Total Revenue and Total Profits for the last five years from 2021 to 2025 along with the key notes. Deliver an awe inspiring pitch with this creative it facilities maturity framework for strong business financial position company financials after the transformation brochure pdf bundle. Topics like business, financials, revenue can be discussed with this completely editable template. It is available for immediate download depending on the needs and requirements of the user.
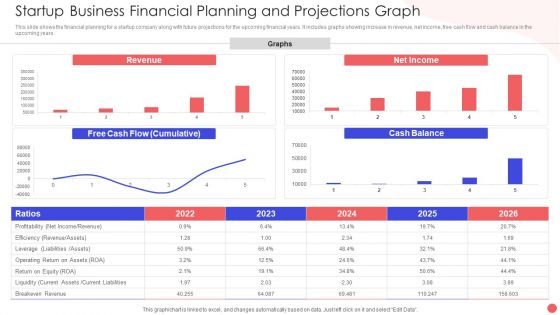
Startup Business Financial Planning And Projections Graph Slides PDF
This slide shows the financial planning for a startup company along with future projections for the upcoming financial years. It includes graphs showing increase in revenue, net income, free cash flow and cash balance in the upcoming years. Pitch your topic with ease and precision using this Startup Business Financial Planning And Projections Graph Slides PDF. This layout presents information on Revenue Graphs Operating, Free Cash Flow, Net Income Ration. It is also available for immediate download and adjustment. So, changes can be made in the color, design, graphics or any other component to create a unique layout.
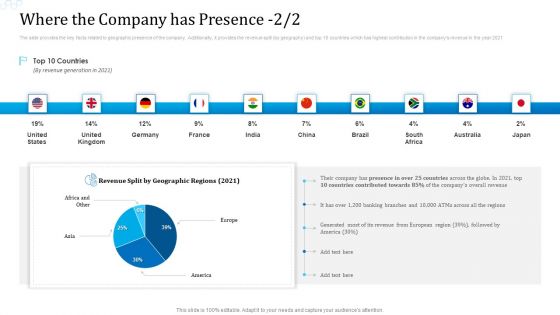
Investor Deck For Procuring Funds From Money Market Where The Company Has Presence Growth Introduction PDF
The slide provides the key facts related to geographic presence of the company. Additionally, it provides the revenue split by geography and top 10 countries which has highest contribution in the companys revenue in the year 2021. Deliver an awe inspiring pitch with this creative investor deck for procuring funds from money market where the company has presence growth introduction pdf bundle. Topics like where the company has presence can be discussed with this completely editable template. It is available for immediate download depending on the needs and requirements of the user.
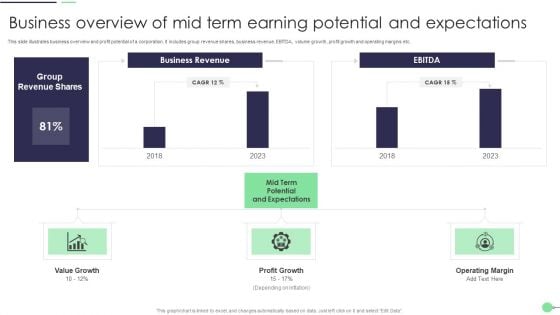
Business Overview Of Mid Term Earning Potential And Expectations Slides PDF
This slide illustrates business overview and profit potential of a corporation. It includes group revenue shares, business revenue, EBITDA, volume growth, profit growth and operating margins etc. Showcasing this set of slides titled Business Overview Of Mid Term Earning Potential And Expectations Slides PDF. The topics addressed in these templates are Value Growth, Profit Growth, Operating Margin. All the content presented in this PPT design is completely editable. Download it and make adjustments in color, background, font etc. as per your unique business setting.
Company Financials Performance Tracking Dashboard Brochure PDF
This slide illustrates KPI dashboard that can be used by organizations to track their financial performance on company basis. Kpis covered in the slide are contract status, revenue, cost of goods, overdue and task status. Showcasing this set of slides titled Company Financials Performance Tracking Dashboard Brochure PDF. The topics addressed in these templates are Report Shortcut, Revenue Cost, Overdue Task. All the content presented in this PPT design is completely editable. Download it and make adjustments in color, background, font etc. as per your unique business setting.
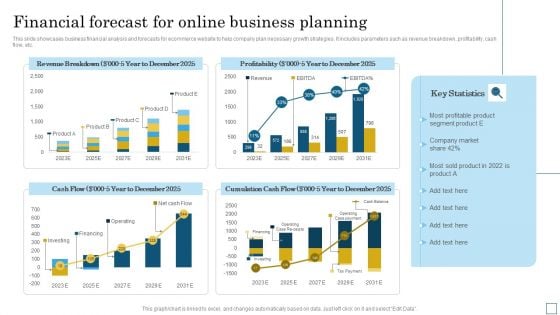
Financial Forecast For Online Business Planning Pictures PDF
This slide showcases business financial analysis and forecasts for ecommerce website to help company plan necessary growth strategies. It includes parameters such as revenue breakdown, profitability, cash flow, etc. Pitch your topic with ease and precision using this Financial Forecast For Online Business Planning Pictures PDF. This layout presents information on Cumulation Cash Flow, Profitability, Revenue Breakdown. It is also available for immediate download and adjustment. So, changes can be made in the color, design, graphics or any other component to create a unique layout.
Company Financials Before Digital Technology Adoption In Banking Industry Case Competition Icons PDF
This slide shows the company financials total revenue and total profits of ABC Bank. It includes the financials before the implementation of strategies for the years 2018 to 2022 with key notes.Deliver and pitch your topic in the best possible manner with this Company Financials Before Digital Technology Adoption In Banking Industry Case Competition Icons PDF Use them to share invaluable insights on Before The Implementation, Total Revenue, Total Profits and impress your audience. This template can be altered and modified as per your expectations. So, grab it now.
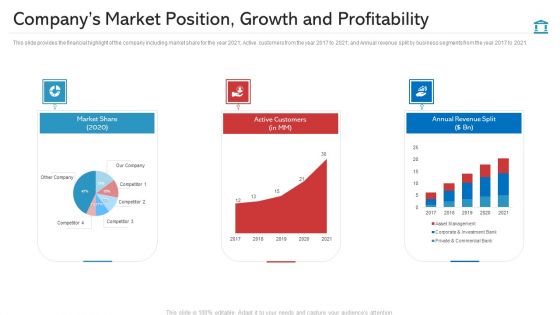
Companys Market Position Growth And Profitability Template PDF
This slide provides the financial highlight of the company including market share for the year 2021 Active customers from the year 2017 to 2021 and Annual revenue split by business segments from the year 2017 to 2021 Deliver and pitch your topic in the best possible manner with this companys market position growth and profitability template pdf. Use them to share invaluable insights on market share, active customers, annual revenue split and impress your audience. This template can be altered and modified as per your expectations. So, grab it now.
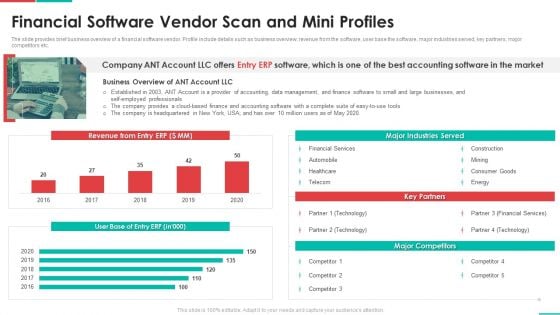
Roadmap For Financial Accounting Transformation Financial Software Vendor Scan And Mini Profiles Sample PDF
The slide provides brief business overview of a financial software vendor. Profile include details such as business overview, revenue from the software, user base the software, major industries served, key partners, major competitors etc. Deliver an awe inspiring pitch with this creative roadmap for financial accounting transformation financial software vendor scan and mini profiles sample pdf bundle. Topics like major industries served, key partners, major competitors, revenue from entry erp, user base of entry erp can be discussed with this completely editable template. It is available for immediate download depending on the needs and requirements of the user.


 Continue with Email

 Home
Home


