Revenue Chart
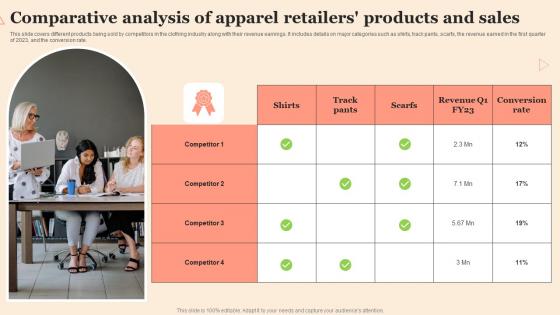
Comparative Analysis Of Apparel Retailers Products And Sales Clipart Pdf
This slide covers different products being sold by competitors in the clothing industry along with their revenue earnings. It includes details on major categories such as shirts, track pants, scarfs, the revenue earned in the first quarter of 2023, and the conversion rate. Pitch your topic with ease and precision using this Comparative Analysis Of Apparel Retailers Products And Sales Clipart Pdf This layout presents information on Comparative Analysis, Apparel Retailers, Products Sales It is also available for immediate download and adjustment. So, changes can be made in the color, design, graphics or any other component to create a unique layout. This slide covers different products being sold by competitors in the clothing industry along with their revenue earnings. It includes details on major categories such as shirts, track pants, scarfs, the revenue earned in the first quarter of 2023, and the conversion rate.
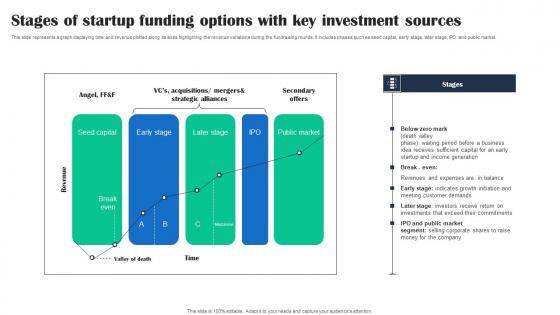
Stages Of Startup Funding Options With Key Investment Sources Formats Pdf
This slide represents a graph displaying time and revenue plotted along its axes highlighting the revenue variations during the fundraising rounds. It includes phases such as seed capital, early stage, later stage, IPO and public market. Showcasing this set of slides titled Stages Of Startup Funding Options With Key Investment Sources Formats Pdf. The topics addressed in these templates are Secondary Offers, Sources, Stages . All the content presented in this PPT design is completely editable. Download it and make adjustments in color, background, font etc. as per your unique business setting. This slide represents a graph displaying time and revenue plotted along its axes highlighting the revenue variations during the fundraising rounds. It includes phases such as seed capital, early stage, later stage, IPO and public market.
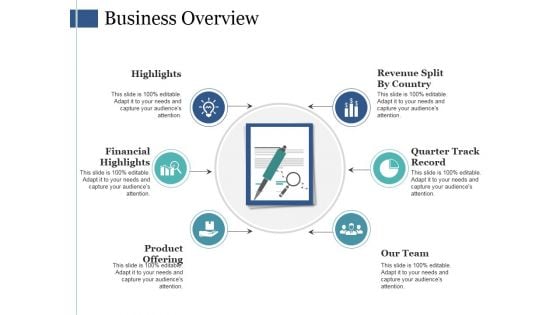
Business Overview Ppt PowerPoint Presentation Infographic Template Visuals
This is a business overview ppt powerpoint presentation infographic template visuals. This is a six stage process. The stages in this process are highlights, financial highlights, product offering, revenue split by country, quarter track record.
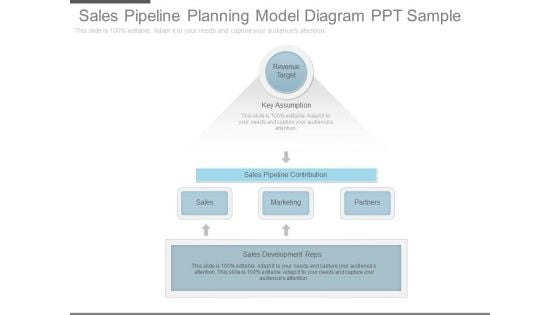
Sales Pipeline Planning Model Diagram Ppt Sample
This is a sales pipeline planning model diagram ppt sample. This is a one stage process. The stages in this process are revenue target, key assumption, sales pipeline contribution, sales, marketing, partners, sales development reps.
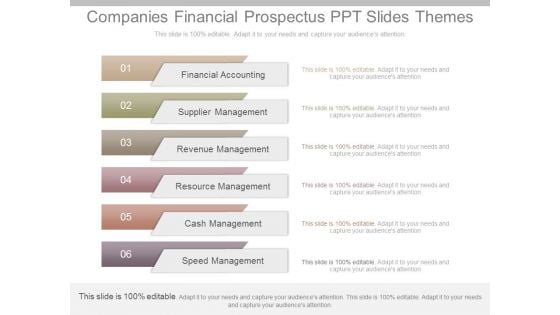
Companies Financial Prospectus Ppt Slides Themes
This is a companies financial prospectus ppt slides themes. This is a six stage process. The stages in this process are financial accounting, supplier management, revenue management, resource management, cash management, speed management.
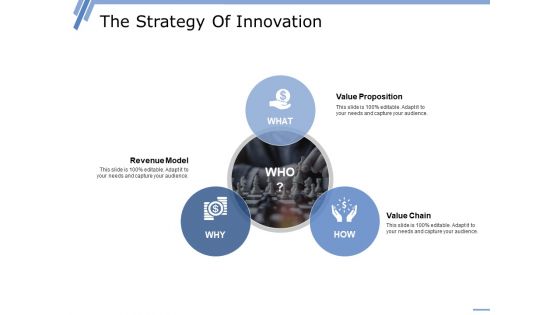
The Strategy Of Innovation Ppt PowerPoint Presentation Outline Display
This is a the strategy of innovation ppt powerpoint presentation outline display. This is a three stage process. The stages in this process are value proposition, value chain, revenue model.
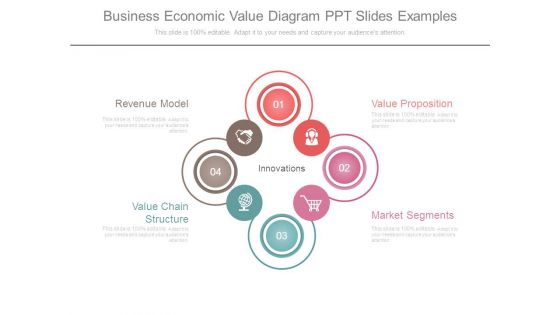
Business Economic Value Diagram Ppt Slides Examples
This is a business economic value diagram ppt slides examples. This is a four stage process. The stages in this process are revenue model, value chain structure, value proposition, market segments.
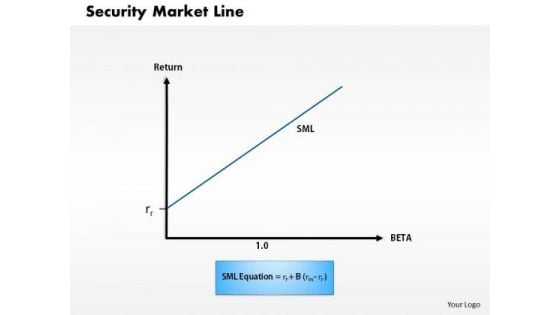
Business Framework Security Market Line 1 PowerPoint Presentation
This diagram displays graph of security market line. You can use line graph to plot changes in data over time, such as monthly revenue and earnings changes or daily changes in stock market prices.
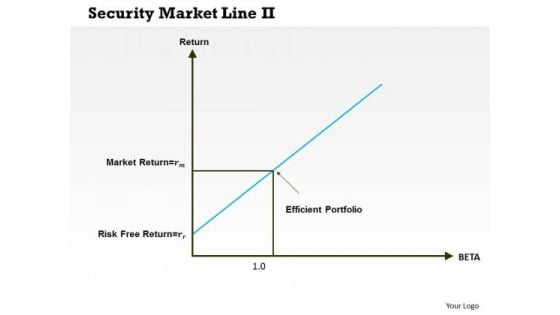
Business Framework Security Market Line 11 PowerPoint Presentation
This diagram displays graph of security market line. You can use line graph to plot changes in data over time, such as monthly revenue and earnings changes or daily changes in stock market prices.
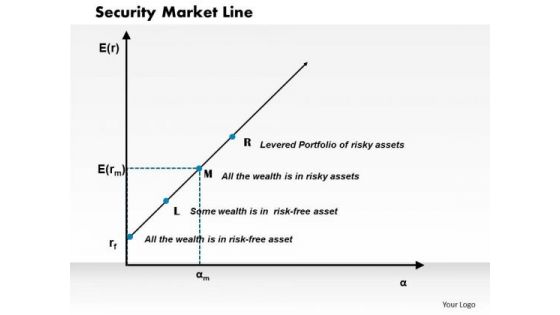
Business Framework Security Market Line PowerPoint Presentation
This diagram displays graph of security market line. You can use line graph to plot changes in data over time, such as monthly revenue and earnings changes or daily changes in stock market prices.
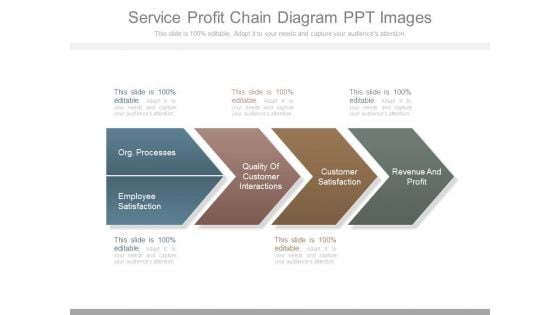
Service Profit Chain Diagram Ppt Images
This is a service profit chain diagram ppt images. This is a four stage process. The stages in this process are org processes, employee satisfaction, quality of customer interactions, customer satisfaction, revenue and profit.
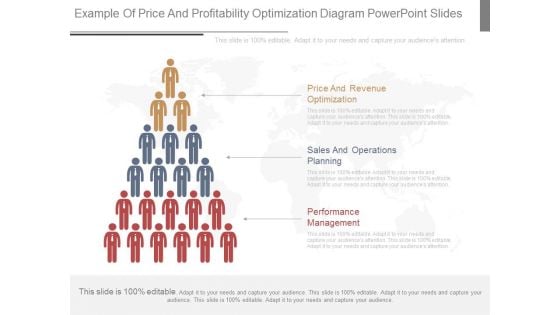
Example Of Price And Profitability Optimization Diagram Powerpoint Slides
This is a example of price and profitability optimization diagram powerpoint slides. This is a three stage process. The stages in this process are price and revenue optimization, sales and operations planning, performance management.
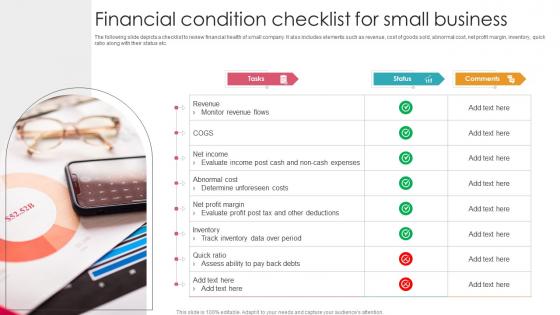
Financial Condition Checklist For Small Business Demonstration Pdf
The following slide depicts a checklist to review financial health of small company. It also includes elements such as revenue, cost of goods sold, abnormal cost, net profit margin, inventory, quick ratio along with their status etc. Pitch your topic with ease and precision using this Financial Condition Checklist For Small Business Demonstration Pdf. This layout presents information on Revenue, Monitor Revenue Flows, Evaluate Income Post. It is also available for immediate download and adjustment. So, changes can be made in the color, design, graphics or any other component to create a unique layout. The following slide depicts a checklist to review financial health of small company. It also includes elements such as revenue, cost of goods sold, abnormal cost, net profit margin, inventory, quick ratio along with their status etc.
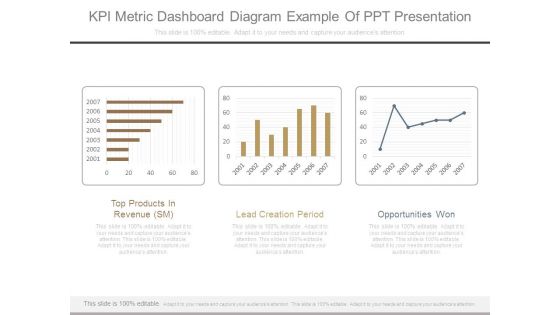
Kpi Metric Dashboard Diagram Example Of Ppt Presentation
This is a kpi metric dashboard diagram example of ppt presentation. This is a three stage process. The stages in this process are top products in revenue sm, lead creation period, opportunities won.
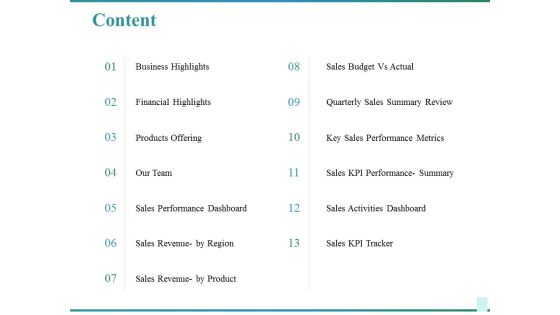
Content Ppt PowerPoint Presentation Infographics Diagrams
This is a content ppt powerpoint presentation infographics diagrams. This is a thirteen stage process. The stages in this process are business highlights, financial highlights, products offering, sales performance dashboard, sales revenue by region.
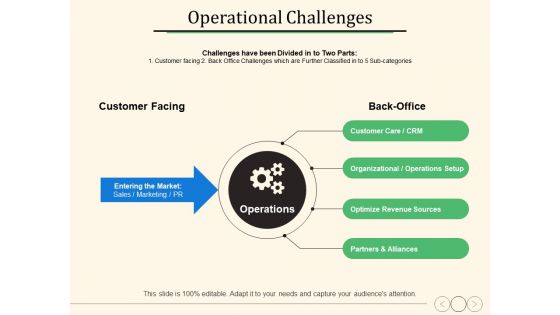
Operational Challenges Ppt PowerPoint Presentation Layouts Themes
This is a operational challenges ppt powerpoint presentation layouts themes. This is a four stage process. The stages in this process are optimize revenue sources, partners and alliances, business, management.
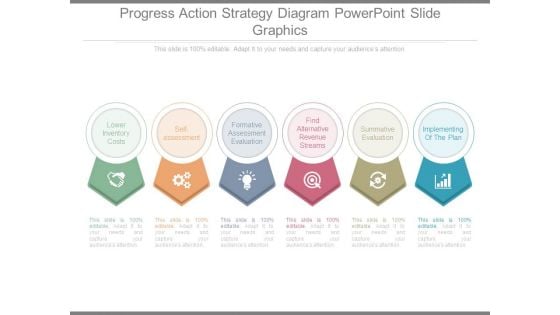
Progress Action Strategy Diagram Powerpoint Slide Graphics
This is a progress action strategy diagram powerpoint slide graphics. This is a six stage process. The stages in this process are lower inventory costs, self assessment, formative assessment evaluation, find alternative revenue streams, summative evaluation, implementing of the plan.

Business Metrics And Performance Diagram Presentation Images
This is a business metrics and performance diagram presentation images. This is a six stage process. The stages in this process are expense management, customer satisfaction, net income, revenue attainment, business metrics, turnover, productivity.
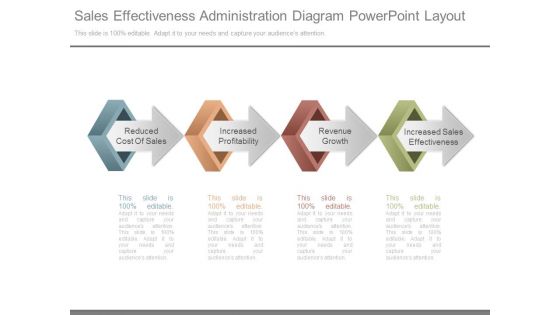
Sales Effectiveness Administration Diagram Powerpoint Layout
This is a sales effectiveness administration diagram powerpoint layout. This is a four stage process. The stages in this process are reduced cost of sales, increased profitability, revenue growth, increased sales effectiveness.
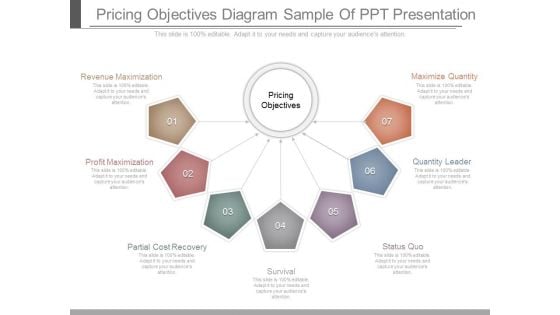
Pricing Objectives Diagram Sample Of Ppt Presentation
This is a pricing objectives diagram sample of ppt presentation. This is a seven stage process. The stages in this process are pricing objectives, revenue maximization, profit maximization, partial cost recovery, survival, status quo, quantity leader, maximize quantity.

Home Loans Services PowerPoint Templates And PowerPoint Themes 0912
Home Loans Services PowerPoint Templates And PowerPoint Themes 0912-Microsoft Powerpoint Templates and Background with home loans Start accelerating revenue growth with our Home Loans Services PowerPoint Templates And PowerPoint Themes 0912. They will make you look good.
Improving PPC Campaign Results Annual Sem Campaign Performance Plan Icons Pdf
The following slide showcases the yearly search engine marketing campaign performance plan to project results. It KPI such as revenue, pay-per-click, media spend, management fee, total cost, paid search revenue etc. Slidegeeks is one of the best resources for PowerPoint templates. You can download easily and regulate Improving PPC Campaign Results Annual Sem Campaign Performance Plan Icons Pdf for your personal presentations from our wonderful collection. A few clicks is all it takes to discover and get the most relevant and appropriate templates. Use our Templates to add a unique zing and appeal to your presentation and meetings. All the slides are easy to edit and you can use them even for advertisement purposes. The following slide showcases the yearly search engine marketing campaign performance plan to project results. It KPI such as revenue, pay-per-click, media spend, management fee, total cost, paid search revenue etc.
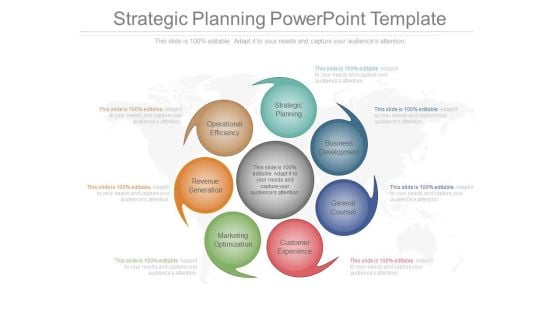
Strategic Planning Powerpoint Template
This is a strategic planning powerpoint template. This is a seven stage process. The stages in this process are strategic planning, business development, general counsel, customer experience, marketing optimization, revenue generation, operational efficiency.
Abstract Arrows Business PowerPoint Templates And PowerPoint Themes 0312
Microsoft Powerpoint Templates and Background with glossy arrows background Start accelerating revenue growth with our Abstract Arrows Business PowerPoint Templates And PowerPoint Themes 0312. They will make you look good.
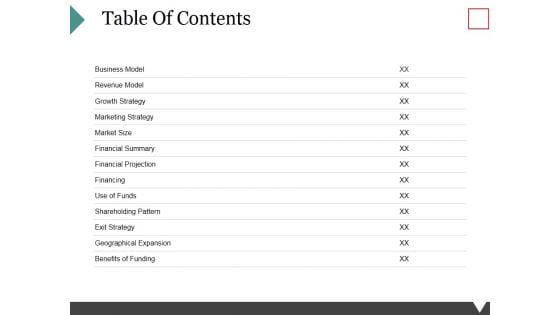
Table Of Contents Template 2 Ppt PowerPoint Presentation Infographic Template Slides
This is a table of contents template 2 ppt powerpoint presentation infographic template slides. This is a one stage process. The stages in this process are business model, revenue model, growth strategy, marketing strategy, market size.
Website Performance Review Template 2 Ppt PowerPoint Presentation Icon Design Ideas
This is a website performance review template 2 ppt powerpoint presentation icon design ideas. This is a four stage process. The stages in this process are column two, revenue trends, traffic sources.
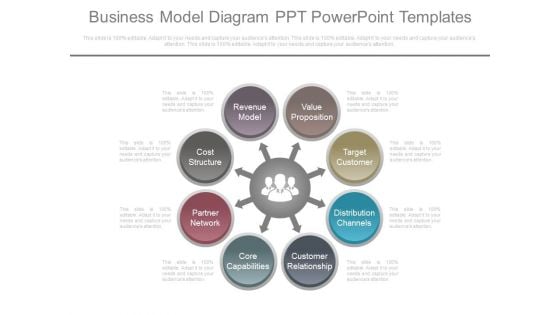
Business Model Diagram Ppt Powerpoint Templates
This is a business model diagram ppt powerpoint templates. This is a eight stage process. The stages in this process are partner network, cost structure, revenue model, value proposition, target customer, distribution channels, customer relationship, core capabilities.
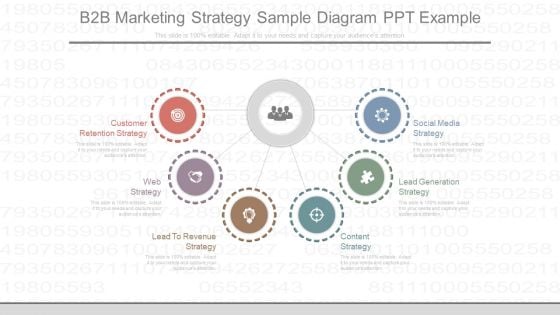
B2b Marketing Strategy Sample Diagram Ppt Example
This is a b2b marketing strategy sample diagram ppt example. This is a six stage process. The stages in this process are customer retention strategy, web strategy, lead to revenue strategy, content strategy, lead generation strategy, social media strategy.
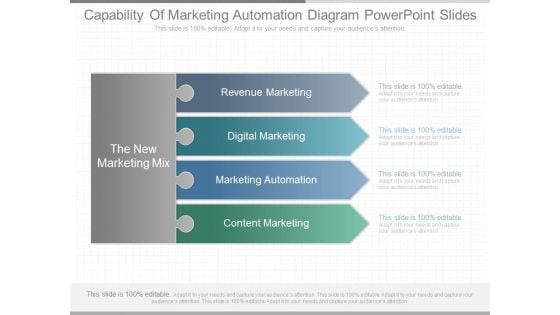
Capability Of Marketing Automation Diagram Powerpoint Slides
This is a capability of marketing automation diagram powerpoint slides. This is a four stage process. The stages in this process are the new marketing mix, revenue marketing, digital marketing, marketing automation, content marketing.
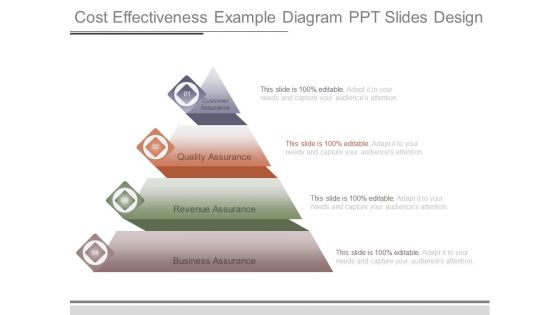
Cost Effectiveness Example Diagram Ppt Slides Design
This is a cost effectiveness example diagram ppt slides design. This is a four stage process. The stages in this process are customer assurance, quality assurance, revenue assurance, business assurance.
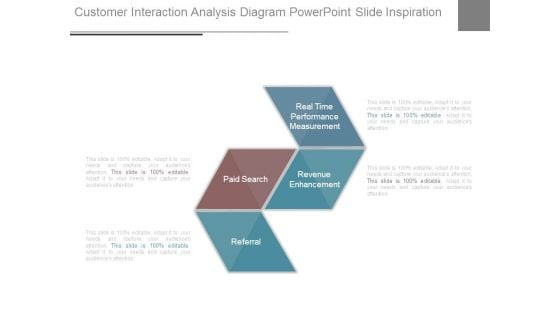
Customer Interaction Analysis Diagram Powerpoint Slide Inspiration
This is a customer interaction analysis diagram powerpoint slide inspiration. This is a four stage process. The stages in this process are referral, paid search, revenue enhancement, real time performance measurement.
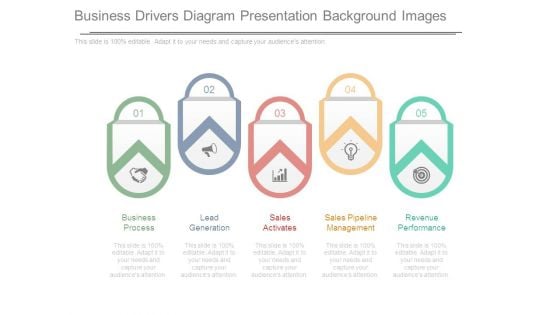
Business Drivers Diagram Presentation Background Images
This is a business drivers diagram presentation background images. This is a five stage process. The stages in this process are business process, lead generation, sales activates, sales pipeline management, revenue performance.
Amur Tiger PowerPoint Icon Cc
Amur Tiger (Panthera tigris altaica) looking to left of frame - landscape orientation Start accelerating revenue growth with our Amur Tiger PowerPoint Icon Cc. They will make you look good.
Statistics Showing Success Of Marketing Strategic Plan To Increase Film Ppt Sample Strategy SS V
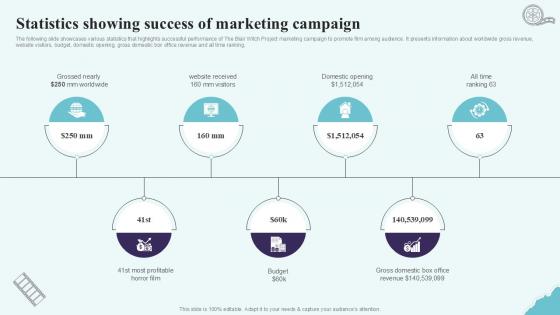
The following slide showcases various statistics that highlights successful performance of The Blair Witch Project marketing campaign to promote film among audience. It presents information about worldwide gross revenue, website visitors, budget, domestic opening, gross domestic box office revenue and all time ranking. If your project calls for a presentation, then Slidegeeks is your go-to partner because we have professionally designed, easy-to-edit templates that are perfect for any presentation. After downloading, you can easily edit Statistics Showing Success Of Marketing Strategic Plan To Increase Film Ppt Sample Strategy SS V and make the changes accordingly. You can rearrange slides or fill them with different images. Check out all the handy templates The following slide showcases various statistics that highlights successful performance of The Blair Witch Project marketing campaign to promote film among audience. It presents information about worldwide gross revenue, website visitors, budget, domestic opening, gross domestic box office revenue and all time ranking.
Internet Marketing Objectives Ppt PowerPoint Presentation Portfolio Summary
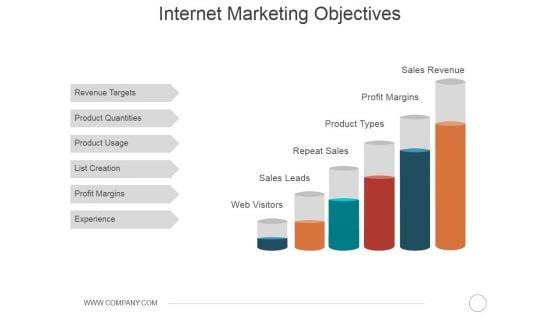
This is a internet marketing objectives ppt powerpoint presentation portfolio summary. This is a six stage process. The stages in this process are revenue targets, product quantities, product usage, list creation, profit margins, experience.
Overview And Benefits Of Ecommerce Internet Based Trade Structure Ppt Slide
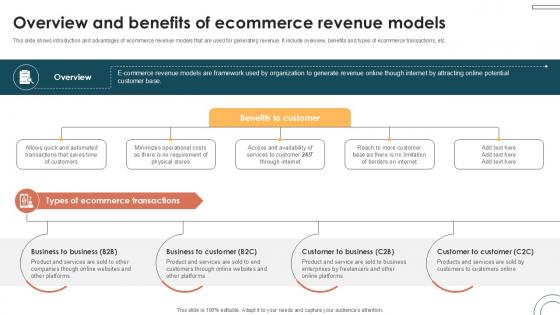
This slide shows introduction and advantages of ecommerce revenue models that are used for generating revenue. It include overview, benefits and types of ecommerce transactions, etc. Do you know about Slidesgeeks Overview And Benefits Of Ecommerce Internet Based Trade Structure Ppt Slide These are perfect for delivering any kind od presentation. Using it, create PowerPoint presentations that communicate your ideas and engage audiences. Save time and effort by using our pre-designed presentation templates that are perfect for a wide range of topic. Our vast selection of designs covers a range of styles, from creative to business, and are all highly customizable and easy to edit. Download as a PowerPoint template or use them as Google Slides themes. This slide shows introduction and advantages of ecommerce revenue models that are used for generating revenue. It include overview, benefits and types of ecommerce transactions, etc.
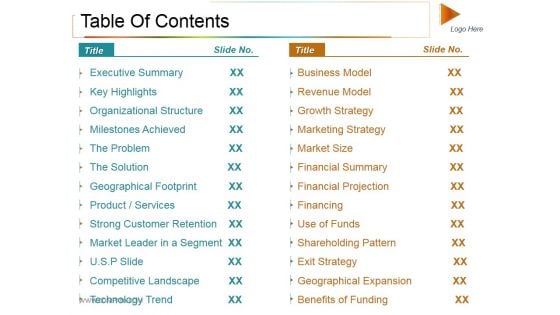
Table Of Contents Ppt PowerPoint Presentation Outline Ideas
This is a table of contents ppt powerpoint presentation outline ideas. This is a two stage process. The stages in this process are executive summary, key highlights, business model, revenue model.
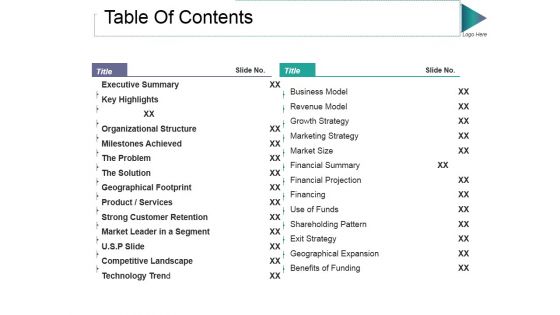
Table Of Contents Ppt PowerPoint Presentation Infographics Layouts
This is a table of contents ppt powerpoint presentation infographics layouts. This is a two stage process. The stages in this process are business model, revenue model, the problem, the solution, exit strategy.
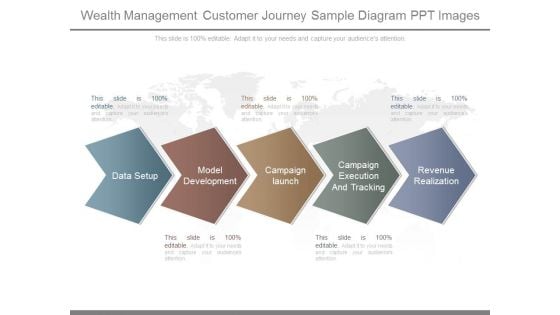
Wealth Management Customer Journey Sample Diagram Ppt Images
This is a wealth management customer journey sample diagram ppt images. This is a five stage process. The stages in this process are data setup, model development, campaign launch, campaign execution and tracking, revenue realization.
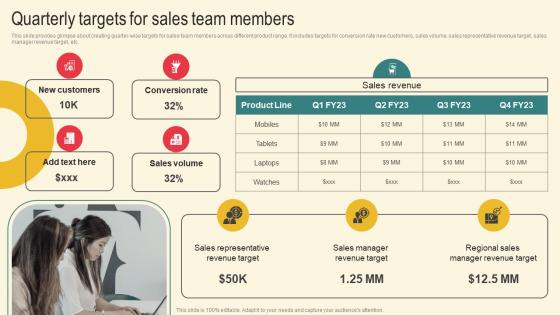
Quarterly Targets Sales Marketing Plan For Boosting Client Retention In Retail Banking Infographics Pdf
This slide provides glimpse about creating quarter wise targets for sales team members across different product range. It includes targets for conversion rate new customers, sales volume, sales representative revenue target, sales manager revenue target, etc. Take your projects to the next level with our ultimate collection of Quarterly Targets Sales Marketing Plan For Boosting Client Retention In Retail Banking Infographics Pdf. Slidegeeks has designed a range of layouts that are perfect for representing task or activity duration, keeping track of all your deadlines at a glance. Tailor these designs to your exact needs and give them a truly corporate look with your own brand colors they will make your projects stand out from the rest This slide provides glimpse about creating quarter wise targets for sales team members across different product range. It includes targets for conversion rate new customers, sales volume, sales representative revenue target, sales manager revenue target, etc.
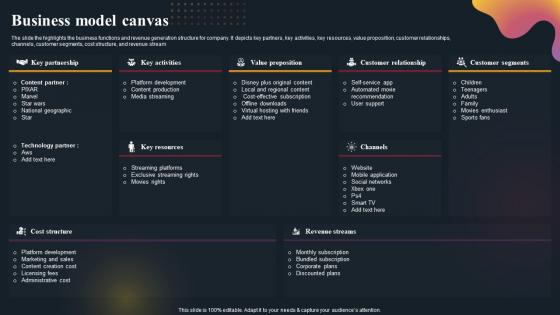
Business Model Canvas OTT Platform Company Outline Ideas Pdf
The slide the highlights the business functions and revenue generation structure for company. It depicts key partners, key activities, key resources, value proposition, customer relationships, channels, customer segments, cost structure, and revenue stream. Create an editable Business Model Canvas OTT Platform Company Outline Ideas Pdf that communicates your idea and engages your audience. Whether you are presenting a business or an educational presentation, pre-designed presentation templates help save time. Business Model Canvas OTT Platform Company Outline Ideas Pdf is highly customizable and very easy to edit, covering many different styles from creative to business presentations. Slidegeeks has creative team members who have crafted amazing templates. So, go and get them without any delay. The slide the highlights the business functions and revenue generation structure for company. It depicts key partners, key activities, key resources, value proposition, customer relationships, channels, customer segments, cost structure, and revenue stream.

Working Framework Of Indirect Internet Based Trade Structure Ppt Powerpoint
This slide shows working flow of sales based revenue model to generate revenue though online platforms. It include components such as manufacturer , wholesaler , ecommerce platform and consumer. This Working Framework Of Indirect Internet Based Trade Structure Ppt Powerpoint from Slidegeeks makes it easy to present information on your topic with precision. It provides customization options, so you can make changes to the colors, design, graphics, or any other component to create a unique layout. It is also available for immediate download, so you can begin using it right away. Slidegeeks has done good research to ensure that you have everything you need to make your presentation stand out. Make a name out there for a brilliant performance. This slide shows working flow of sales based revenue model to generate revenue though online platforms. It include components such as manufacturer , wholesaler , ecommerce platform and consumer.
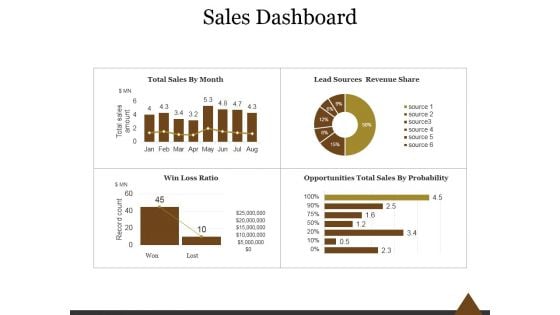
Sales Dashboard Template 2 Ppt PowerPoint Presentation Introduction
This is a sales dashboard template 2 ppt powerpoint presentation introduction. This is a four stage process. The stages in this process are total sales by month, lead sources revenue share, win loss ratio, opportunities total sales by probability.
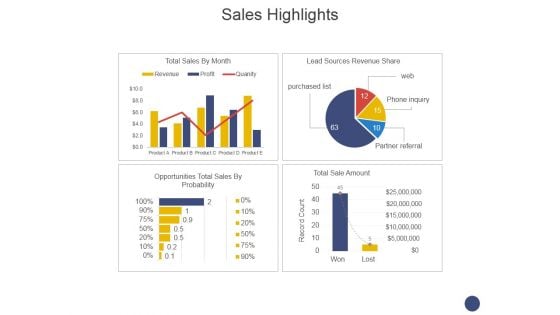
Sales Highlights Ppt PowerPoint Presentation Gallery Tips
This is a sales highlights ppt powerpoint presentation gallery tips. This is a four stage process. The stages in this process are opportunities total sales by probability, lead sources revenue share, total sales by month, total sale amount.
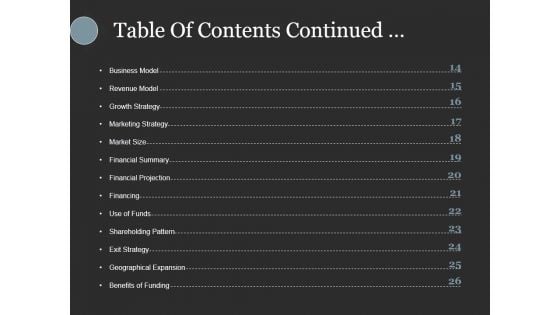
Table Of Contents Continued Ppt PowerPoint Presentation Inspiration Slides
This is a table of contents continued ppt powerpoint presentation inspiration slides. This is a fourteen stage process. The stages in this process are business model, revenue model, growth strategy, marketing strategy, market size.
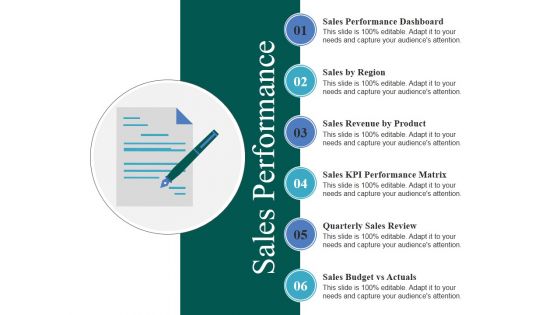
Sales Performance Ppt PowerPoint Presentation Infographics Visuals
This is a sales performance ppt powerpoint presentation infographics visuals. This is a six stage process. The stages in this process are sales by region, sales revenue by product, sales kpi performance matrix, quarterly sales review, sales budget vs actuals.
Sales Performance Ppt PowerPoint Presentation Visual Aids Icon
This is a sales performance ppt powerpoint presentation visual aids icon. This is a six stage process. The stages in this process are quarterly sales review, sales performance dashboard, sales by region, sales revenue by product.
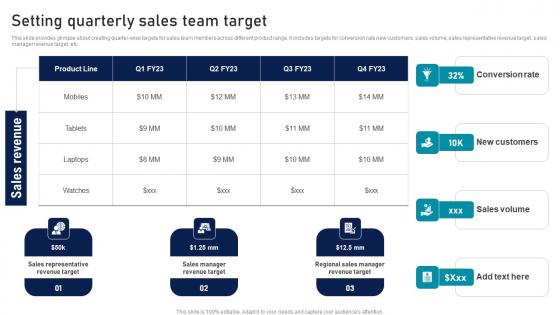
Setting Quarterly Sales Team Target Strategic Sales Plan To Enhance Portrait Pdf
This slide provides glimpse about creating quarter-wise targets for sales team members across different product range. It includes targets for conversion rate new customers, sales volume, sales representative revenue target, sales manager revenue target, etc. Take your projects to the next level with our ultimate collection of Setting Quarterly Sales Team Target Strategic Sales Plan To Enhance Portrait Pdf. Slidegeeks has designed a range of layouts that are perfect for representing task or activity duration, keeping track of all your deadlines at a glance. Tailor these designs to your exact needs and give them a truly corporate look with your own brand colors they well make your projects stand out from the rest. This slide provides glimpse about creating quarter-wise targets for sales team members across different product range. It includes targets for conversion rate new customers, sales volume, sales representative revenue target, sales manager revenue target, etc.
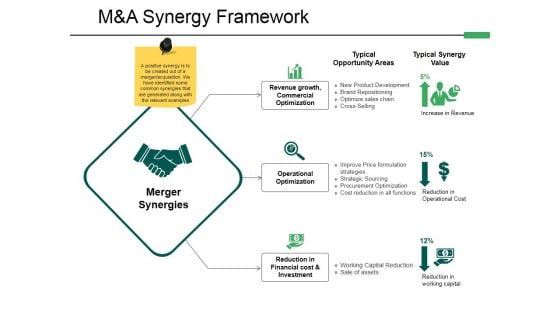
M And A Synergy Framework Ppt PowerPoint Presentation Professional Graphics
This is a m and a synergy framework ppt powerpoint presentation professional graphics. This is a three stage process. The stages in this process are revenue growth, commercial optimization, operational optimization, reduction in financial cost investment.

Business Model Investor Funding Elevator Pitch Deck For Online Learning Platform
This slide covers companys business model covering value propositions, partners, activities, resources, channels and revenue streams. The purpose of this template is to provide an overview on revenue generating business activities along with resources such as platforms, network, technology, etc. Boost your pitch with our creative Business Model Investor Funding Elevator Pitch Deck For Online Learning Platform. Deliver an awe-inspiring pitch that will mesmerize everyone. Using these presentation templates you will surely catch everyones attention. You can browse the ppts collection on our website. We have researchers who are experts at creating the right content for the templates. So you do not have to invest time in any additional work. Just grab the template now and use them. This slide covers companys business model covering value propositions, partners, activities, resources, channels and revenue streams. The purpose of this template is to provide an overview on revenue generating business activities along with resources such as platforms, network, technology, etc.
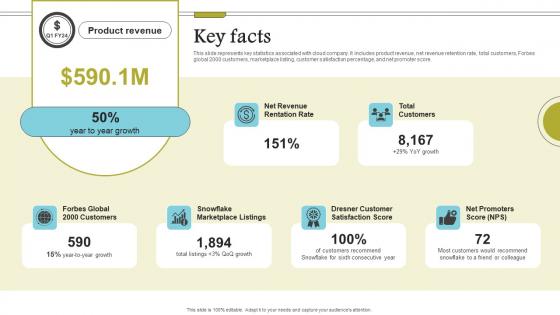
Key Facts Cloud Data Computing Company Fund Raising Mockup PDF
This slide represents key statistics associated with cloud company. It includes product revenue, net revenue retention rate, total customers, Forbes global 2000 customers, marketplace listing, customer satisfaction percentage, and net promoter score. If your project calls for a presentation, then Slidegeeks is your go-to partner because we have professionally designed, easy-to-edit templates that are perfect for any presentation. After downloading, you can easily edit Key Facts Cloud Data Computing Company Fund Raising Mockup PDF and make the changes accordingly. You can rearrange slides or fill them with different images. Check out all the handy templates This slide represents key statistics associated with cloud company. It includes product revenue, net revenue retention rate, total customers, Forbes global 2000 customers, marketplace listing, customer satisfaction percentage, and net promoter score.
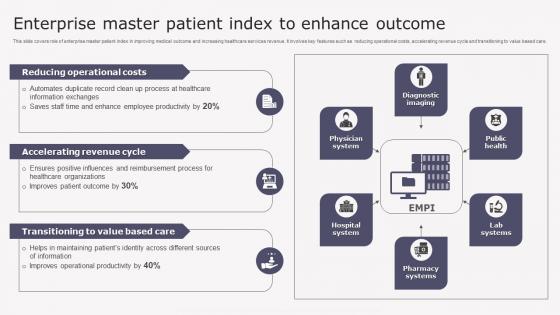
Enterprise Master Patient Index Transforming Medicare Services Using Health Sample Pdf
This slide covers role of enterprise master patient index in improving medical outcome and increasing healthcare services revenue. It involves key features such as reducing operational costs, accelerating revenue cycle and transitioning to value based care. From laying roadmaps to briefing everything in detail, our templates are perfect for you. You can set the stage with your presentation slides. All you have to do is download these easy to edit and customizable templates. Enterprise Master Patient Index Transforming Medicare Services Using Health Sample Pdf will help you deliver an outstanding performance that everyone would remember and praise you for. Do download this presentation today. This slide covers role of enterprise master patient index in improving medical outcome and increasing healthcare services revenue. It involves key features such as reducing operational costs, accelerating revenue cycle and transitioning to value based care.
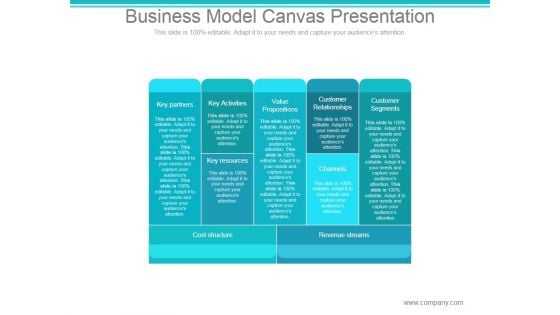
Business Model Canvas Ppt PowerPoint Presentation Tips
This is a business model canvas ppt powerpoint presentation tips. This is a five stage process. The stages in this process are key partners, key activities, value propositions, customer relationships, customer segments, key resources, channels, cost structure, revenue streams.
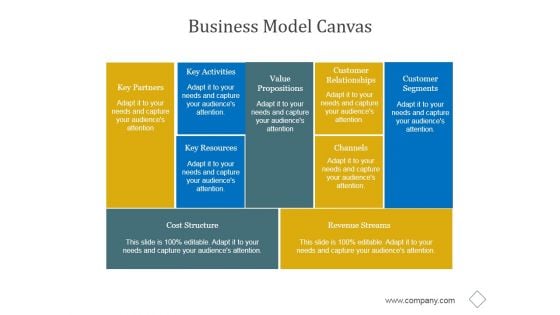
Business Model Canvas Ppt PowerPoint Presentation Picture
This is a business model canvas ppt powerpoint presentation picture. This is a five stage process. The stages in this process are key partners, key activities, value, propositions, customer, relationships, customer segments, key resources, channels, cost structure, revenue streams.
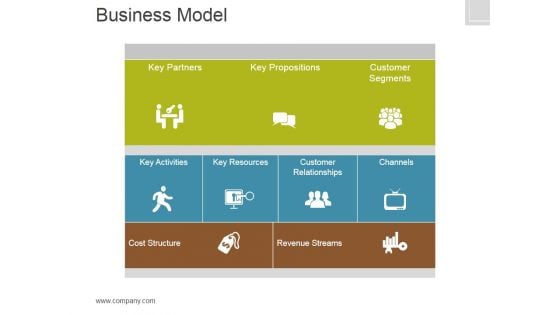
Business Model Template 3 Ppt PowerPoint Presentation Deck
This is a business model template 3 ppt powerpoint presentation deck. This is a three stage process. The stages in this process are key partners, key propositions, customer segments, key activities, key resources, customer relationships, channels, cost structure, revenue streams.
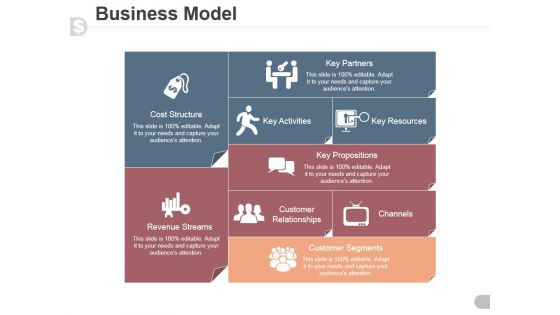
Business Model Template 3 Ppt PowerPoint Presentation Guide
This is a business model template 3 ppt powerpoint presentation guide. This is a five stage process. The stages in this process are cost structure, revenue streams, key activities, key partners, key resources, key propositions, customer relationships, customer segments.
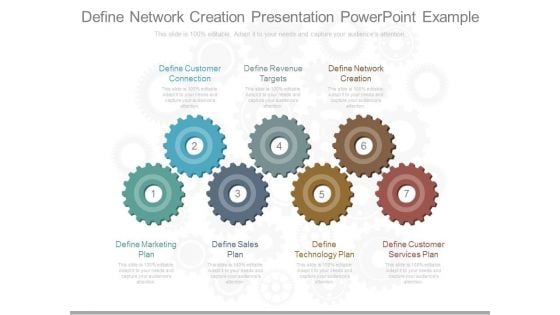
Define Network Creation Presentation Powerpoint Example
This is a define network creation presentation powerpoint example. This is a seven stage process. The stages in this process are define customer connection, define revenue targets, define network creation, define marketing plan, define technology plan, define customer services plan.\n\n\n\n

Business Model Framework Powerpoint Guide
This is a business model framework powerpoint guide. This is a five stage process. The stages in this process are channels, key resources, key partners, key activities, value propositions, customer relationships, customer segments, cost structure, revenue streams.
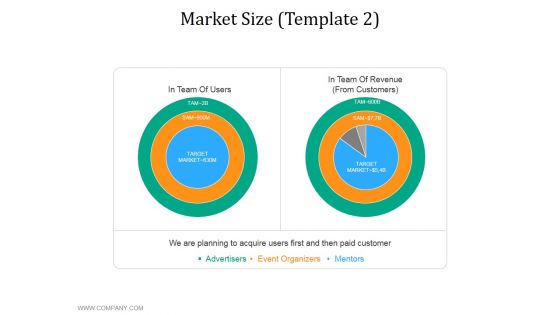
Market Size Template 2 Ppt PowerPoint Presentation Outline Rules
This is a market size template 2 ppt powerpoint presentation outline rules. This is a two stage process. The stages in this process are in team of users, in team of revenue from customers, advertisers, event organizers, mentors.
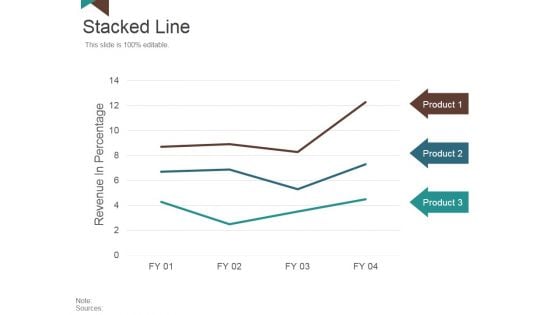
Stacked Line Ppt PowerPoint Presentation Professional Graphics
This is a stacked line ppt powerpoint presentation professional graphics. This is a three stage process. The stages in this process are revenue in percentage, product, business, marketing, success.


 Continue with Email

 Home
Home


