Revenue Comparison
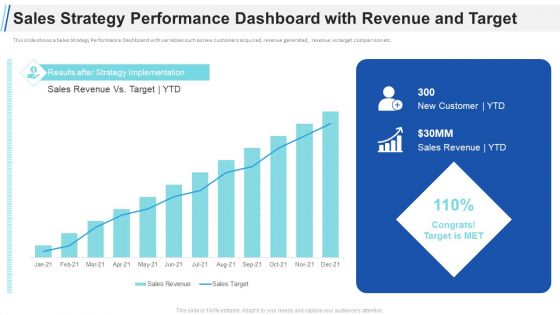
Maximizing Profitability Earning Through Sales Initiatives Sales Strategy Performance Dashboard With Revenue And Target Elements PDF
This slide shows a Sales Strategy Performance Dashboard with variables such as new customers acquired, revenue generated, revenue vs target comparison etc. Deliver and pitch your topic in the best possible manner with this maximizing profitability earning through sales initiatives sales strategy performance dashboard with revenue and target elements pdf. Use them to share invaluable insights on sales strategy performance dashboard with revenue and target and impress your audience. This template can be altered and modified as per your expectations. So, grab it now.
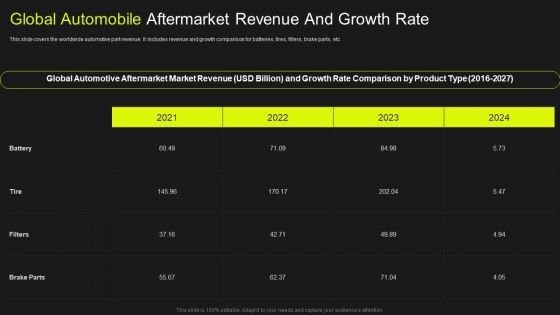
Global Automobile Market Analysis Global Automobile Aftermarket Revenue And Growth Rate Sample PDF
This slide covers the worldwide automotive part revenue. It includes revenue and growth comparison for batteries, tires, filters, brake parts, etc. Take your projects to the next level with our ultimate collection of Global Automobile Market Analysis Global Automobile Aftermarket Revenue And Growth Rate Sample PDF. Slidegeeks has designed a range of layouts that are perfect for representing task or activity duration, keeping track of all your deadlines at a glance. Tailor these designs to your exact needs and give them a truly corporate look with your own brand colors they Will make your projects stand out from the rest.
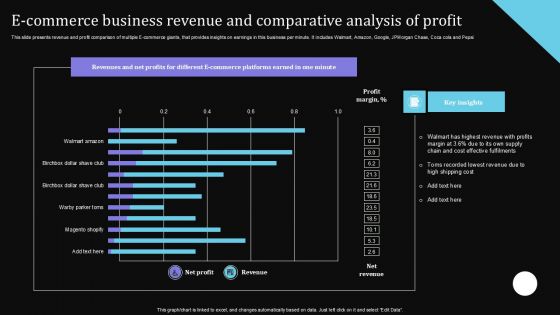
E Commerce Business Revenue And Comparative Analysis Of Profit Topics PDF
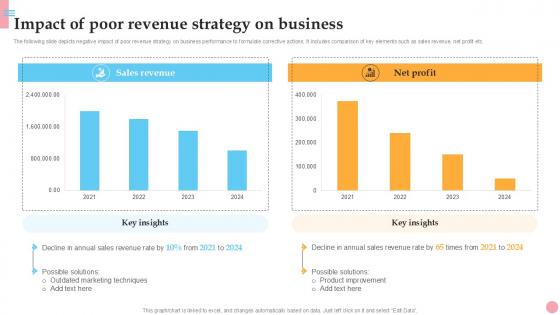
Impact Of Poor Revenue Strategy How To Improve Company PPT Presentation Strategy SS V
The following slide depicts negative impact of poor revenue strategy on business performance to formulate corrective actions. It includes comparison of key elements such as sales revenue, net profit etc. Make sure to capture your audiences attention in your business displays with our gratis customizable Impact Of Poor Revenue Strategy How To Improve Company PPT Presentation Strategy SS V. These are great for business strategies, office conferences, capital raising or task suggestions. If you desire to acquire more customers for your tech business and ensure they stay satisfied, create your own sales presentation with these plain slides. The following slide depicts negative impact of poor revenue strategy on business performance to formulate corrective actions. It includes comparison of key elements such as sales revenue, net profit etc.
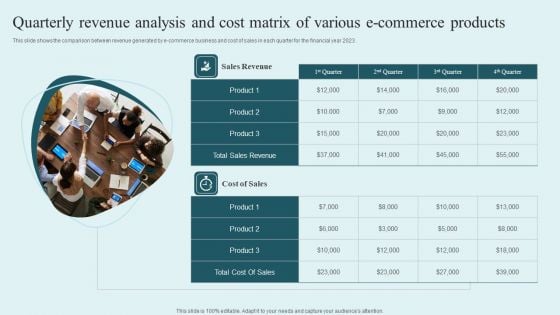
Quarterly Revenue Analysis And Cost Matrix Of Various E Commerce Products Template PDF
This slide shows the comparison between revenue generated by e-commerce business and cost of sales in each quarter for the financial year 2023. Presenting Quarterly Revenue Analysis And Cost Matrix Of Various E Commerce Products Template PDF to dispense important information. This template comprises two stages. It also presents valuable insights into the topics including Sales Revenue, Cost Sales, Total Sales Revenue. This is a completely customizable PowerPoint theme that can be put to use immediately. So, download it and address the topic impactfully.

6 Year Revenue Declining Graph Ppt PowerPoint Presentation Outline Sample PDF
This slide shows the revenues of the company over the last years to have a clear idea of organization growth and financial status . It includes the 6 year 2017 to 2022 revenue earned by the company.Showcasing this set of slides titled 6 Year Revenue Declining Graph Ppt PowerPoint Presentation Outline Sample PDF. The topics addressed in these templates are Revenue Company, Highest Comparison, Conditions Restrictions. All the content presented in this PPT design is completely editable. Download it and make adjustments in color, background, font etc. as per your unique business setting.
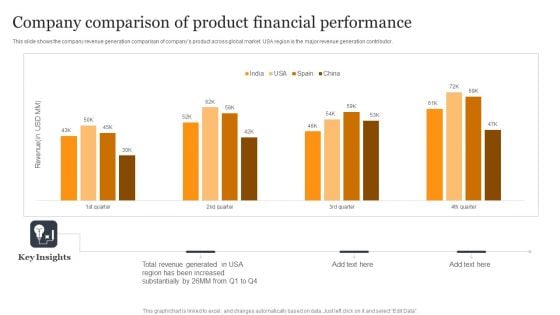
Company Comparison Of Product Financial Performance Summary PDF
This slide shows the company revenue generation comparison of companys product across global market. USA region is the major revenue generation contributor. Showcasing this set of slides titled Company Comparison Of Product Financial Performance Summary PDF. The topics addressed in these templates are Revenue Generated, Region Increased, Substantially. All the content presented in this PPT design is completely editable. Download it and make adjustments in color, background, font etc. as per your unique business setting.
Global Automotive Aftermarket Revenue Global Automotive Manufacturing Market Analysis Icons PDF
This slide covers the worldwide automotive part revenue. It includes revenue and growth comparison for batteries, tires, filters, brake parts, etc. Here you can discover an assortment of the finest PowerPoint and Google Slides templates. With these templates, you can create presentations for a variety of purposes while simultaneously providing your audience with an eye-catching visual experience. Download Global Automotive Aftermarket Revenue Global Automotive Manufacturing Market Analysis Icons PDF to deliver an impeccable presentation. These templates will make your job of preparing presentations much quicker, yet still, maintain a high level of quality. Slidegeeks has experienced researchers who prepare these templates and write high-quality content for you. Later on, you can personalize the content by editing the Global Automotive Aftermarket Revenue Global Automotive Manufacturing Market Analysis Icons PDF.
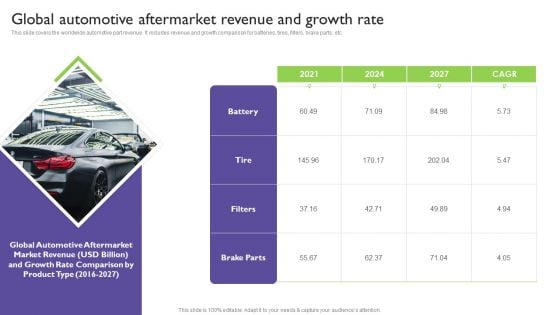
Global Automotive Industry Analysis Global Automotive Aftermarket Revenue And Growth Rate Clipart PDF
This slide covers the worldwide automotive part revenue. It includes revenue and growth comparison for batteries, tires, filters, brake parts, etc. Do you have to make sure that everyone on your team knows about any specific topic I yes, then you should give Global Automotive Industry Analysis Global Automotive Aftermarket Revenue And Growth Rate Clipart PDF a try. Our experts have put a lot of knowledge and effort into creating this impeccable Global Automotive Industry Analysis Global Automotive Aftermarket Revenue And Growth Rate Clipart PDF. You can use this template for your upcoming presentations, as the slides are perfect to represent even the tiniest detail. You can download these templates from the Slidegeeks website and these are easy to edit. So grab these today.
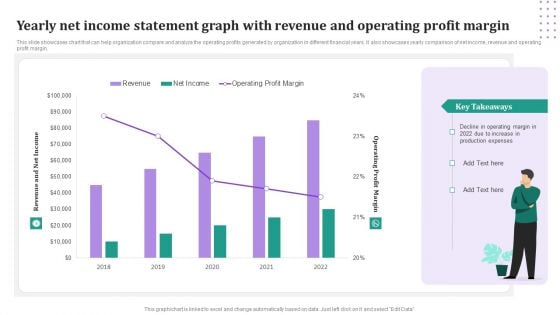
Yearly Net Income Statement Graph With Revenue And Operating Profit Margin Download PDF
This slide showcases chart that can help organization compare and analyze the operating profits generated by organization in different financial years. It also showcases yearly comparison of net income, revenue and operating profit margin. Pitch your topic with ease and precision using this Yearly Net Income Statement Graph With Revenue And Operating Profit Margin Download PDF. This layout presents information on Revenue, Net Income, Operating Profit Margin. It is also available for immediate download and adjustment. So, changes can be made in the color, design, graphics or any other component to create a unique layout.
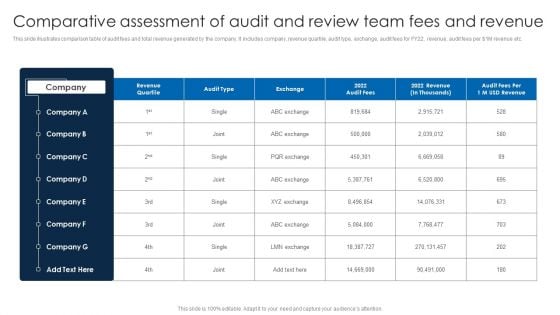
Comparative Assessment Of Audit And Review Team Fees And Revenue Themes PDF
This slide illustrates comparison table of audit fees and total revenue generated by the company. It includes company, revenue quartile, audit type, exchange, audit fees for FY22, revenue, audit fees per dollar 1M revenue etc.Showcasing this set of slides titled Comparative Assessment Of Audit And Review Team Fees And Revenue Themes PDF. The topics addressed in these templates are External Audit, Total Compensation, Total Compensation. All the content presented in this PPT design is completely editable. Download it and make adjustments in color, background, font etc. as per your unique business setting.
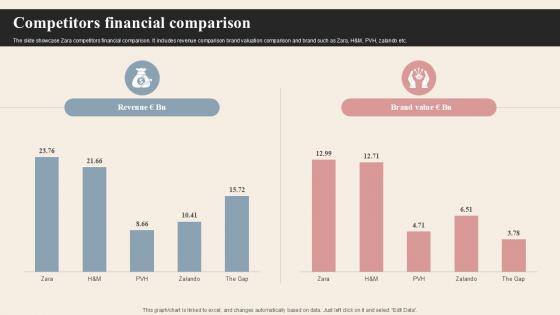
Competitors Financial Comparison Branded Clothing Company Profile PPT Example CP SS V
The slide showcase Zara competitors financial comparison. It includes revenue comparison brand valuation comparison and brand such as Zara, H and M, PVH, zalando etc. There are so many reasons you need a Competitors Financial Comparison Branded Clothing Company Profile PPT Example CP SS V. The first reason is you can not spend time making everything from scratch, Thus, Slidegeeks has made presentation templates for you too. You can easily download these templates from our website easily. The slide showcase Zara competitors financial comparison. It includes revenue comparison brand valuation comparison and brand such as Zara, H and M, PVH, zalando etc.
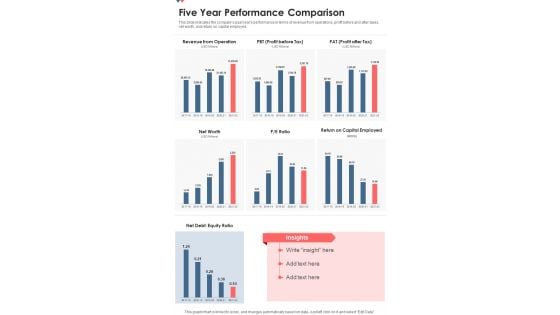
Five Year Performance Comparison One Pager Documents
This slide indicates the companys past years performance in terms of revenue from operations, profit before and after taxes, net worth, and return on capital employed. Presenting you a fantastic Five Year Performance Comparison One Pager Documents. This piece is crafted on hours of research and professional design efforts to ensure you have the best resource. It is completely editable and its design allow you to rehash its elements to suit your needs. Get this Five Year Performance Comparison One Pager Documents A4 One-pager now.

Business Comparison Table Sample Ppt Presentation
This is a business comparison table sample ppt presentation. This is a seven stage process. The stages in this process are criteria, revenue, profit, market, share, main activity, number of employee, product quality, insert your text, competitor.
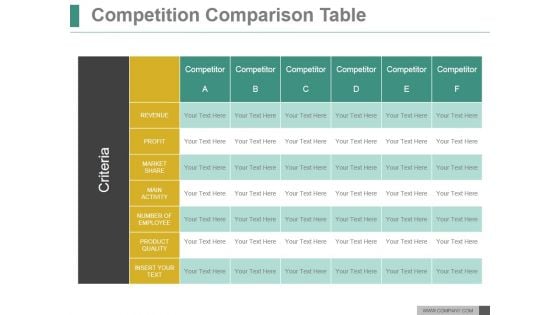
Competition Comparison Table Ppt PowerPoint Presentation Slide
This is a competition comparison table ppt powerpoint presentation slide. This is a six stage process. The stages in this process are revenue, profit, market share, main activity, number of employee, product quality.
Business Competition Comparison Table Ppt Icon
This is a business competition comparison table ppt icon. This is a seven stage process. The stages in this process are criteria, revenue, profit, market share, main activity, number of employee, product quality, insert your text, competitor.

Criteria Based Competition Comparison Table Powerpoint Slides
This is a criteria based competition comparison table powerpoint slides. This is a seven stage process. The stages in this process are revenue, profit, market share, main activity, number of employee, product quality.
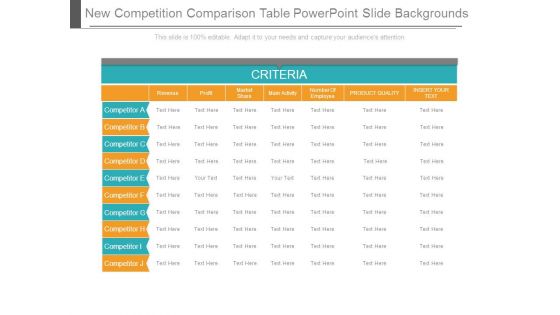
New Competition Comparison Table Powerpoint Slide Backgrounds
This is a new competition comparison table powerpoint slide backgrounds. This is a seven stage process. The stages in this process are revenue, profit, market share, main activity, number of employee, product quality, insert your text.
Competition Comparison Table Ppt PowerPoint Presentation Outline
This is a competition comparison table ppt powerpoint presentation outline. This is a seven stage process. The stages in this process are revenue, profit, market share, main activity, number of employee, product quality.
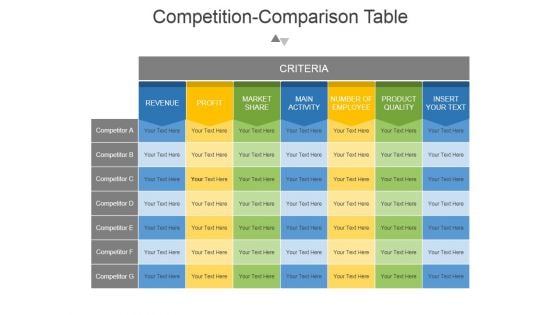
Competition Comparison Table Ppt PowerPoint Presentation Backgrounds
This is a competition comparison table ppt powerpoint presentation backgrounds. This is a seven stage process. The stages in this process are revenue, profit, market share , main activity, number of employee, product quality , insert your text.
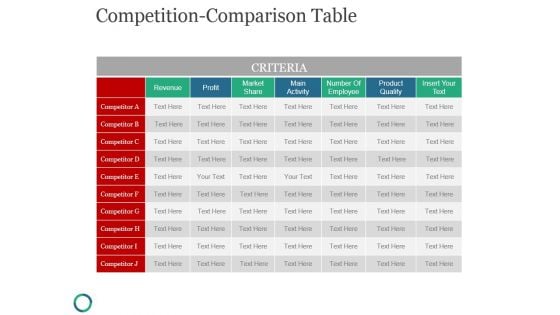
Competition Comparison Table Ppt PowerPoint Presentation Microsoft
This is a competition comparison table ppt powerpoint presentation microsoft. This is a seven stage process. The stages in this process are criteria, revenue, market share, number of employee, insert your text.
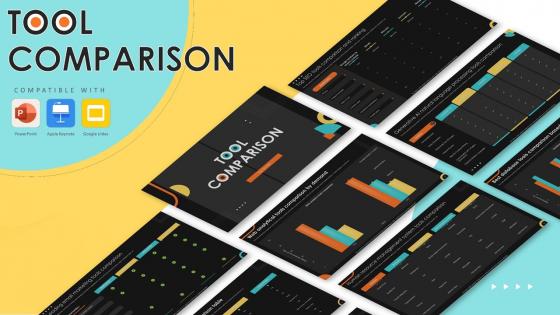
Tool Comparison Powerpoint Ppt Template Bundles
This Tool Comparison Powerpoint Ppt Template Bundles is a primer on how to capitalize on business opportunities through planning, innovation, and market intelligence. The content-ready format of the complete deck will make your job as a decision-maker a lot easier. Use this ready-made PowerPoint Template to help you outline an extensive and legible plan to capture markets and grow your company on the right path, at an exponential pace. What is even more amazing is that this presentation is completely editable and 100 percent customizable. This Business Intelligence Tools Comparison, Business Workflow Tools Comparison, Data Visualization Tools Comparison-slide complete deck helps you impress a roomful of people with your expertise in business and even presentation. Craft such a professional and appealing presentation for that amazing recall value. Download now. Our Tool Comparison PowerPoint Template Bundles are topically designed to provide an attractive backdrop for evaluating and contrasting different tools or solutions. Use them to present key features, benefits, and performance metrics professionally.
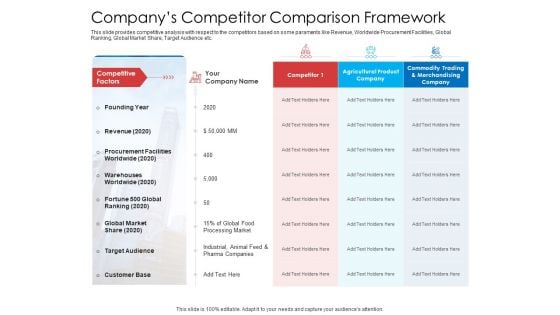
Companys Competitor Comparison Framework Clipart PDF
This slide provides competitive analysis with respect to the competitors based on some paraments like Revenue, Worldwide Procurement Facilities, Global Ranking, Global Market Share, Target Audience etc. Deliver and pitch your topic in the best possible manner with this companys competitor comparison framework clipart pdf. Use them to share invaluable insights on revenue, procurement facilities, target audience, customer base, competitor and impress your audience. This template can be altered and modified as per your expectations. So, grab it now.
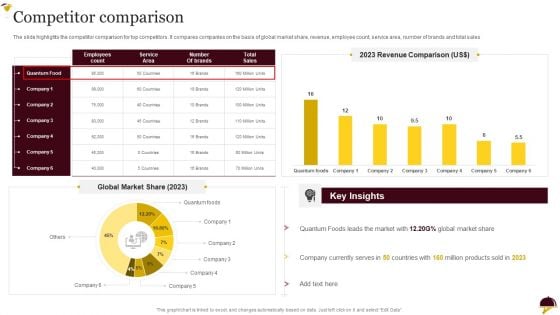
Food Company Overview Competitor Comparison Infographics PDF
The slide highlights the competitor comparison for top competitors. It compares companies on the basis of global market share, revenue, employee count, service area, number of brands and total sales.Deliver and pitch your topic in the best possible manner with this Food Company Overview Competitor Comparison Infographics PDF. Use them to share invaluable insights on Currently Serves, Quantum Foods, Key Insights and impress your audience. This template can be altered and modified as per your expectations. So, grab it now.
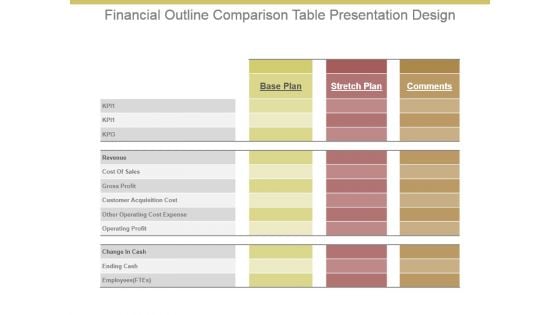
Financial Outline Comparison Table Presentation Design
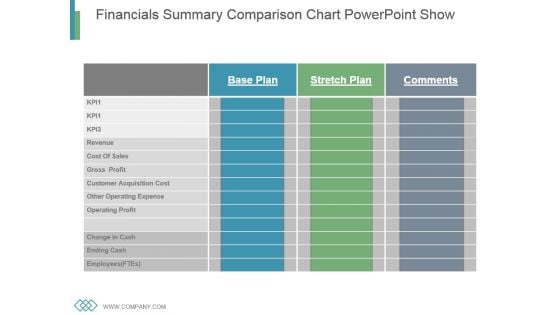
This is a financial outline comparison table presentation design. This is a three stage process. The stages in this process are base plan, stretch plan, comments, kp, revenue, cost of sales, gross profit, customer acquisition cost, other operating cost expense, operating profit, change in cash, ending cash, employees ftes.
Financials Summary Comparison Chart Powerpoint Show
This is a financials summary comparison chart powerpoint show. This is a three stage process. The stages in this process are revenue, cost of sales, gross profit, customer acquisition cost, other operating cost expense, operating profit, change in cash, ending cash, employees.
Comparison Ppt PowerPoint Presentation Portfolio Template
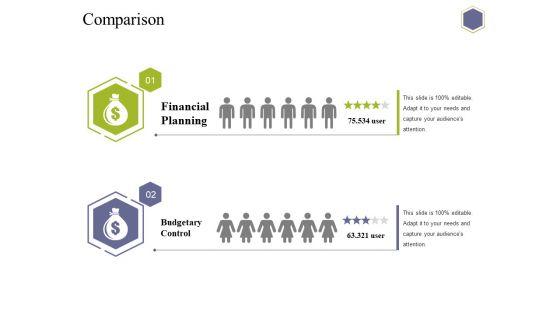
This is a comparison ppt powerpoint presentation portfolio template. This is a two stage process. The stages in this process are financial planning, budgetary control, comparison, business, marketing.
Comparison Of Prices Ppt PowerPoint Presentation Tips
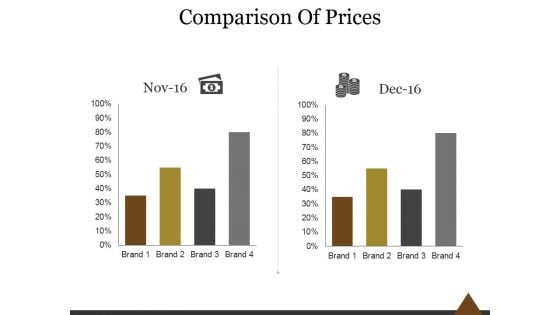
This is a comparison of prices ppt powerpoint presentation tips. This is a two stage process. The stages in this process are comparison, prices, brand, business, marketing.
Comparison Ppt PowerPoint Presentation Styles File Formats
This is a comparison ppt powerpoint presentation styles file formats. This is a two stage process. The stages in this process are business, strategy, analysis, marketing, comparison.
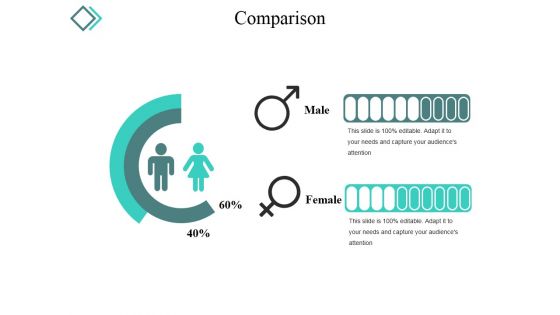
Comparison Ppt PowerPoint Presentation Portfolio Slides
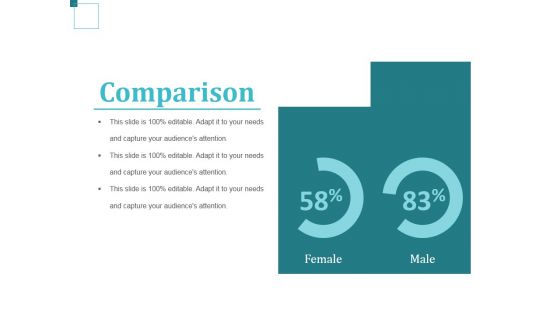
This is a comparison ppt powerpoint presentation portfolio slides. This is a two stage process. The stages in this process are male, female, comparison, percentage, business.
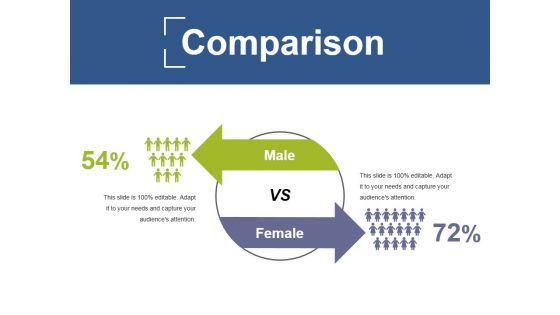
Comparison Ppt PowerPoint Presentation Infographics Rules
This is a comparison ppt powerpoint presentation infographics rules. This is a two stage process. The stages in this process are male, female, comparison, percentage, finance.
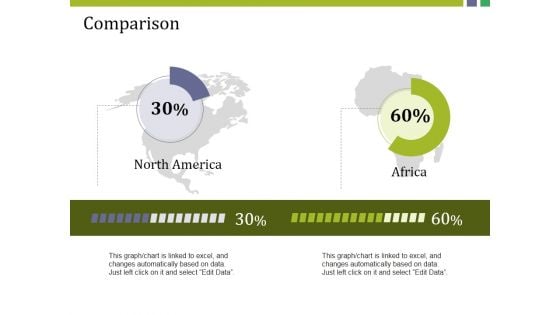
Comparison Ppt PowerPoint Presentation Ideas Smartart
This is a comparison ppt powerpoint presentation ideas smartart. This is a two stage process. The stages in this process are north america, africa, comparison, percentage, finance.
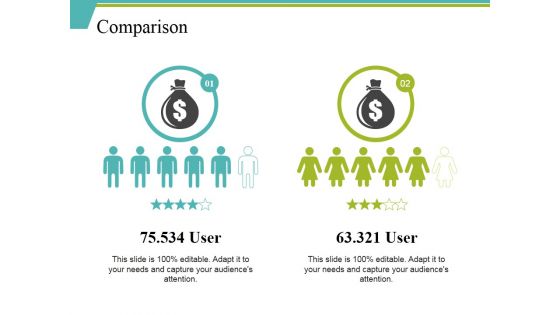
Comparison Ppt PowerPoint Presentation Infographics Examples
This is a comparison ppt powerpoint presentation infographics examples. This is a two stage process. The stages in this process are user, comparison, dollar, symbol, business.
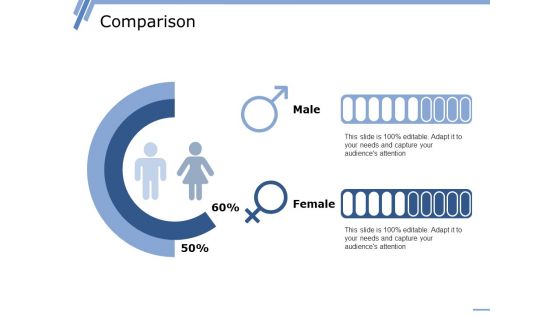
Comparison Ppt PowerPoint Presentation Professional Example File
This is a comparison ppt powerpoint presentation professional example file. This is a two stage process. The stages in this process are male, female, comparison.
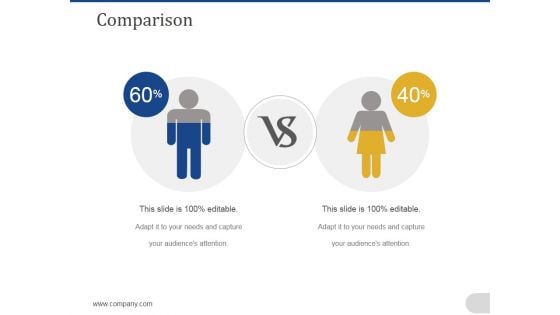
Comparison Ppt PowerPoint Presentation Professional Grid
This is a comparison ppt powerpoint presentation professional grid. This is a two stage process. The stages in this process are business, marketing, comparison, finance, timeline.
Comparison Ppt PowerPoint Presentation Icon Topics
This is a comparison ppt powerpoint presentation icon topics. This is a two stage process. The stages in this process are business, marketing, comparison, planning, management.
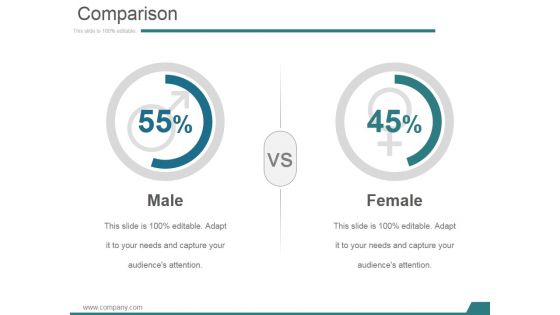
Comparison Ppt PowerPoint Presentation File Master Slide
This is a comparison ppt powerpoint presentation file master slide. This is a two stage process. The stages in this process are business, marketing, comparison, finance, management.
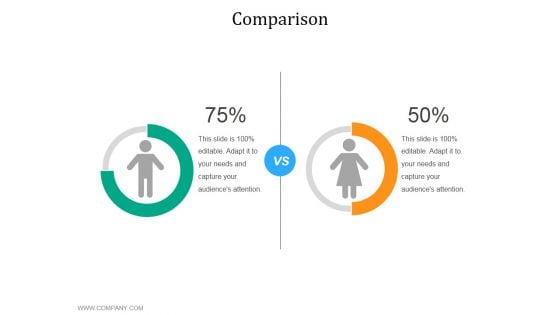
Comparison Ppt PowerPoint Presentation Portfolio Inspiration
This is a comparison ppt powerpoint presentation portfolio inspiration. This is a two stage process. The stages in this process are business, marketing, comparison, finance, management.
Comparison Ppt PowerPoint Presentation Gallery Icons
This is a comparison ppt powerpoint presentation gallery icons. This is a two stage process. The stages in this process are business, strategy, analysis, pretention, comparison.
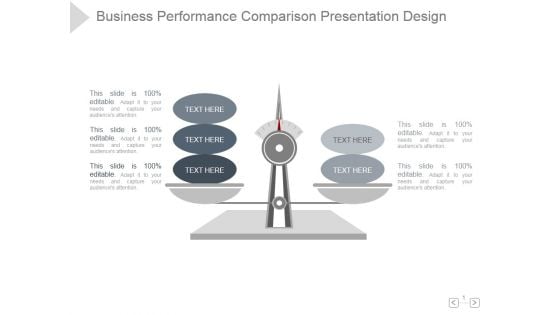
Business Performance Comparison Ppt PowerPoint Presentation Summary
This is a business performance comparison ppt powerpoint presentation summary. This is a two stage process. The stages in this process are business, performance, comparison, presentation, design, diagram.
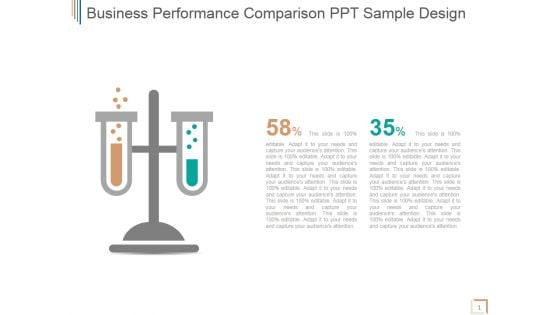
Business Performance Comparison Ppt PowerPoint Presentation Examples
This is a business performance comparison ppt powerpoint presentation examples. This is a two stage process. The stages in this process are business, performance, comparison, strategy, marketing.
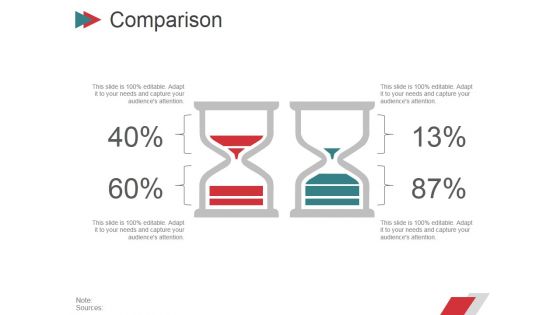
Comparison Ppt PowerPoint Presentation Infographics Images
This is a comparison ppt powerpoint presentation infographics images. This is a two stage process. The stages in this process are business, strategy, marketing, planning, finance, comparison.

Comparison Ppt PowerPoint Presentation Slides Portrait
This is a comparison ppt powerpoint presentation slides portrait. This is a two stage process. The stages in this process are male accounts, female accounts, facebook gender comparison.
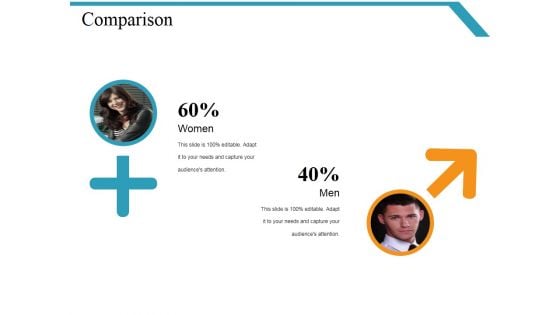
Comparison Ppt PowerPoint Presentation Styles Ideas
This is a comparison ppt powerpoint presentation styles ideas. This is a two stage process. The stages in this process are men, women, finance, comparison, teamwork.
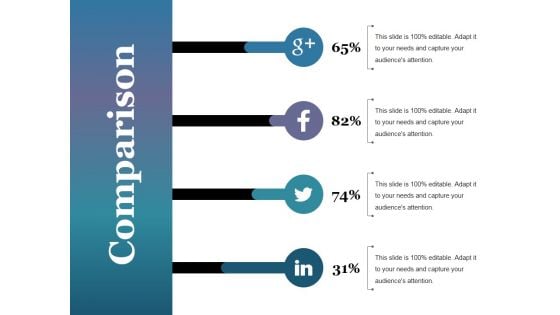
Comparison Ppt PowerPoint Presentation Professional Maker
This is a comparison ppt powerpoint presentation professional maker. This is a four stage process. The stages in this process are comparison, marketing, strategy, analysis, business.
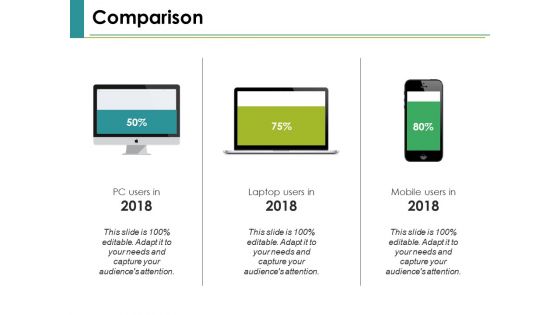
Comparison Ppt PowerPoint Presentation Ideas Infographics
This is a comparison ppt powerpoint presentation ideas infographics. This is a three stages process. The stages in this process are comparison, financial, business, planning, marketing.
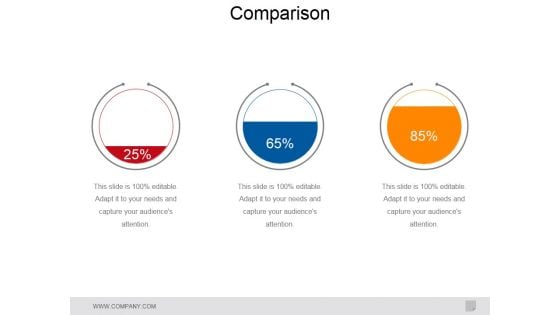
Comparison Ppt PowerPoint Presentation Summary Influencers
This is a comparison ppt powerpoint presentation summary influencers. This is a three stage process. The stages in this process are business, marketing, comparison, finance, management.
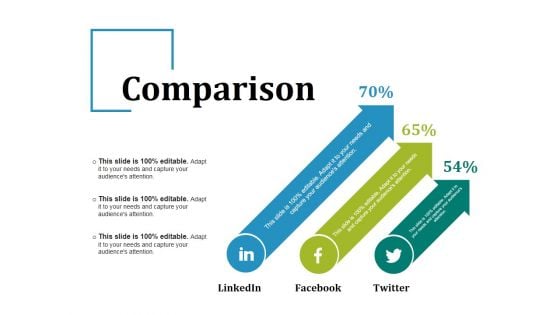
Comparison Ppt PowerPoint Presentation Inspiration Demonstration
This is a comparison ppt powerpoint presentation inspiration demonstration. This is a three stage process. The stages in this process are business, linkedin, facebook, twitter, comparison.
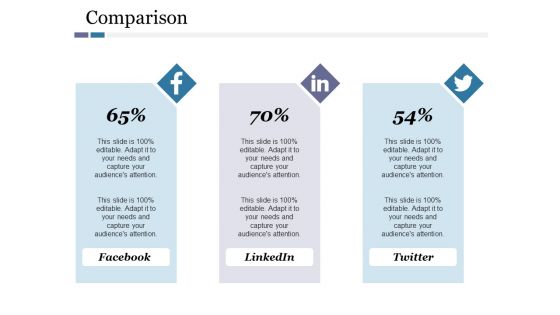
Comparison Ppt PowerPoint Presentation Visual Aids Professional
This is a comparison ppt powerpoint presentation visual aids professional. This is a three stage process. The stages in this process are facebook, linkedin, twitter, comparison .
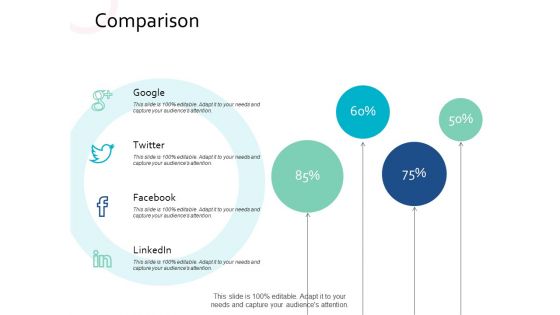
Comparison Planning Ppt PowerPoint Presentation Portfolio Portrait
This is a comparison planning ppt powerpoint presentation portfolio portrait. This is a four stage process. The stages in this process are comparison, marketing, process, business, planning.
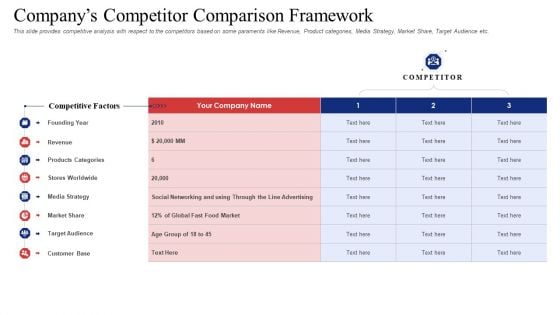
Companys Competitor Comparison Framework Inspiration PDF
This slide provides competitive analysis with respect to the competitors based on some paraments like Revenue, Product categories, Media Strategy, Market Share, Target Audience etc.Deliver and pitch your topic in the best possible manner with this companys competitor comparison framework inspiration pdf. Use them to share invaluable insights on products categories, target audience, media strategy and impress your audience. This template can be altered and modified as per your expectations. So, grab it now.
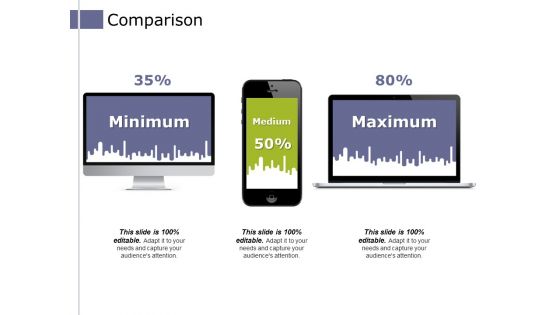
Comparison Ppt PowerPoint Presentation Infographics Example File
This is a comparison ppt powerpoint presentation infographics example file. This is a three stage process. The stages in this process are minimum, medium, maximum, financial, comparison.

Engineering Enterprise Competitive Competitor Comparison Topics PDF
The slide highlights the competitor comparison for top competitors. It compares companies on the basis of global market share, revenue, employee count, location served and services offered. If you are looking for a format to display your unique thoughts, then the professionally designed Engineering Enterprise Competitive Competitor Comparison Topics PDF is the one for you. You can use it as a Google Slides template or a PowerPoint template. Incorporate impressive visuals, symbols, images, and other charts. Modify or reorganize the text boxes as you desire. Experiment with shade schemes and font pairings. Alter, share or cooperate with other people on your work. Download Engineering Enterprise Competitive Competitor Comparison Topics PDF and find out how to give a successful presentation. Present a perfect display to your team and make your presentation unforgettable.
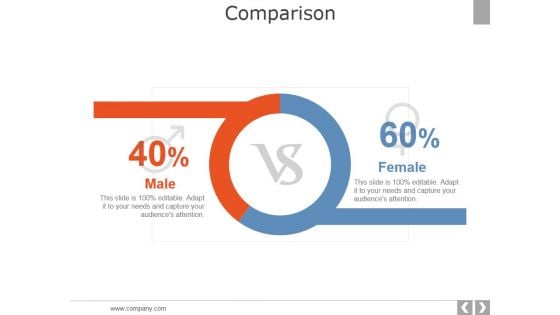
Comparison Ppt PowerPoint Presentation Pictures Format Ideas
This is a comparison ppt powerpoint presentation pictures format ideas. This is a two stage process. The stages in this process are business, strategy, marketing, analysis, male, female, comparison.
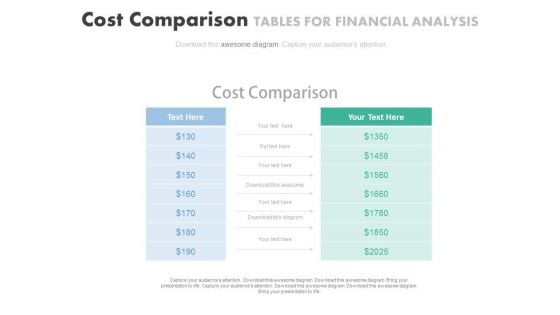
Cost Comparison Table Chart Powerpoint Slides
Our above PPT slide displays cost comparison table chart. This diagram may be used to display cost comparison and financial analysis. Download this PowerPoint template to leave permanent impression on your audience.
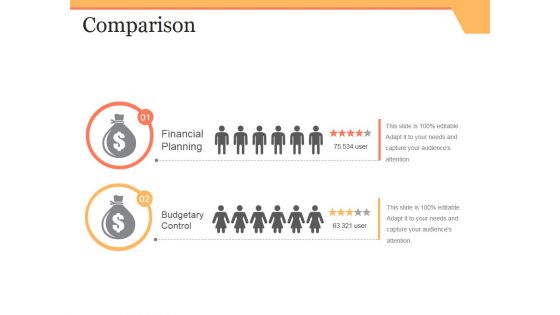
Comparison Ppt PowerPoint Presentation Slides Example Introduction
This is a comparison ppt powerpoint presentation slides example introduction. This is a two stage process. The stages in this process are financial planning, budgetary control.
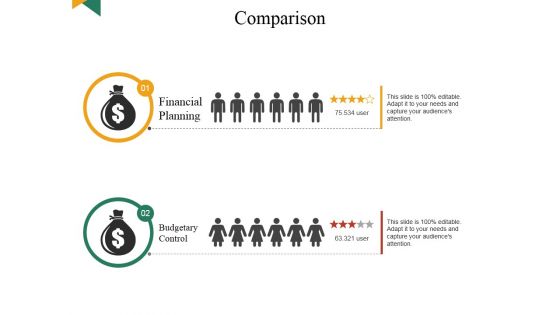
Comparison Ppt PowerPoint Presentation Infographics Graphics
This is a comparison ppt powerpoint presentation infographics graphics. This is a two stage process. The stages in this process are budgetary control, financial planning.
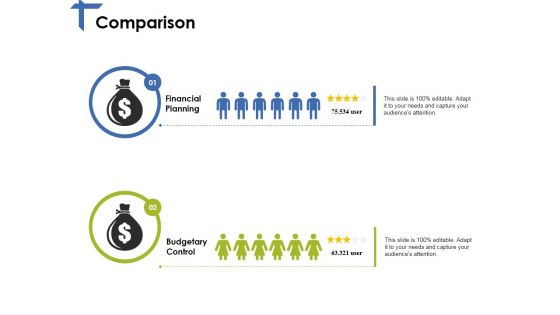
Comparison Ppt PowerPoint Presentation Inspiration Portfolio
This is a comparison ppt powerpoint presentation inspiration portfolio. This is a two stage process. The stages in this process are financial planning, budgetary control, user.
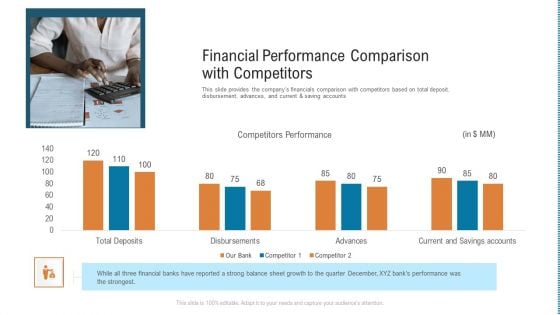
Financial Performance Comparison With Competitors Rules PDF
This slide provides the companys financials comparison with competitors based on total deposit, disbursement, advances, and current and saving accounts. Deliver an awe-inspiring pitch with this creative financial performance comparison with competitors rules pdf. bundle. Topics like financial performance comparison with competitors can be discussed with this completely editable template. It is available for immediate download depending on the needs and requirements of the user.
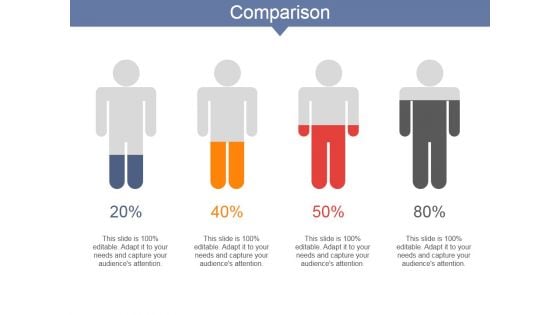
Comparison Ppt PowerPoint Presentation Layouts Outline
This is a comparison ppt powerpoint presentation layouts outline. This is a four stage process. The stages in this process are percentage, people, compare, finance, marketing.


 Continue with Email

 Home
Home


