Revenue Dashboard
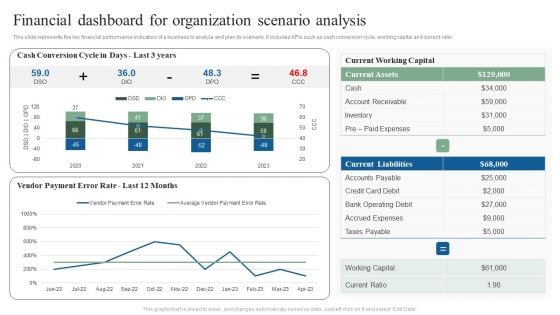
Financial Dashboard For Organization Scenario Analysis Ppt Show Ideas PDF
This slide represents the key financial performance indicators of a business to analyze and plan its scenario. It includes KPIs such as cash conversion cycle, working capital and current ratio. Showcasing this set of slides titled Financial Dashboard For Organization Scenario Analysis Ppt Show Ideas PDF. The topics addressed in these templates are Current Working Capital, Current Liabilities, Current Assets. All the content presented in this PPT design is completely editable. Download it and make adjustments in color, background, font etc. as per your unique business setting.
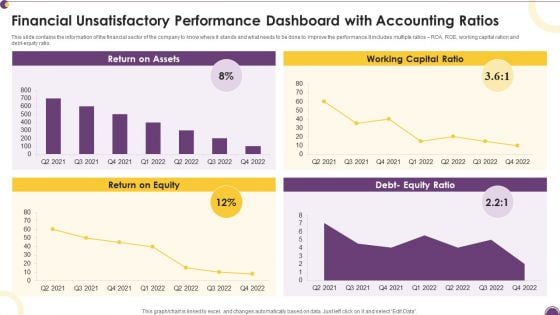
Financial Unsatisfactory Performance Dashboard With Accounting Ratios Diagrams PDF
This slide contains the information of the financial sector of the company to know where it stands and what needs to be done to improve the performance.It includes multiple ratios ROA, ROE, working capital ration and debt-equity ratio. Pitch your topic with ease and precision using this Financial Unsatisfactory Performance Dashboard With Accounting Ratios Diagrams PDF. This layout presents information on Return Assets, Working Capital, Return Equity. It is also available for immediate download and adjustment. So, changes can be made in the color, design, graphics or any other component to create a unique layout.
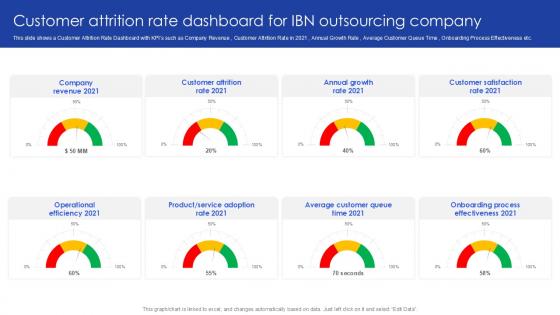
Customer Attrition Rate Dashboard For IBN Outsourcing Company PPT Template SS
This slide shows a Customer Attrition Rate Dashboard with KPIs such as Company Revenue , Customer Attrition Rate in 2021 , Annual Growth Rate , Average Customer Queue Time , Onboarding Process Effectiveness etc. There are so many reasons you need a Customer Attrition Rate Dashboard For IBN Outsourcing Company PPT Template SS. The first reason is you can not spend time making everything from scratch, Thus, Slidegeeks has made presentation templates for you too. You can easily download these templates from our website easily. This slide shows a Customer Attrition Rate Dashboard with KPIs such as Company Revenue , Customer Attrition Rate in 2021 , Annual Growth Rate , Average Customer Queue Time , Onboarding Process Effectiveness etc.
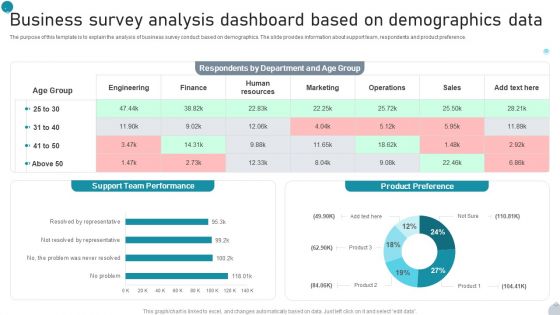
Business Survey Analysis Dashboard Based On Demographics Data Microsoft PDF
The purpose of this template is to explain the analysis of business survey conduct based on demographics. The slide provides information about support team, respondents and product preference. Pitch your topic with ease and precision using this Business Survey Analysis Dashboard Based On Demographics Data Microsoft PDF. This layout presents information on Support, Team Performance, Product Preference It is also available for immediate download and adjustment. So, changes can be made in the color, design, graphics or any other component to create a unique layout.
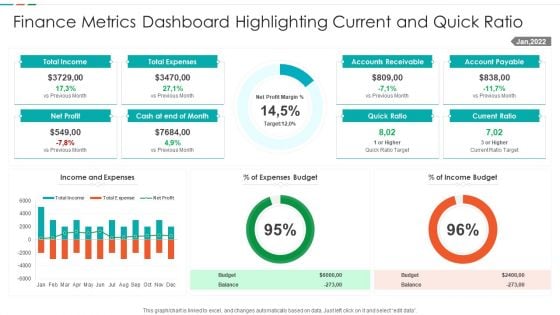
Finance Metrics Dashboard Highlighting Current And Quick Ratio Template PDF
This graph or chart is linked to excel, and changes automatically based on data. Just left click on it and select edit data. Showcasing this set of slides titled Finance Metrics Dashboard Highlighting Current And Quick Ratio Template PDF. The topics addressed in these templates are Total Income Budget, Total Expenses Balance, Net Profit Quick, Ratio Current Ratio. All the content presented in this PPT design is completely editable. Download it and make adjustments in color, background, font etc. as per your unique business setting.
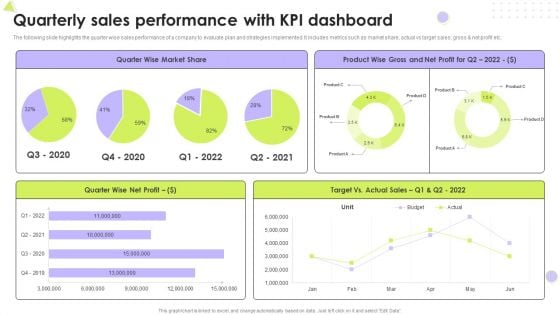
Quarterly Sales Performance With Kpi Dashboard Introduction PDF
The following slide highlights the quarter wise sales performance of a company to evaluate plan and strategies implemented. It includes metrics such as market share, actual vs target sales, gross and net profit etc. Pitch your topic with ease and precision using this Quarterly Sales Performance With Kpi Dashboard Introduction PDF. This layout presents information on Market Share, Net Profit, Target. It is also available for immediate download and adjustment. So, changes can be made in the color, design, graphics or any other component to create a unique layout.
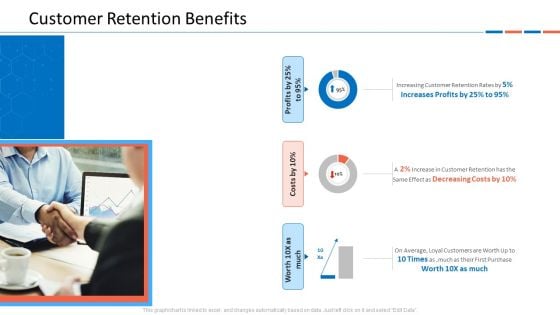
Customer Relationship Management Dashboard Customer Retention Benefits Inspiration PDF
This graph or chart is linked to excel, and changes automatically based on data. Just left click on it and select Edit Data.Deliver an awe inspiring pitch with this creative customer relationship management dashboard customer retention benefits inspiration pdf bundle. Topics like increasing customer retention rates, on average, loyal customers are worth up to 10 times as ,much as their first purchase, profits by 25percent to 95percent can be discussed with this completely editable template. It is available for immediate download depending on the needs and requirements of the user.
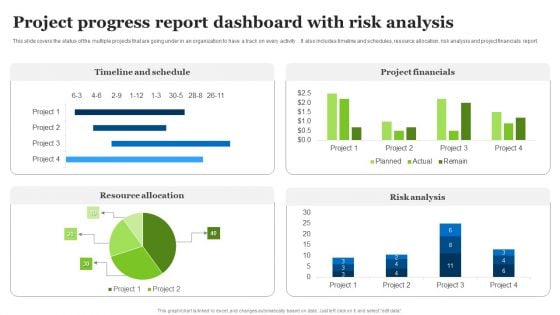
Project Progress Report Dashboard With Risk Analysis Ppt Examples PDF
This slide covers the status of the multiple projects that are going under in an organization to have a track on every activity . It also includes timeline and schedules, resource allocation, risk analysis and project financials report. Pitch your topic with ease and precision using this Project Progress Report Dashboard With Risk Analysis Ppt Examples PDF. This layout presents information on Timeline And Schedule, Project Financials, Risk Analysis. It is also available for immediate download and adjustment. So, changes can be made in the color, design, graphics or any other component to create a unique layout.
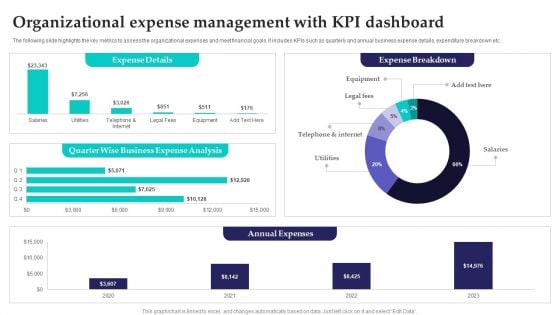
Organizational Expense Management With Kpi Dashboard Slides PDF
The following slide highlights the key metrics to assess the organizational expenses and meet financial goals. It includes KPIs such as quarterly and annual business expense details, expenditure breakdown etc. Showcasing this set of slides titled Organizational Expense Management With Kpi Dashboard Slides PDF. The topics addressed in these templates are Annual Expenses, Expense Details, Expense Breakdown. All the content presented in this PPT design is completely editable. Download it and make adjustments in color, background, font etc. as per your unique business setting.
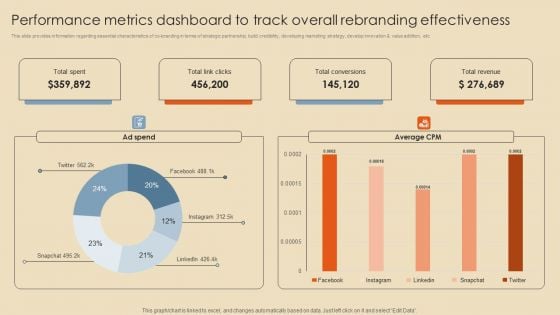
Performance Metrics Dashboard To Track Overall Rebranding Effectiveness Professional PDF
This slide provides information regarding essential characteristics of co-branding in terms of strategic partnership, build credibility, developing marketing strategy, develop innovation and value addition, etc. Make sure to capture your audiences attention in your business displays with our gratis customizable Performance Metrics Dashboard To Track Overall Rebranding Effectiveness Professional PDF. These are great for business strategies, office conferences, capital raising or task suggestions. If you desire to acquire more customers for your tech business and ensure they stay satisfied, create your own sales presentation with these plain slides.
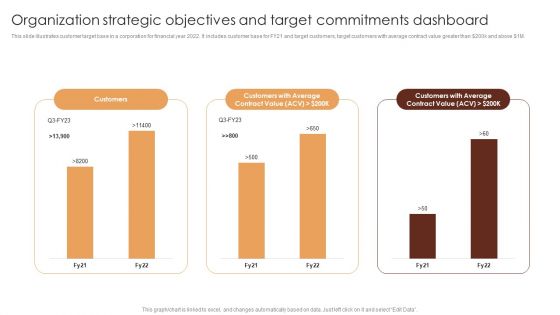
Organization Strategic Objectives And Target Commitments Dashboard Themes PDF
This slide illustrates customer target base in a corporation for financial year 2022. It includes customer base for FY21 and target customers, target customers with average contract value greater than dollar 200k and above dollar 1M. Pitch your topic with ease and precision using this Organization Strategic Objectives And Target Commitments Dashboard Themes PDF. This layout presents information on Customers Average, Contract Value, Customers. It is also available for immediate download and adjustment. So, changes can be made in the color, design, graphics or any other component to create a unique layout.

Financial KPI Dashboard Ppt PowerPoint Presentation Complete Deck With Slides
Improve your presentation delivery using this Financial KPI Dashboard Ppt PowerPoint Presentation Complete Deck With Slides. Support your business vision and objectives using this well structured PPT deck. This template offers a great starting point for delivering beautifully designed presentations on the topic of your choice. Comprising Twelve this professionally designed template is all you need to host discussion and meetings with collaborators. Each slide is self explanatory and equipped with high quality graphics that can be adjusted to your needs. Therefore, you will face no difficulty in portraying your desired content using this PPT slideshow. This PowerPoint slideshow contains every important element that you need for a great pitch. It is not only editable but also available for immediate download and utilization. The color, font size, background, shapes everything can be modified to create your unique presentation layout. Therefore, download it now.
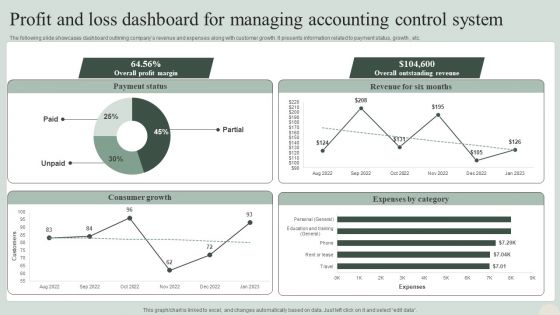
Profit And Loss Dashboard For Managing Accounting Control System Information PDF
The following slide showcases dashboard outlining companys revenue and expenses along with customer growth. It presents information related to payment status, growth , etc. Pitch your topic with ease and precision using this Profit And Loss Dashboard For Managing Accounting Control System Information PDF. This layout presents information on Consumer Growth, Expenses By Category, Overall Outstanding Revenue. It is also available for immediate download and adjustment. So, changes can be made in the color, design, graphics or any other component to create a unique layout.
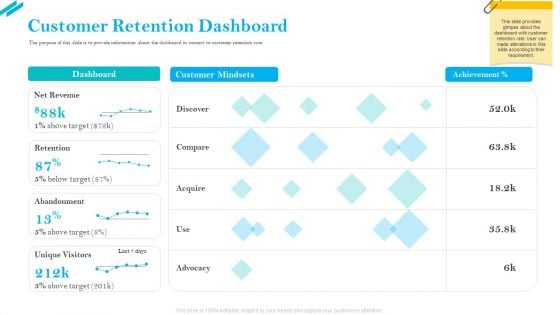
SCR For Market Customer Retention Dashboard Ppt Infographics Example Introduction PDF
The purpose of this slide is to provide information about the dashboard in context to customer retention rate. Deliver an awe-inspiring pitch with this creative SCR for market customer retention dashboard ppt infographics example introduction pdf bundle. Topics like customer retention dashboard, net revenue, retention, compare, unique visitors can be discussed with this completely editable template. It is available for immediate download depending on the needs and requirements of the user.
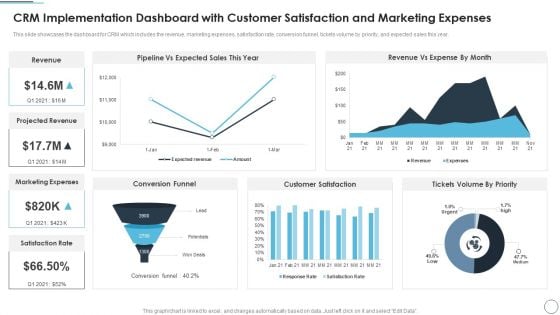
CRM Implementation Dashboard With Customer Satisfaction And Marketing Expenses Formats PDF
This slide showcases the dashboard for CRM which includes the revenue, marketing expenses, satisfaction rate, conversion funnel, tickets volume by priority, and expected sales this year.Deliver and pitch your topic in the best possible manner with this CRM Implementation Dashboard With Customer Satisfaction And Marketing Expenses Formats PDF Use them to share invaluable insights on Revenue Vs Expense, Customer Satisfaction, Conversion Funnel and impress your audience. This template can be altered and modified as per your expectations. So, grab it now.
Finance Metrics Dashboard Illustrating Account Payables Icons PDF
This graph or chart is linked to excel, and changes automatically based on data. Just left click on it and select edit data. Pitch your topic with ease and precision using this Total Income Budget, Total Expenses Balance, Net Profit Quick, Ratio Current Ratio. This layout presents information on Account Payable Age, Average Creditor Days, Cash On Hand. It is also available for immediate download and adjustment. So, changes can be made in the color, design, graphics or any other component to create a unique layout.
Improving Brand Awareness Through WOM Marketing Dashboard For Tracking Essential Marketing Activities Actions Download PDF
This slide covers information regarding the dashboard for tracking essential marketing activities in terms of revenue generated, sign ups, promoters, pending actions, owed and paid, etc. Deliver an awe inspiring pitch with this creative improving brand awareness through wom marketing dashboard for tracking essential marketing activities actions download pdf bundle. Topics like revenue, customers, cancellations, revenue generated can be discussed with this completely editable template. It is available for immediate download depending on the needs and requirements of the user.
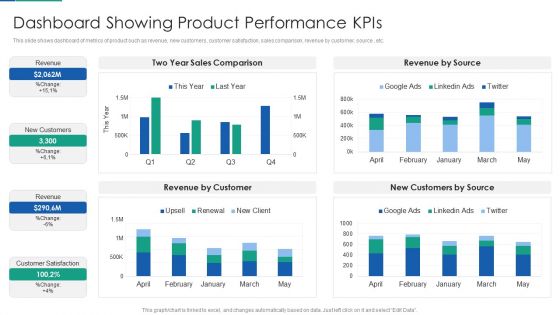
Agile Product Life Process Management Dashboard Showing Product Performance Kpis Inspiration PDF
This slide shows dashboard of metrics of product such as revenue, new customers, customer satisfaction, sales comparison, revenue by customer, source , etc. Deliver an awe inspiring pitch with this creative agile product life process management dashboard showing product performance kpis inspiration pdf bundle. Topics like dashboard showing product performance kpis can be discussed with this completely editable template. It is available for immediate download depending on the needs and requirements of the user.
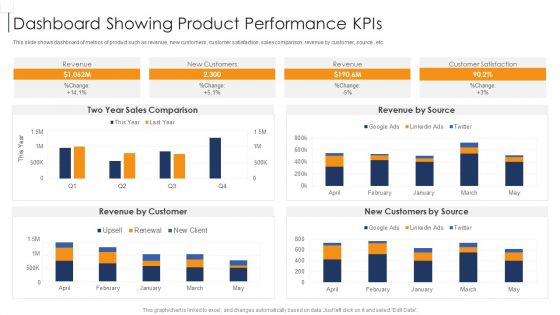
Product Lifecycle Management IT Dashboard Showing Product Performance Kpis Inspiration PDF
This slide shows dashboard of metrics of product such as revenue, new customers, customer satisfaction, sales comparison, revenue by customer, source , etc. Deliver an awe inspiring pitch with this creative product lifecycle management it dashboard showing product performance kpis inspiration pdf bundle. Topics like dashboard showing product performance kpis can be discussed with this completely editable template. It is available for immediate download depending on the needs and requirements of the user.
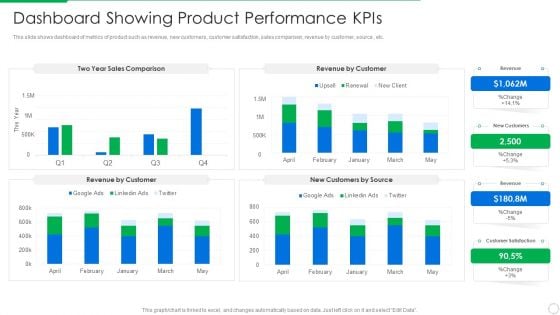
PLM Execution In Company Dashboard Showing Product Performance Kpis Diagrams PDF
This slide shows dashboard of metrics of product such as revenue, new customers, customer satisfaction, sales comparison, revenue by customer, source , etc. Deliver and pitch your topic in the best possible manner with this plm execution in company dashboard showing product performance kpis diagrams pdf . Use them to share invaluable insights on dashboard showing product performance kpis and impress your audience. This template can be altered and modified as per your expectations. So, grab it now.
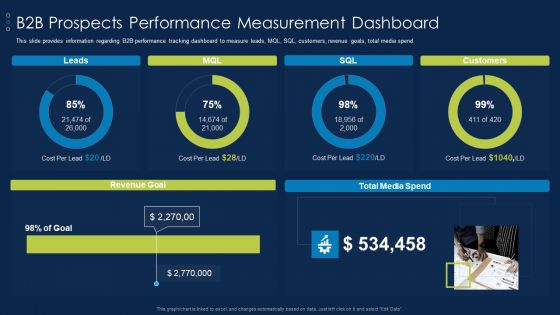
Business To Business Account B2B Prospects Performance Measurement Dashboard Slides PDF
This slide provides information regarding B2B performance tracking dashboard to measure leads, MQL, SQL, customers, revenue goals, total media spend. Deliver an awe inspiring pitch with this creative Business To Business Account B2B Prospects Performance Measurement Dashboard Slides PDF bundle. Topics like Leads, MQL, SQL, Customers, Total Media Spend, Revenue Goal can be discussed with this completely editable template. It is available for immediate download depending on the needs and requirements of the user.
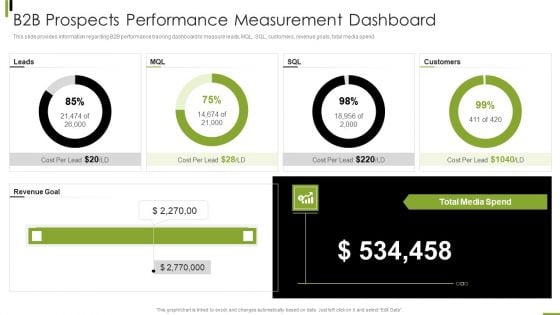
B2B Sales Framework Playbook B2B Prospects Performance Measurement Dashboard Professional PDF
This slide provides information regarding B2B performance tracking dashboard to measure leads, MQL, SQL, customers, revenue goals, total media spend. Deliver an awe inspiring pitch with this creative B2B Sales Framework Playbook B2B Prospects Performance Measurement Dashboard Professional PDF bundle. Topics like Cost Per Lead, Customers, Revenue Goal can be discussed with this completely editable template. It is available for immediate download depending on the needs and requirements of the user.
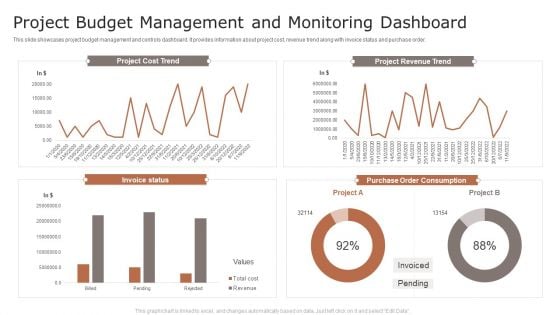
Project Budget Management And Monitoring Dashboard Ppt Portfolio Infographic Template PDF
This slide showcases project budget management and controls dashboard. It provides information about project cost, revenue trend along with invoice status and purchase order. Showcasing this set of slides titled Project Budget Management And Monitoring Dashboard Ppt Portfolio Infographic Template PDF. The topics addressed in these templates are Project Cost Trend, Project Revenue Trend, Invoice Status. All the content presented in this PPT design is completely editable. Download it and make adjustments in color, background, font etc. as per your unique business setting.
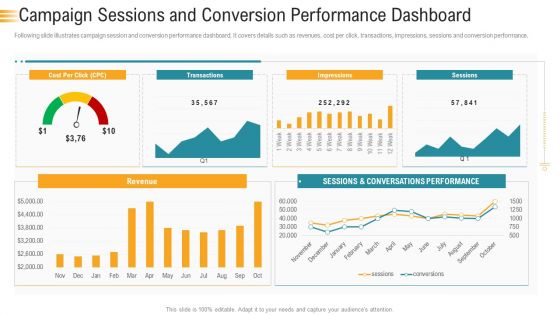
Establishing An Efficient Integrated Marketing Communication Process Campaign Sessions And Conversion Performance Dashboard Mockup PDF
Following slide illustrates campaign session and conversion performance dashboard. It covers details such as revenues, cost per click, transactions, impressions, sessions and conversion performance. Deliver an awe inspiring pitch with this creative establishing an efficient integrated marketing communication process campaign sessions and conversion performance dashboard mockup pdf bundle. Topics like conversations performance, revenue, cost per can be discussed with this completely editable template. It is available for immediate download depending on the needs and requirements of the user.
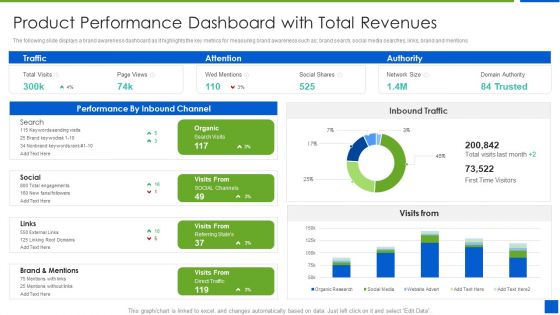
Developing New Product Messaging Canvas Determining Its USP Product Performance Dashboard Icons PDF
The following slide displays a brand awareness dashboard as it highlights the key metrics for measuring brand awareness such as brand search, social media searches, links, brand and mentions Deliver an awe inspiring pitch with this creative ping new product messaging canvas determining its usp product performance dashboard icons pdf bundle. Topics like product performance dashboard with total revenues can be discussed with this completely editable template. It is available for immediate download depending on the needs and requirements of the user.
Improving Brand Recognition With Message And Differentiation Strategy Product Performance Dashboard Information PDF
The following slide displays a brand awareness dashboard as it highlights the key metrics for measuring brand awareness such as brand search, social media searches, links, brand and mentions Deliver an awe inspiring pitch with this creative improving brand recognition with message and differentiation strategy product performance dashboard information pdf bundle. Topics like product performance dashboard with total revenues can be discussed with this completely editable template. It is available for immediate download depending on the needs and requirements of the user.
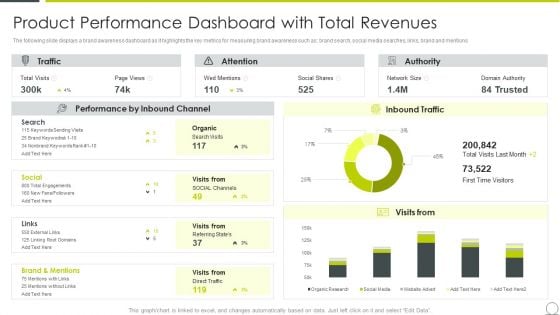
Marketing Communication Channels For Increasing Brand Awarenes Product Performance Dashboard Brochure PDF
The following slide displays a brand awareness dashboard as it highlights the key metrics for measuring brand awareness such as brand search, social media searches, links, brand and mentions Deliver an awe inspiring pitch with this creative marketing communication channels for increasing brand awarenes product performance dashboard brochure pdf bundle. Topics like product performance dashboard with total revenues can be discussed with this completely editable template. It is available for immediate download depending on the needs and requirements of the user.
Business To Business Sales Playbook B2B Sales Representatives Performance Tracking Dashboard Introduction PDF
This slide provides information regarding B2B sales representatives performance tracking dashboard to measure leads by region, revenue breakdown, top performers by leads, revenues, etc. Deliver and pitch your topic in the best possible manner with this business to business sales playbook b2b sales representatives performance tracking dashboard introduction pdf. Use them to share invaluable insights on b2b sales representatives performance tracking dashboard and impress your audience. This template can be altered and modified as per your expectations. So, grab it now.
B2B Customers Journey Playbook B2b Sales Representatives Performance Tracking Dashboard Demonstration PDF
This slide provides information regarding B2B sales representatives performance tracking dashboard to measure leads by region, revenue breakdown, top performers by leads, revenues, etc. Deliver and pitch your topic in the best possible manner with this b2b customers journey playbook b2b sales representatives performance tracking dashboard demonstration pdf. Use them to share invaluable insights on b2b sales representatives performance tracking dashboard and impress your audience. This template can be altered and modified as per your expectations. So, grab it now.
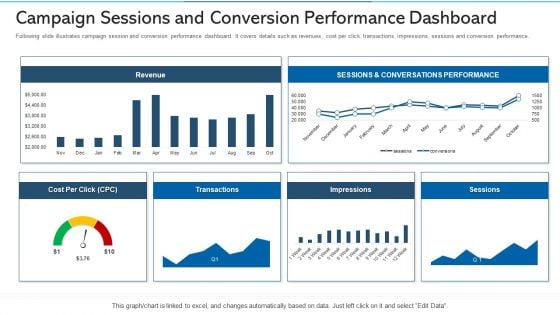
Campaign Sessions And Conversion Performance Dashboard Ppt Infographic Template Tips PDF
Following slide illustrates campaign session and conversion performance dashboard. It covers details such as revenues, cost per click, transactions, impressions, sessions and conversion performance. Deliver an awe-inspiring pitch with this creative campaign sessions and conversion performance dashboard ppt infographic template tips pdf. bundle. Topics like revenue, sessions and conversations performance can be discussed with this completely editable template. It is available for immediate download depending on the needs and requirements of the user.
B2B Sales Techniques Playbook B2B Sales Representatives Performance Tracking Dashboard Diagrams PDF
This slide provides information regarding B2B sales representatives performance tracking dashboard to measure leads by region, revenue breakdown, top performers by leads, revenues, etc. Deliver and pitch your topic in the best possible manner with this B2B Sales Techniques Playbook B2B Sales Representatives Performance Tracking Dashboard Diagrams PDF. Use them to share invaluable insights on Combine Sales, Individual Performance, Achieved Highest and impress your audience. This template can be altered and modified as per your expectations. So, grab it now.
Business To Business Account B2B Sales Representatives Performance Tracking Dashboard Demonstration PDF
This slide provides information regarding B2B sales representatives performance tracking dashboard to measure leads by region, revenue breakdown, top performers by leads, revenues, etc. Deliver and pitch your topic in the best possible manner with this Business To Business Account B2B Sales Representatives Performance Tracking Dashboard Demonstration PDF. Use them to share invaluable insights on Top 5 Sales Reps By Revenue Pace, Top 5 Sales Reps By Revenue, Top 5 Sales Reps By Leads and impress your audience. This template can be altered and modified as per your expectations. So, grab it now.

Enhance Profit Client Journey Analysis Cart Recovery Dashboard Value Brochure PDF
Measure which email campaigns brought the most recovery, which age group responded the best, and other KPIs via a dashboard. Deliver an awe-inspiring pitch with this creative enhance profit client journey analysis cart recovery dashboard value brochure pdf bundle. Topics like recovery revenue, recovery rate, revenue per email can be discussed with this completely editable template. It is available for immediate download depending on the needs and requirements of the user.
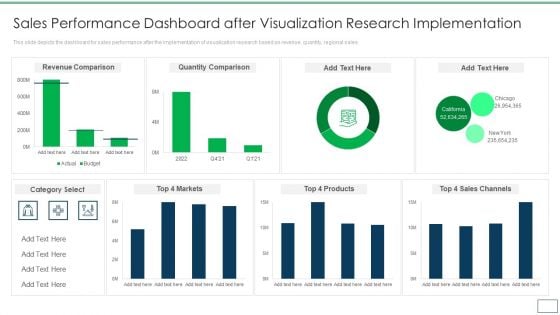
Departments Of Visualization Research Sales Performance Dashboard After Visualization Sample PDF
This slide depicts the dashboard for sales performance after the implementation of visualization research based on revenue, quantity, regional sales.Deliver an awe inspiring pitch with this creative Departments Of Visualization Research Sales Performance Dashboard After Visualization Sample PDF bundle. Topics like Revenue Comparison, Quantity Comparison, Category Select can be discussed with this completely editable template. It is available for immediate download depending on the needs and requirements of the user.
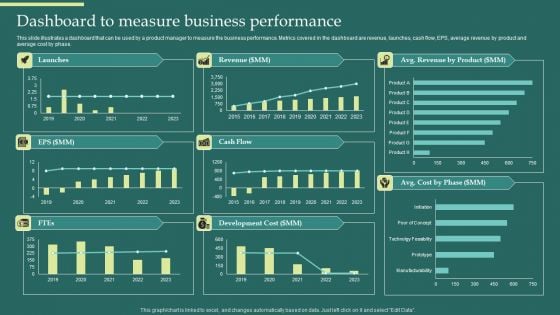
Product Portfolios And Strategic Dashboard To Measure Business Performance Portrait PDF
This slide illustrates a dashboard that can be used by a product manager to measure the business performance. Metrics covered in the dashboard are revenue, launches, cash flow, EPS, average revenue by product and average cost by phase. Do you have an important presentation coming up Are you looking for something that will make your presentation stand out from the rest Look no further than Product Portfolios And Strategic Dashboard To Measure Business Performance Portrait PDF. With our professional designs, you can trust that your presentation will pop and make delivering it a smooth process. And with Slidegeeks, you can trust that your presentation will be unique and memorable. So why wait Grab Product Portfolios And Strategic Dashboard To Measure Business Performance Portrait PDF today and make your presentation stand out from the rest.
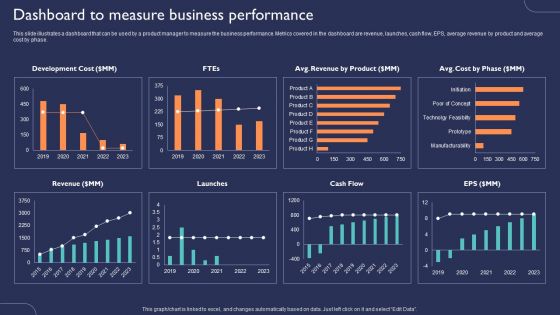
Introduction To New Product Portfolio Dashboard To Measure Business Performance Ppt Ideas Clipart Images PDF
This slide illustrates a dashboard that can be used by a product manager to measure the business performance. Metrics covered in the dashboard are revenue, launches, cash flow, EPS, average revenue by product and average cost by phase. Are you in need of a template that can accommodate all of your creative concepts. This one is crafted professionally and can be altered to fit any style. Use it with Google Slides or PowerPoint. Include striking photographs, symbols, depictions, and other visuals. Fill, move around, or remove text boxes as desired. Test out color palettes and font mixtures. Edit and save your work, or work with colleagues. Download Introduction To New Product Portfolio Dashboard To Measure Business Performance Ppt Ideas Clipart Images PDF and observe how to make your presentation outstanding. Give an impeccable presentation to your group and make your presentation unforgettable.
Designing And Deployment CRM Implementation Dashboard With Sales Pipeline Icons PDF
The following slide showcases the CRM dashboard which includes leads, deals, sales revenue, revenue by products, total leads by source, total leads by status and lead distribution. Deliver and pitch your topic in the best possible manner with this designing and deployment crm implementation dashboard with sales pipeline icons pdf. Use them to share invaluable insights on crm, lead distribution, sales revenue, total leads by source, deals, sales pipeline by stage and impress your audience. This template can be altered and modified as per your expectations. So, grab it now.
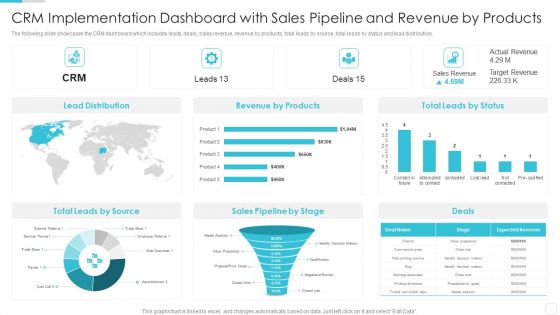
Sales CRM Cloud Solutions Deployment CRM Implementation Dashboard With Sales Template PDF
The following slide showcases the CRM dashboard which includes leads, deals, sales revenue, revenue by products, total leads by source, total leads by status and lead distribution.Deliver and pitch your topic in the best possible manner with this Sales CRM Cloud Solutions Deployment CRM Implementation Dashboard With Sales Template PDF. Use them to share invaluable insights on Lead Distribution, Revenue By Products, Leads By Source and impress your audience. This template can be altered and modified as per your expectations. So, grab it now.
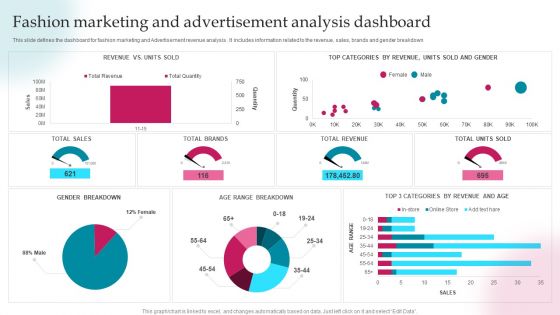
Fashion Marketing And Advertisement Analysis Dashboard Ppt PowerPoint Presentation Gallery Topics PDF
This slide defines the dashboard for fashion marketing and Advertisement revenue analysis . It includes information related to the revenue, sales, brands and gender breakdown. Pitch your topic with ease and precision using this Fashion Marketing And Advertisement Analysis Dashboard Ppt PowerPoint Presentation Gallery Topics PDF. This layout presents information on Total Revenue, Total Brands, Total Sales. It is also available for immediate download and adjustment. So, changes can be made in the color, design, graphics or any other component to create a unique layout.
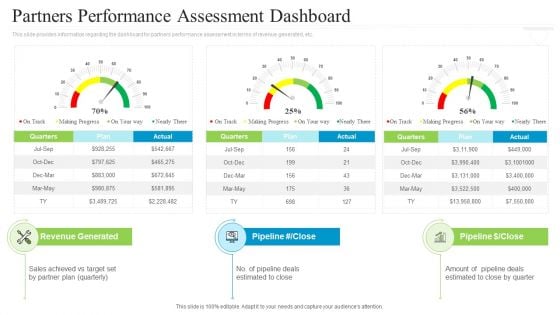
Collaborative Marketing To Attain New Customers Partners Performance Assessment Dashboard Microsoft PDF
This slide provides information regarding the dashboard for partners performance assessment in terms of revenue generated, etc. Deliver and pitch your topic in the best possible manner with this collaborative marketing to attain new customers partners performance assessment dashboard microsoft pdf. Use them to share invaluable insights on partners performance assessment dashboard and impress your audience. This template can be altered and modified as per your expectations. So, grab it now.
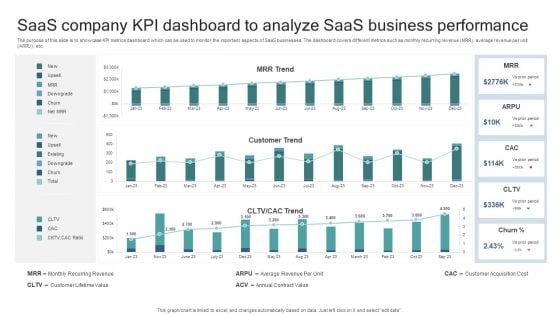
Saas Company KPI Dashboard To Analyze Saas Business Performance Elements PDF
The purpose of this slide is to showcase KPI metrics dashboard which can be used to monitor the important aspects of SaaS businesses. The dashboard covers different metrics such as monthly recurring revenue MRR, average revenue per unit ARPU, etc. Pitch your topic with ease and precision using this Saas Company KPI Dashboard To Analyze Saas Business Performance Elements PDF. This layout presents information on Monthly Recurring Revenue, Customer Lifetime Value, Average Revenue Per Unit, Annual Contract Value, Customer Acquisition Cost. It is also available for immediate download and adjustment. So, changes can be made in the color, design, graphics or any other component to create a unique layout.
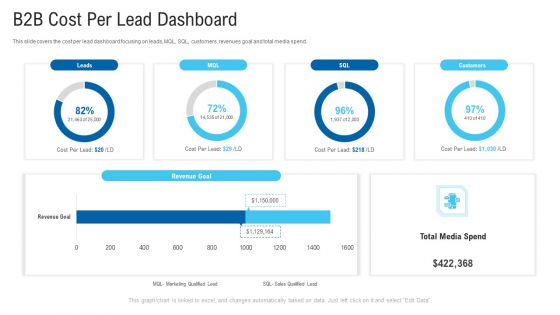
New Era Of B2B Trading B2B Cost Per Lead Dashboard Ppt Gallery Layout PDF
This slide covers the cost per lead dashboard focusing on leads, MQL, SQL, customers, revenues goal and total media spend.Deliver and pitch your topic in the best possible manner with this new era of B2B trading B2B cost per lead dashboard ppt gallery layout pdf. Use them to share invaluable insights on revenue goal, total media spend and impress your audience. This template can be altered and modified as per your expectations. So, grab it now.
Buzz Marketing Strategies For Brand Promotion Dashboard For Tracking Essential Marketing Activities Introduction PDF
This slide covers information regarding the dashboard for tracking essential marketing activities in terms of revenue generated, sign ups, promoters, pending actions, owed and paid, etc. Deliver an awe inspiring pitch with this creative buzz marketing strategies for brand promotion dashboard for tracking essential marketing activities introduction pdf bundle. Topics like revenue generated, customers, sign ups, promoters can be discussed with this completely editable template. It is available for immediate download depending on the needs and requirements of the user.
Positive Marketing For Corporate Dashboard For Tracking Essential Marketing Activities Inspiration PDF
This slide covers information regarding the dashboard for tracking essential marketing activities in terms of revenue generated, sign ups, promoters, pending actions, owed and paid, etc. Deliver an awe inspiring pitch with this creative positive marketing for corporate dashboard for tracking essential marketing activities inspiration pdf bundle. Topics like owed and paid, paid to promoters, pending actions, revenue generated, customers can be discussed with this completely editable template. It is available for immediate download depending on the needs and requirements of the user.
Actively Influencing Customers Dashboard For Tracking Essential Marketing Activities Download PDF
This slide covers information regarding the dashboard for tracking essential marketing activities in terms of revenue generated, sign ups, promoters, pending actions, owed and paid, etc. Deliver an awe inspiring pitch with this creative Actively Influencing Customers Dashboard For Tracking Essential Marketing Activities Download PDF bundle. Topics like Owed And Paid, Revenue Generated, Customers, Promoters, Pending Actions can be discussed with this completely editable template. It is available for immediate download depending on the needs and requirements of the user.

Actual And Planned Partner Executive Performance Dashboard Ppt Show Outline PDF
This slide covers the partner executive dashboard that focuses on revenues, pipeline, capability scoreboard, along with actual and planned values quarterly. Deliver an awe inspiring pitch with this creative actual and planned partner executive performance dashboard ppt show outline pdf bundle. Topics like actual and planned partner executive performance dashboard can be discussed with this completely editable template. It is available for immediate download depending on the needs and requirements of the user.
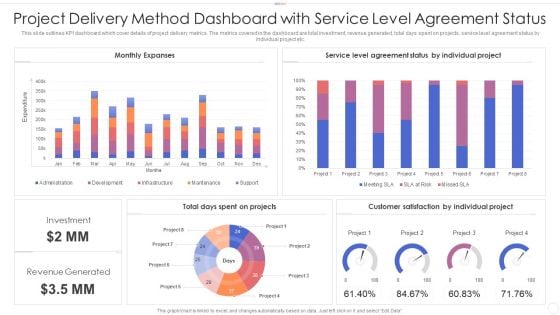
Project Delivery Method Dashboard With Service Level Agreement Status Clipart PDF
This slide outlines KPI dashboard which cover details of project delivery metrics. The metrics covered in the dashboard are total investment, revenue generated, total days spent on projects, service level agreement status by individual project etc. Pitch your topic with ease and precision using this project delivery method dashboard with service level agreement status clipart pdf. This layout presents information on project delivery method dashboard with service level agreement status. It is also available for immediate download and adjustment. So, changes can be made in the color, design, graphics or any other component to create a unique layout.
Business To Business Sales Playbook B2B Prospects Performance Measurement Dashboard Icons PDF
This slide provides information regarding B2B performance tracking dashboard to measure leads, MQL, SQL, customers, revenue goals, total media spend. Deliver an awe inspiring pitch with this creative business to business sales playbook b2b prospects performance measurement dashboard icons pdf bundle. Topics like b2b prospects performance measurement dashboard can be discussed with this completely editable template. It is available for immediate download depending on the needs and requirements of the user.
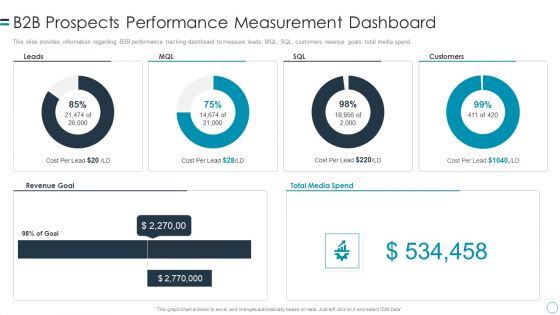
B2B Customers Journey Playbook B2b Prospects Performance Measurement Dashboard Diagrams PDF
This slide provides information regarding B2B performance tracking dashboard to measure leads, MQL, SQL, customers, revenue goals, total media spend. Deliver an awe inspiring pitch with this creative b2b customers journey playbook b2b prospects performance measurement dashboard diagrams pdf bundle. Topics like b2b prospects performance measurement dashboard can be discussed with this completely editable template. It is available for immediate download depending on the needs and requirements of the user.
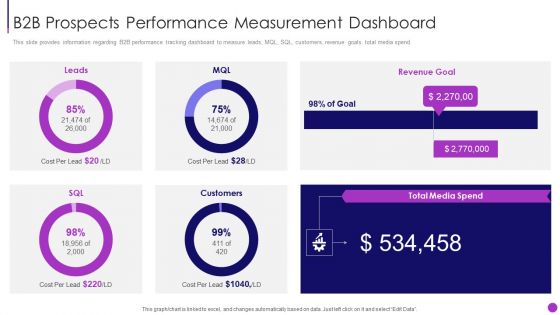
Business To Business Sales Management B2B Prospects Performance Measurement Dashboard Template PDF
This slide provides information regarding B2B performance tracking dashboard to measure leads, MQL, SQL, customers, revenue goals, total media spend.Deliver an awe inspiring pitch with this creative Business To Business Sales Management B2B Prospects Performance Measurement Dashboard Template PDF bundle. Topics like B2b Prospects, Performance, Measurement Dashboard can be discussed with this completely editable template. It is available for immediate download depending on the needs and requirements of the user.
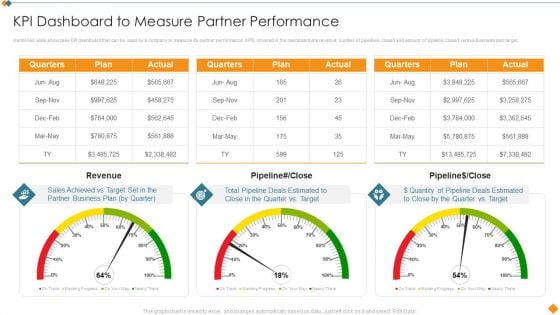
Maintaining Partner Relationships KPI Dashboard To Measure Partner Performance Structure PDF
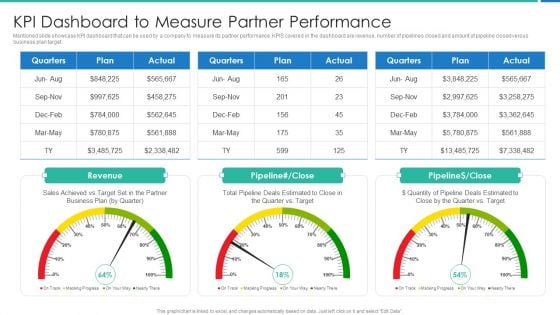
Mentioned slide showcase KPI dashboard that can be used by a company to measure its partner performance. KPIS covered in the dashboard are revenue, number of pipelines closed and amount of pipeline closed versus business plan target. Deliver an awe inspiring pitch with this creative Maintaining Partner Relationships KPI Dashboard To Measure Partner Performance Structure PDF bundle. Topics like Quarters, Plan, Actual, Revenue, Pipeline can be discussed with this completely editable template. It is available for immediate download depending on the needs and requirements of the user.
Strong Business Partnership To Ensure Company Success KPI Dashboard To Measure Partner Performance Sample PDF
Mentioned slide showcase KPI dashboard that can be used by a company to measure its partner performance. KPIS covered in the dashboard are revenue, number of pipelines closed and amount of pipeline closed versus business plan target.Deliver an awe inspiring pitch with this creative strong business partnership to ensure company success kpi dashboard to measure partner performance sample pdf bundle. Topics like kpi dashboard to measure partner performance can be discussed with this completely editable template. It is available for immediate download depending on the needs and requirements of the user.
Partnership Management Strategies Kpi Dashboard To Measure Partner Performance Elements PDF
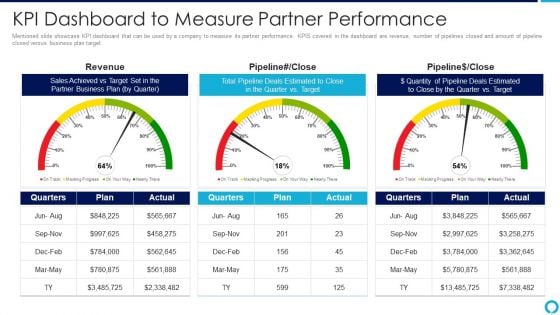
Mentioned slide showcase KPI dashboard that can be used by a company to measure its partner performance. KPIS covered in the dashboard are revenue, number of pipelines closed and amount of pipeline closed versus business plan target.Deliver an awe inspiring pitch with this creative partnership management strategies kpi dashboard to measure partner performance elements pdf bundle. Topics like sales achieved, partner business plan, total pipeline deals estimated can be discussed with this completely editable template. It is available for immediate download depending on the needs and requirements of the user.

Establishing An Efficient Integrated Marketing Communication Process Shopping Cart Conversion Rate Dashboard Ideas PDF
This slide shows shopping cart conversion rate dashboard. It includes details of online revenue share, shipping error rate, shopping cart conversion rate, coupon conversion, product views per session and revenue per visitors. Deliver an awe inspiring pitch with this creative establishing an efficient integrated marketing communication process shopping cart conversion rate dashboard ideas pdf bundle. Topics like shopping cart conversion rate dashboard can be discussed with this completely editable template. It is available for immediate download depending on the needs and requirements of the user.
AI And ML Driving Monetary Value For Organization KPI Dashboard To Monitor Business Performance Graphics PDF
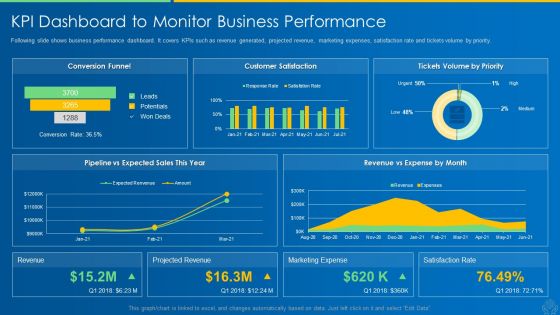
Following slide shows business performance dashboard. It covers KPIs such as revenue generated, projected revenue, marketing expenses, satisfaction rate and tickets volume by priority. Deliver and pitch your topic in the best possible manner with this ai and ml driving monetary value for organization kpi dashboard to monitor business performance graphics pdf. Use them to share invaluable insights on business offerings, current impact, product innovations, customer service and impress your audience. This template can be altered and modified as per your expectations. So, grab it now.
Customer Attrition In A Bpo Dashboard Rate Ppt Slides Designs Download PDF
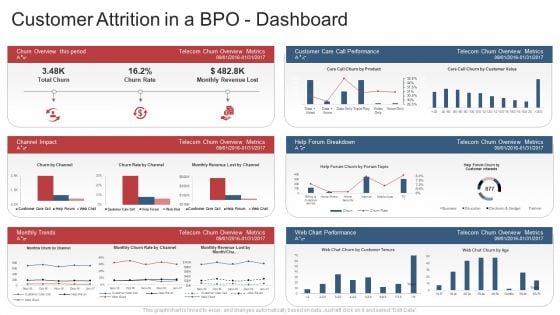
This slide shows a Customer Attrition Rate Dashboard with KPIs such as Company Revenue , Customer Attrition Rate in 2021 , Annual Growth Rate , Average Customer Queue Time , Onboarding Process Effectiveness etc. Deliver an awe-inspiring pitch with this creative customer attrition in a bpo dashboard rate ppt slides designs download pdf. bundle. Topics like company revenue, customer attrition rate, annual growth rate, customer satisfaction, rate, operational efficiency can be discussed with this completely editable template. It is available for immediate download depending on the needs and requirements of the user.
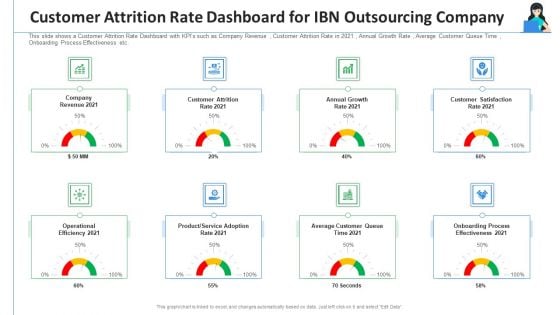
Customer Attrition Rate Dashboard For IBN Outsourcing Company Ppt Ideas Samples PDF
This slide shows a Customer Attrition Rate Dashboard with KPIs such as Company Revenue , Customer Attrition Rate in 2021 , Annual Growth Rate , Average Customer Queue Time , Onboarding Process Effectiveness etc. Deliver and pitch your topic in the best possible manner with this customer attrition rate dashboard for IBN outsourcing company ppt ideas samples pdf. Use them to share invaluable insights on revenue, operational efficiency, product service, onboarding process effectiveness, annual growth and impress your audience. This template can be altered and modified as per your expectations. So, grab it now.

Refurbishing The Product Advertising Plan Shopping Cart Conversion Rate Dashboard Ppt Styles Graphics Tutorials PDF
This slide shows shopping cart conversion rate dashboard. It includes details of online revenue share, shipping error rate, shopping cart conversion rate, coupon conversion, product views per session and revenue per visitors. Deliver an awe-inspiring pitch with this creative refurbishing the product advertising plan shopping cart conversion rate dashboard ppt styles graphics tutorials pdf. bundle. Topics like shopping cart conversion rate, coupon cart conversion, product views per session can be discussed with this completely editable template. It is available for immediate download depending on the needs and requirements of the user.
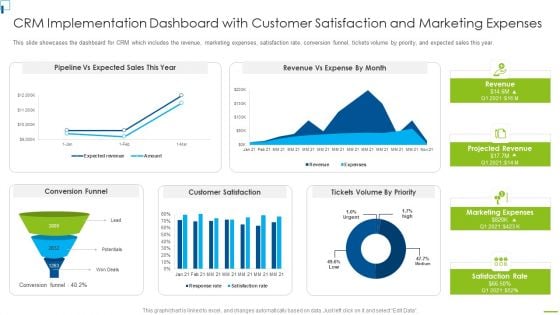
Designing And Deployment CRM Implementation Dashboard With Customer Satisfaction Clipart PDF
This slide showcases the dashboard for CRM which includes the revenue, marketing expenses, satisfaction rate, conversion funnel, tickets volume by priority, and expected sales this year. Deliver an awe inspiring pitch with this creative designing and deployment crm implementation dashboard with customer satisfaction clipart pdf bundle. Topics like pipeline vs expected sales this year, revenue vs expense by month, customer satisfaction, conversion funnel, tickets volume by priority can be discussed with this completely editable template. It is available for immediate download depending on the needs and requirements of the user.
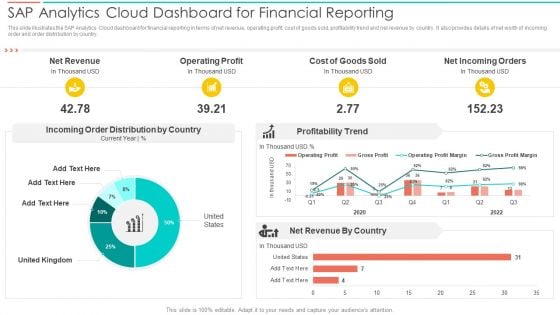
SAC Planning And Implementation SAP Analytics Cloud Dashboard For Financial Reporting Introduction PDF
This slide illustrates the SAP Analytics Cloud dashboard for financial reporting in terms of net revenue, operating profit, cost of goods sold, profitability trend and net revenue by country. It also provides details of net worth of incoming order and order distribution by country. Deliver an awe inspiring pitch with this creative SAC Planning And Implementation SAP Analytics Cloud Dashboard For Financial Reporting Introduction PDF bundle. Topics like Net Revenue, Operating Profit, Cost Goods Sold can be discussed with this completely editable template. It is available for immediate download depending on the needs and requirements of the user.


 Continue with Email

 Home
Home


