Revenue Dashboard
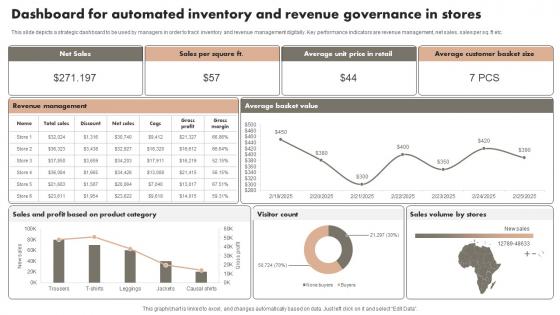
Dashboard For Automated Inventory And Revenue Governance In Stores Microsoft Pdf
This slide depicts a strategic dashboard to be used by managers in order to track inventory and revenue management digitally. Key performance indicators are revenue management, net sales, sales per sq. ft etc. Pitch your topic with ease and precision using this Dashboard For Automated Inventory And Revenue Governance In Stores Microsoft Pdf. This layout presents information on Net Sales, Stores, Category. It is also available for immediate download and adjustment. So, changes can be made in the color, design, graphics or any other component to create a unique layout. This slide depicts a strategic dashboard to be used by managers in order to track inventory and revenue management digitally. Key performance indicators are revenue management, net sales, sales per sq. ft etc.
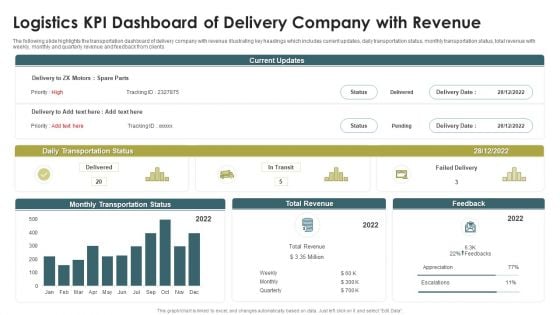
Logistics KPI Dashboard Of Delivery Company With Revenue Ppt Show PDF
The following slide highlights the transportation dashboard of delivery company with revenue illustrating key headings which includes current updates, daily transportation status, monthly transportation status, total revenue with weekly, monthly and quarterly revenue and feedback from clients. Showcasing this set of slides titled Logistics KPI Dashboard Of Delivery Company With Revenue Ppt Show PDF. The topics addressed in these templates are Daily Transportation Status, Monthly Transportation Status, Total Revenue. All the content presented in this PPT design is completely editable. Download it and make adjustments in color, background, font etc. as per your unique business setting.
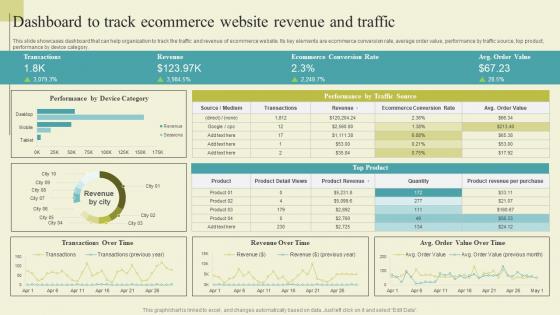
Dashboard To Track Ecommerce Website Revenue Successful Guide For Ecommerce Background Pdf
This slide showcases dashboard that can help organization to track the traffic and revenue of ecommerce website. Its key elements are ecommerce conversion rate, average order value, performance by traffic source, top product, performance by device category. Boost your pitch with our creative Dashboard To Track Ecommerce Website Revenue Successful Guide For Ecommerce Background Pdf. Deliver an awe-inspiring pitch that will mesmerize everyone. Using these presentation templates you will surely catch everyones attention. You can browse the ppts collection on our website. We have researchers who are experts at creating the right content for the templates. So you do not have to invest time in any additional work. Just grab the template now and use them. This slide showcases dashboard that can help organization to track the traffic and revenue of ecommerce website. Its key elements are ecommerce conversion rate, average order value, performance by traffic source, top product, performance by device category.
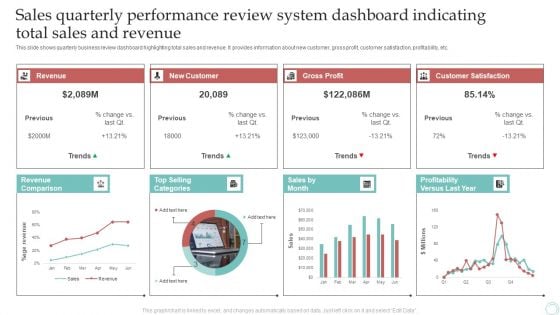
Sales Quarterly Performance Review System Dashboard Indicating Total Sales And Revenue Download PDF
This slide shows quarterly business review dashboard highlighting total sales and revenue. It provides information about new customer, gross profit, customer satisfaction, profitability, etc. Pitch your topic with ease and precision using this Sales Quarterly Performance Review System Dashboard Indicating Total Sales And Revenue Download PDF. This layout presents information on Revenue, New Customer, Gross Profit. It is also available for immediate download and adjustment. So, changes can be made in the color, design, graphics or any other component to create a unique layout.

Best Practices Increase Revenue Out Indirect Channel Sales Plan Financials Dashboard Topics PDF
Deliver an awe inspiring pitch with this creative best practices increase revenue out indirect channel sales plan financials dashboard topics pdf bundle. Topics like distribution, sales, representative, locations, revenue can be discussed with this completely editable template. It is available for immediate download depending on the needs and requirements of the user.
Enhancing Financial Institution Operations Dashboard Tracking Customer Activities And Revenue Generated Microsoft PDF
Deliver and pitch your topic in the best possible manner with this enhancing financial institution operations dashboard tracking customer activities and revenue generated microsoft pdf. Use them to share invaluable insights on target, revenue, value, achievement and impress your audience. This template can be altered and modified as per your expectations. So, grab it now.
Modifying Banking Functionalities Dashboard Tracking Customer Activities And Revenue Generated Portrait PDF
This slide contains dashboard that will allow bank to track the customer activities in terms of new customer acquired, customer acquisition cost and overall revenue generated. Deliver and pitch your topic in the best possible manner with this enhancing financial institution operations dashboard tracking customer activities and revenue generated microsoft pdf. Use them to share invaluable insights on target, revenue, value, achievement and impress your audience. This template can be altered and modified as per your expectations. So, grab it now.
Effective Company Event Communication Plan Dashboard For Tracking Event Gross Revenue Portrait PDF
This slide covers metrics for analyzing gross revenue generated throughout the event. It includes a graphical and tabular representation of revenue generated via promo codes and tracking links. Deliver an awe inspiring pitch with this creative Effective Company Event Communication Plan Dashboard For Tracking Event Gross Revenue Portrait PDF bundle. Topics like Gross Revenue, Promo Codes, Tracking Links can be discussed with this completely editable template. It is available for immediate download depending on the needs and requirements of the user.
Effective Company Event Communication Tactics Dashboard For Tracking Event Gross Revenue Introduction PDF
This slide covers metrics for analyzing gross revenue generated throughout the event. It includes a graphical and tabular representation of revenue generated via promo codes and tracking links. Deliver an awe inspiring pitch with this creative Effective Company Event Communication Tactics Dashboard For Tracking Event Gross Revenue Introduction PDF bundle. Topics like Discount Claimed, Gross Revenue, Codes Tracking can be discussed with this completely editable template. It is available for immediate download depending on the needs and requirements of the user.
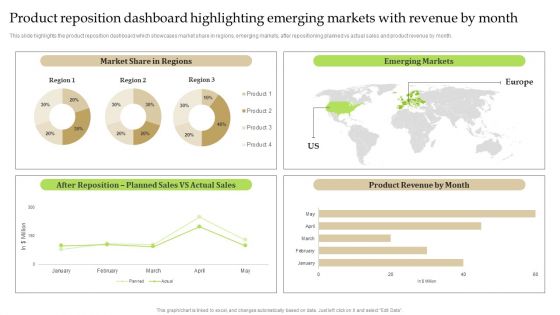
Product Reposition Dashboard Highlighting Emerging Markets With Revenue By Month Brochure PDF
This slide highlights the product reposition dashboard which showcases market share in regions, emerging markets, after repositioning planned vs actual sales and product revenue by month. Are you searching for a Product Reposition Dashboard Highlighting Emerging Markets With Revenue By Month Brochure PDF that is uncluttered, straightforward, and original Its easy to edit, and you can change the colors to suit your personal or business branding. For a presentation that expresses how much effort you have put in, this template is ideal. With all of its features, including tables, diagrams, statistics, and lists, its perfect for a business plan presentation. Make your ideas more appealing with these professional slides. Download Product Reposition Dashboard Highlighting Emerging Markets With Revenue By Month Brochure PDF from Slidegeeks today.
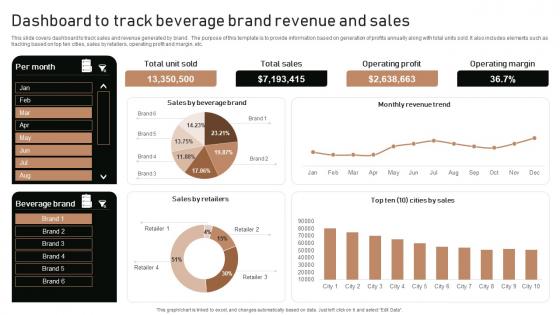
Execution Of Product Lifecycle Dashboard To Track Beverage Brand Revenue And Sales Ideas Pdf
This slide covers dashboard to track sales and revenue generated by brand . The purpose of this template is to provide information based on generation of profits annually along with total units sold. It also includes elements such as tracking based on top ten cities, sales by retailers, operating profit and margin, etc. From laying roadmaps to briefing everything in detail, our templates are perfect for you. You can set the stage with your presentation slides. All you have to do is download these easy-to-edit and customizable templates. Execution Of Product Lifecycle Dashboard To Track Beverage Brand Revenue And Sales Ideas Pdf will help you deliver an outstanding performance that everyone would remember and praise you for. Do download this presentation today. This slide covers dashboard to track sales and revenue generated by brand . The purpose of this template is to provide information based on generation of profits annually along with total units sold. It also includes elements such as tracking based on top ten cities, sales by retailers, operating profit and margin, etc.
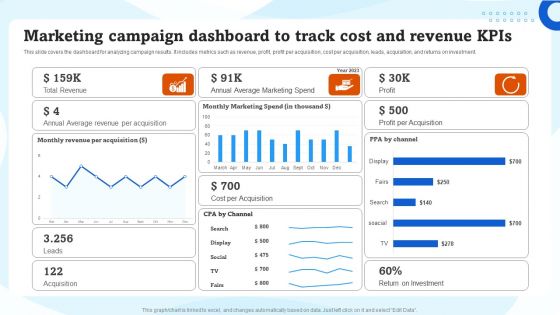
Marketing Campaign Dashboard To Track Cost And Revenue Kpis Ppt Infographics Good PDF
This slide covers the dashboard for analyzing campaign results. It includes metrics such as revenue, profit, profit per acquisition, cost per acquisition, leads, acquisition, and returns on investment. Formulating a presentation can take up a lot of effort and time, so the content and message should always be the primary focus. The visuals of the PowerPoint can enhance the presenters message, so our Marketing Campaign Dashboard To Track Cost And Revenue Kpis Ppt Infographics Good PDF was created to help save time. Instead of worrying about the design, the presenter can concentrate on the message while our designers work on creating the ideal templates for whatever situation is needed. Slidegeeks has experts for everything from amazing designs to valuable content, we have put everything into Marketing Campaign Dashboard To Track Cost And Revenue Kpis Ppt Infographics Good PDF.
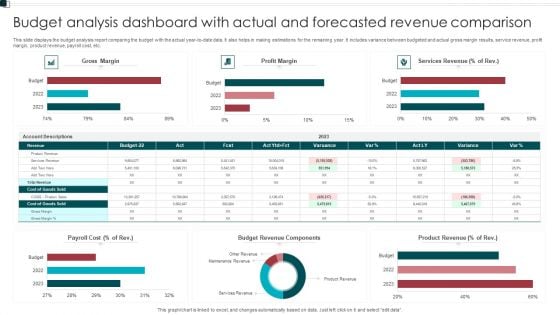
Budget Analysis Dashboard With Actual And Forecasted Revenue Comparison Structure PDF
This slide displays the budget analysis report comparing the budget with the actual year to date data. It also helps in making estimations for the remaining year. It includes variance between budgeted and actual gross margin results, service revenue, profit margin, product revenue, payroll cost, etc. Pitch your topic with ease and precision using this Budget Analysis Dashboard With Actual And Forecasted Revenue Comparison Structure PDF. This layout presents information on Payroll Cost, Budget Revenue Components, Product Revenue. It is also available for immediate download and adjustment. So, changes can be made in the color, design, graphics or any other component to create a unique layout.
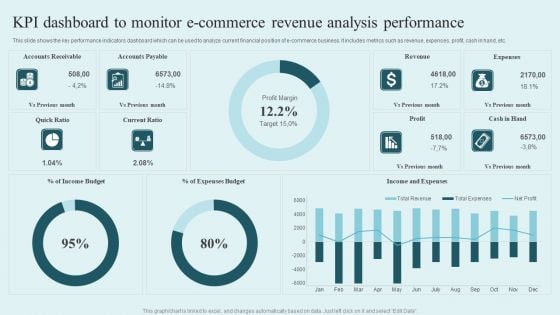
KPI Dashboard To Monitor E Commerce Revenue Analysis Performance Mockup PDF
This slide shows the key performance indicators dashboard which can be used to analyze current financial position of e-commerce business. It includes metrics such as revenue, expenses, profit, cash in hand, etc. Showcasing this set of slides titled KPI Dashboard To Monitor E Commerce Revenue Analysis Performance Mockup PDF. The topics addressed in these templates are Accounts Receivable, Accounts Payable, Revenue, Expenses. All the content presented in this PPT design is completely editable. Download it and make adjustments in color, background, font etc. as per your unique business setting.
Operations Of Commercial Bank Dashboard Tracking Customer Activities And Revenue Generated Inspiration PDF
This slide contains dashboard that will allow bank to track the customer activities in terms of new customer acquired, customer acquisition cost and overall revenue generated. Deliver and pitch your topic in the best possible manner with this operations of commercial bank dashboard tracking customer activities and revenue generated inspiration pdf. Use them to share invaluable insights on avg revenue per customer, customers acquisition cost, compared to previous year and impress your audience. This template can be altered and modified as per your expectations. So, grab it now.
Executing Online Solution In Banking Dashboard Tracking Customer Activities And Revenue Generated Information PDF
This slide contains dashboard that will allow bank to track the customer activities in terms of new customer acquired, customer acquisition cost and overall revenue generated. Deliver and pitch your topic in the best possible manner with this executing online solution in banking dashboard tracking customer activities and revenue generated information pdf. Use them to share invaluable insights on compared to previous year, target achievement, customers acquisition, actual revenue and impress your audience. This template can be altered and modified as per your expectations. So, grab it now.
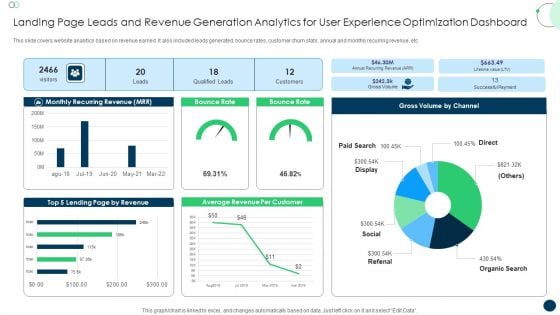
Landing Page Leads And Revenue Generation Analytics For User Experience Optimization Dashboard Formats PDF
This slide covers website analytics based on revenue earned. It also included leads generated, bounce rates, customer churn stats, annual and monthly recurring revenue, etc. Pitch your topic with ease and precision using this Landing Page Leads And Revenue Generation Analytics For User Experience Optimization Dashboard Formats PDF. This layout presents information on Monthly Recurring Revenue, Bounce Rate, Gross Volume. It is also available for immediate download and adjustment. So, changes can be made in the color, design, graphics or any other component to create a unique layout.
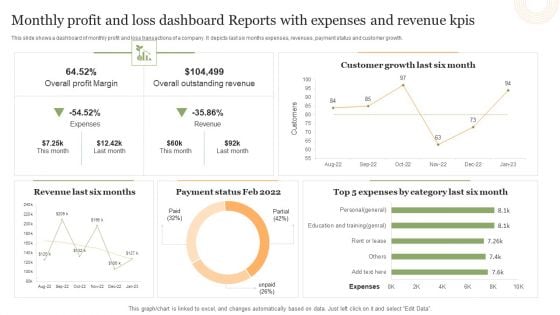
Monthly Profit And Loss Dashboard Reports With Expenses And Revenue Kpis Portrait PDF
This slide shows a dashboard of monthly profit and loss transactions of a company. It depicts last six months expenses, revenues, payment status and customer growth.Showcasing this set of slides titled Monthly Profit And Loss Dashboard Reports With Expenses And Revenue Kpis Portrait PDF. The topics addressed in these templates are Overall Profit Margin, Overall Outstanding Revenue, Customer Growth. All the content presented in this PPT design is completely editable. Download it and make adjustments in color, background, font etc. as per your unique business setting.
Company Event Communication Dashboard For Tracking Event Gross Revenue Themes PDF
This slide covers metrics for analyzing gross revenue generated throughout the event. It includes a graphical and tabular representation of revenue generated via promo codes and tracking links. Want to ace your presentation in front of a live audience Our Company Event Communication Dashboard For Tracking Event Gross Revenue Themes PDF can help you do that by engaging all the users towards you.. Slidegeeks experts have put their efforts and expertise into creating these impeccable powerpoint presentations so that you can communicate your ideas clearly. Moreover, all the templates are customizable, and easy-to-edit and downloadable. Use these for both personal and commercial use.
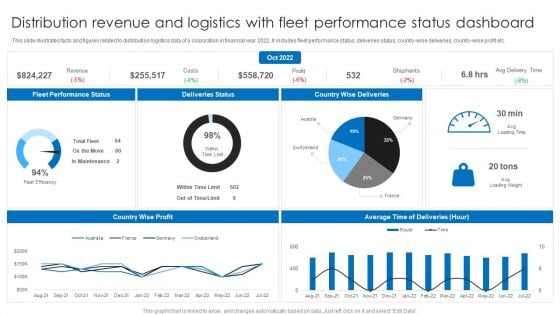
Distribution Revenue And Logistics With Fleet Performance Status Dashboard Ppt Layouts Background PDF
This slide illustrates facts and figures related to distribution logistics data of a corporation in financial year 2022. It includes fleet performance status, deliveries status, country-wise deliveries, country-wise profit etc. Pitch your topic with ease and precision using this Distribution Revenue And Logistics With Fleet Performance Status Dashboard Ppt Layouts Background PDF. This layout presents information on Deliveries Status, Country Wise Deliveries, Fleet Performance Status. It is also available for immediate download and adjustment. So, changes can be made in the color, design, graphics or any other component to create a unique layout.
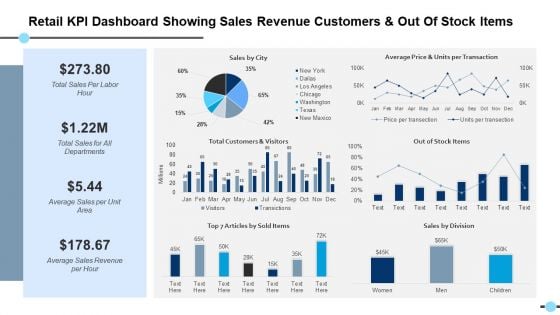
Retail Kpi Dashboard Showing Sales Revenue Customers And Out Of Stock Items Out Of Stock Items Ppt PowerPoint Presentation Files
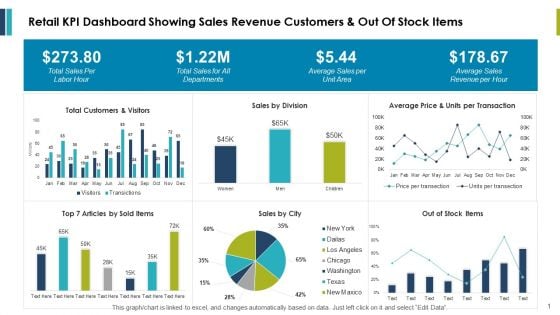
Retail Kpi Dashboard Showing Sales Revenue Customers And Out Of Stock Items Ppt PowerPoint Presentation Outline Example
This is a retail kpi dashboard showing sales revenue customers and out of stock items ppt powerpoint presentation outline example. This is a three stage process. The stages in this process are finance, marketing, management, investment, analysis.
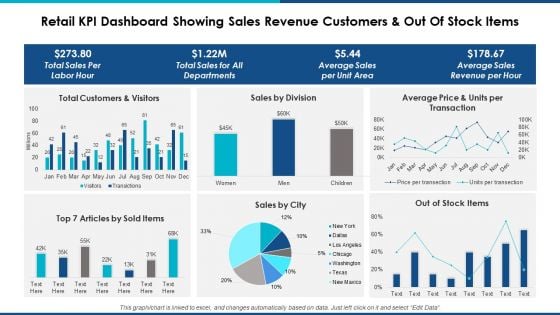
Retail Kpi Dashboard Showing Sales Revenue Customers And Out Of Stock Items Ppt Powerpoint Presentation Professional Background Designs
This is a retail kpi dashboard showing sales revenue customers and out of stock items ppt powerpoint presentation professional background designs. This is a six stage process. The stages in this process are finance, marketing, management, investment, analysis.
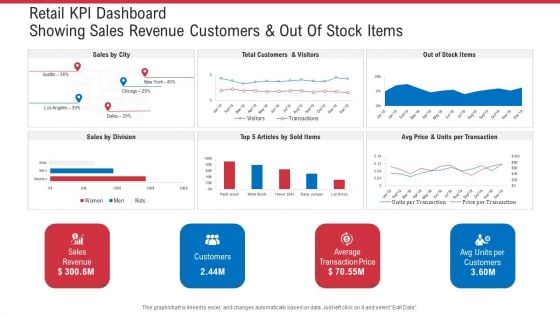
Retail KPI Dashboard Showing Sales Revenue Customers And Out Of Stock Items Ppt Ideas Graphics Design PDF
Deliver an awe-inspiring pitch with this creative retail KPI dashboard showing sales revenue customers and out of stock items ppt ideas graphics design pdf. bundle. Topics like sales revenue, average transaction price, avg units per customers can be discussed with this completely editable template. It is available for immediate download depending on the needs and requirements of the user.
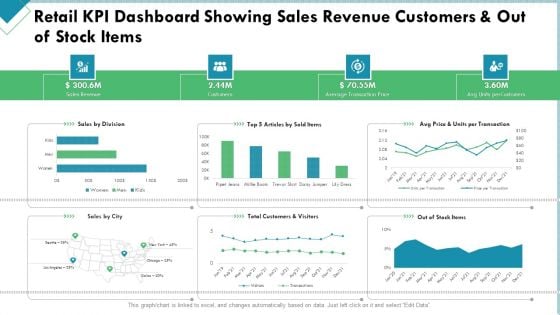
Market Analysis Of Retail Sector Retail KPI Dashboard Showing Sales Revenue Customers And Out Of Stock Items Structure PDF
Deliver and pitch your topic in the best possible manner with this market analysis of retail sector retail kpi dashboard showing sales revenue customers and out of stock items structure pdf. Use them to share invaluable insights on sales revenue, customers, average transaction price and impress your audience. This template can be altered and modified as per your expectations. So, grab it now.
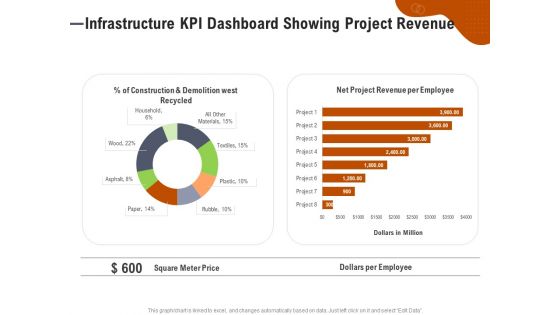
Key Features For Effective Business Management Infrastructure KPI Dashboard Showing Project Revenue Ppt Ideas File Formats PDF
Presenting this set of slides with name key features for effective business management infrastructure kpi dashboard showing project revenue ppt ideas file formats pdf. The topics discussed in these slides are construction and demolition west recycled, net project revenue per employee, square meter price, dollars per employee. This is a completely editable PowerPoint presentation and is available for immediate download. Download now and impress your audience.
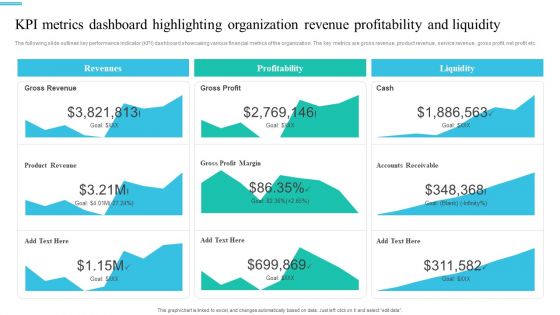
Monetary Planning And Evaluation Guide KPI Metrics Dashboard Highlighting Organization Revenue Profitability And Liquidity Ppt Diagram Images PDF
The following slide outlines key performance indicator KPI dashboard showcasing various financial metrics of the organization. The key metrics are gross revenue, product revenue, service revenue, gross profit, net profit etc. Coming up with a presentation necessitates that the majority of the effort goes into the content and the message you intend to convey. The visuals of a PowerPoint presentation can only be effective if it supplements and supports the story that is being told. Keeping this in mind our experts created Monetary Planning And Evaluation Guide KPI Metrics Dashboard Highlighting Organization Revenue Profitability And Liquidity Ppt Diagram Images PDF to reduce the time that goes into designing the presentation. This way, you can concentrate on the message while our designers take care of providing you with the right template for the situation.
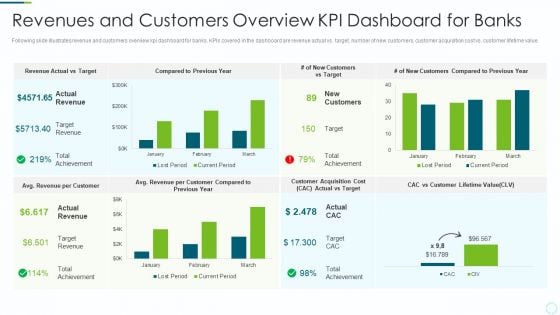
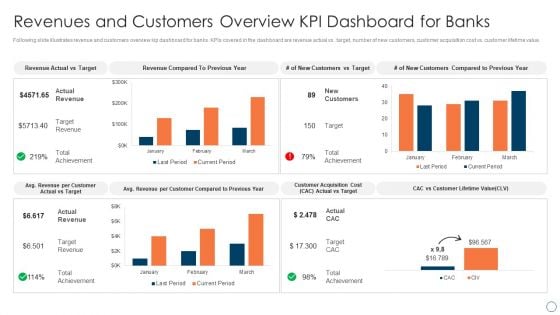
Implementing BPM Techniques Revenues And Customers Overview KPI Dashboard For Banks Microsoft PDF
Following slide illustrates revenue and customers overview kpi dashboard for banks. KPIs covered in the dashboard are revenue actual vs. target, number of new customers, customer acquisition cost vs. customer lifetime value. Deliver an awe inspiring pitch with this creative Implementing BPM Techniques Revenues And Customers Overview KPI Dashboard For Banks Microsoft PDF bundle. Topics like Target Revenue, Customers Compared, Customer Lifetime can be discussed with this completely editable template. It is available for immediate download depending on the needs and requirements of the user.
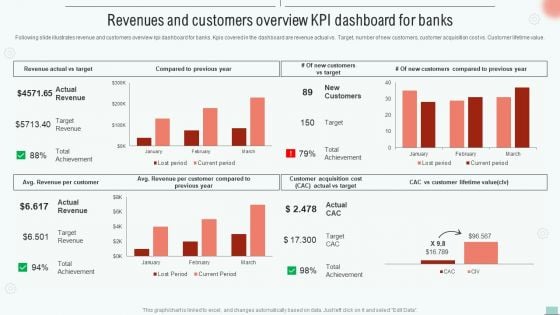
BPM Tools Application To Increase Revenues And Customers Overview KPI Dashboard For Banks Clipart PDF
Following slide illustrates revenue and customers overview kip dashboard for banks. KPIs covered in the dashboard are revenue actual vs. target, number of new customers, customer acquisition cost vs. customer lifetime value. Get a simple yet stunning designed BPM Tools Application To Increase Revenues And Customers Overview KPI Dashboard For Banks Clipart PDF. It is the best one to establish the tone in your meetings. It is an excellent way to make your presentations highly effective. So, download this PPT today from Slidegeeks and see the positive impacts. Our easy-to-edit BPM Tools Application To Increase Revenues And Customers Overview KPI Dashboard For Banks Clipart PDF can be your go-to option for all upcoming conferences and meetings. So, what are you waiting for Grab this template today.
Implementing BPM Tool To Enhance Operational Efficiency Revenues And Customers Overview Kpi Dashboard Rules PDF
Following slide illustrates revenue and customers overview kpi dashboard for banks. Kpis covered in the dashboard are revenue actual vs. Target, number of new customers, customer acquisition cost vs. Customer lifetime value.This Implementing BPM Tool To Enhance Operational Efficiency Revenues And Customers Overview Kpi Dashboard Rules PDF is perfect for any presentation, be it in front of clients or colleagues. It is a versatile and stylish solution for organizing your meetings. The Implementing BPM Tool To Enhance Operational Efficiency Revenues And Customers Overview Kpi Dashboard Rules PDF features a modern design for your presentation meetings. The adjustable and customizable slides provide unlimited possibilities for acing up your presentation. Slidegeeks has done all the homework before launching the product for you. So, do not wait, grab the presentation templates today.
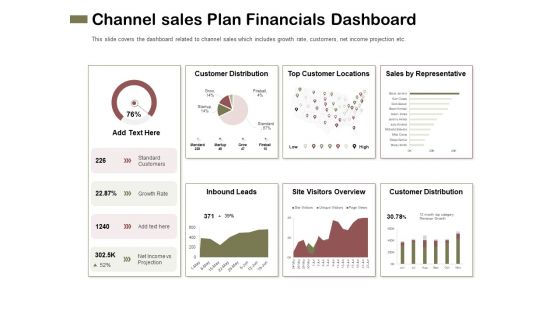
Promotional Channels And Action Plan For Increasing Revenues Channel Sales Plan Financials Dashboard Diagrams PDF
Deliver an awe inspiring pitch with this creative promotional channels and action plan for increasing revenues channel sales plan financials dashboard diagrams pdf bundle. Topics like distribution, sales, representative, locations, revenue can be discussed with this completely editable template. It is available for immediate download depending on the needs and requirements of the user.
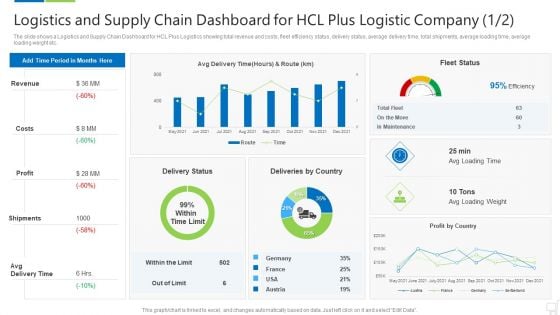
Logistics And Supply Chain Dashboard For Hcl Plus Logistic Company Revenue Themes PDF
The slide shows a Logistics and Supply Chain Dashboard for HCL Plus Logistics showing total revenue and costs, fleet efficiency status, delivery status, average delivery time, total shipments, average loading time, average loading weight etc. Deliver and pitch your topic in the best possible manner with this logistics and supply chain dashboard for hcl plus logistic company revenue themes pdf. Use them to share invaluable insights on revenue, costs, profit, shipments, avg delivery time and impress your audience. This template can be altered and modified as per your expectations. So, grab it now.

Revenue And Expense Budget Deficit Analysis With KPI Dashboard Rules PDF
Showcasing this set of slides titled Revenue And Expense Budget Deficit Analysis With KPI Dashboard Rules PDF. The topics addressed in these templates are Revenue And Expense, Budget Deficit Analysis. All the content presented in this PPT design is completely editable. Download it and make adjustments in color, background, font etc. as per your unique business setting.
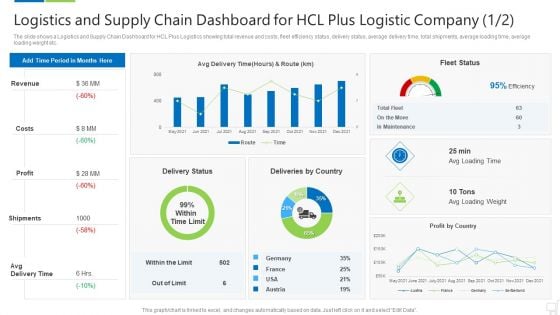
Logistics And Supply Chain Dashboard For Hcl Plus Logistic Company Revenue Structure PDF
The slide shows a Logistics and Supply Chain Dashboard for HCL Plus Logistics showing total revenue and costs, fleet efficiency status, delivery status, average delivery time, total shipments, average loading time, average loading weight etc. Deliver and pitch your topic in the best possible manner with this logistics and supply chain dashboard for hcl plus logistic company revenue structure pdf. Use them to share invaluable insights on logistics and supply chain dashboard for hcl plus logistic company and impress your audience. This template can be altered and modified as per your expectations. So, grab it now.
Sales Funnel Management For Revenue Generation Tracking Sales Pipeline And Lead Activity Dashboard Background PDF
This slide covers information regarding dashboard associated to tracking lead activity across sales pipeline. Deliver and pitch your topic in the best possible manner with this sales funnel management for revenue generation tracking sales pipeline and lead activity dashboard background pdf. Use them to share invaluable insights on team matterhorn, expansion opportunity, estimated value and impress your audience. This template can be altered and modified as per your expectations. So, grab it now.
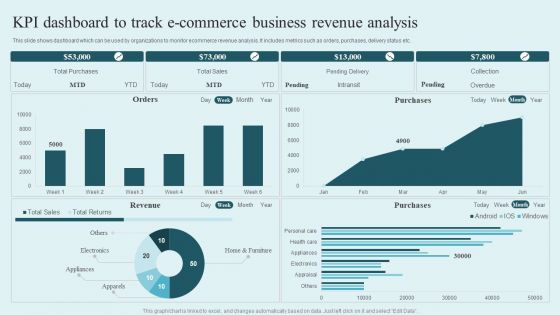
KPI Dashboard To Track E Commerce Business Revenue Analysis Rules PDF
This slide shows dashboard which can be used by organizations to monitor ecommerce revenue analysis. It includes metrics such as orders, purchases, delivery status etc. Pitch your topic with ease and precision using this KPI Dashboard To Track E Commerce Business Revenue Analysis Rules PDF. This layout presents information on Total Purchases, Total Sales, Pending Delivery, Collection. It is also available for immediate download and adjustment. So, changes can be made in the color, design, graphics or any other component to create a unique layout.
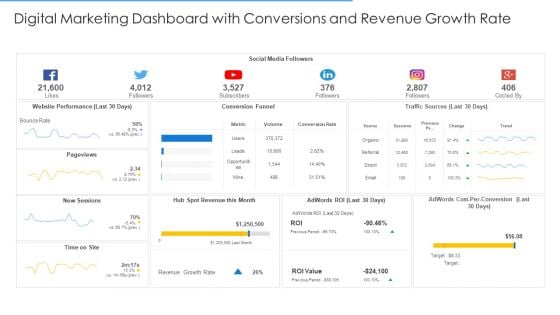
Online Merchandising Techniques Enhance Conversion Rate Digital Marketing Dashboard With Conversions And Revenue Growth Rate Elements PDF
Deliver and pitch your topic in the best possible manner with this online merchandising techniques enhance conversion rate digital marketing dashboard with conversions and revenue growth rate elements pdf. Use them to share invaluable insights on social media, website performance, conversion funnel, traffic sources and impress your audience. This template can be altered and modified as per your expectations. So, grab it now.
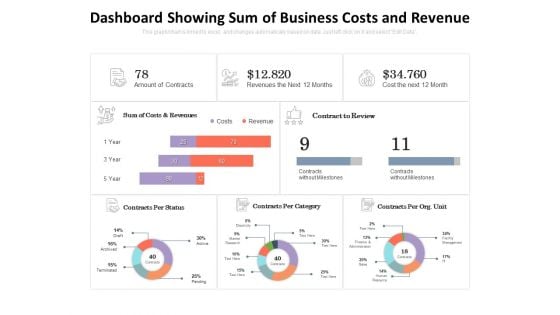
Dashboard Showing Sum Of Business Costs And Revenue Ppt PowerPoint Presentation Inspiration Gallery PDF
Presenting this set of slides with name dashboard showing sum of business costs and revenue ppt powerpoint presentation inspiration gallery pdf. The topics discussed in these slides are sum of costs and revenues, contract to review, contracts per org unit, contracts per category, contracts per status. This is a completely editable PowerPoint presentation and is available for immediate download. Download now and impress your audience.
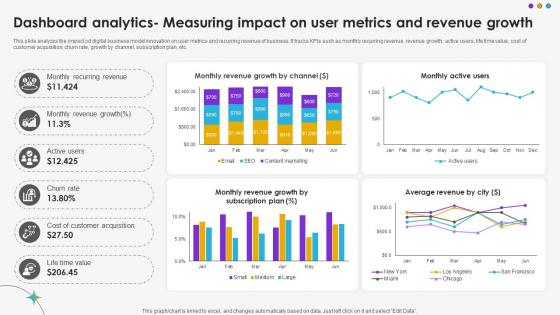
Dashboard Analytics Measuring Impact On User Metrics And Revenue Growth DT SS V
This slide analyzes the impact od digital business model innovation on user metrics and recurring revenue of business. It tracks KPIs such as monthly recurring revenue, revenue growth, active users, life time value, cost of customer acquisition, churn rate, growth by channel, subscription plan, etc.Are you searching for a Dashboard Analytics Measuring Impact On User Metrics And Revenue Growth DT SS V that is uncluttered, straightforward, and original Its easy to edit, and you can change the colors to suit your personal or business branding. For a presentation that expresses how much effort you have put in, this template is ideal With all of its features, including tables, diagrams, statistics, and lists, its perfect for a business plan presentation. Make your ideas more appealing with these professional slides. Download Dashboard Analytics Measuring Impact On User Metrics And Revenue Growth DT SS V from Slidegeeks today. This slide analyzes the impact od digital business model innovation on user metrics and recurring revenue of business. It tracks KPIs such as monthly recurring revenue, revenue growth, active users, life time value, cost of customer acquisition, churn rate, growth by channel, subscription plan, etc.
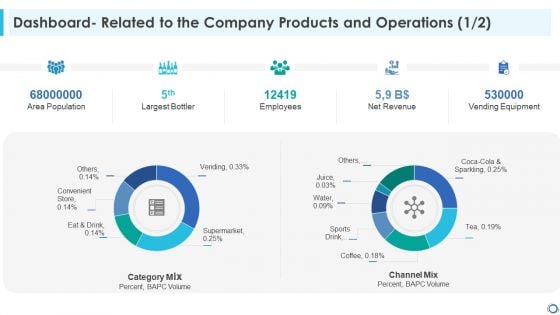
Dashboard Related To The Company Products And Operations Revenue Rules PDF
Deliver and pitch your topic in the best possible manner with this dashboard related to the company products and operations revenue rules pdf. Use them to share invaluable insights on area population, largest bottler, employees, net revenue, vending equipment and impress your audience. This template can be altered and modified as per your expectations. So, grab it now.
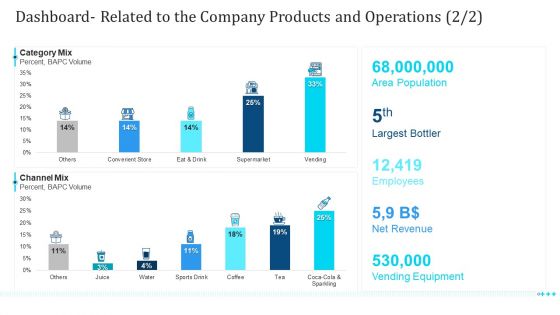
Dashboard Related To The Company Products And Operations Revenue Ppt Portfolio Deck PDF
Deliver and pitch your topic in the best possible manner with this dashboard related to the company products and operations revenue ppt portfolio deck pdf. Use them to share invaluable insights on dashboard related to the company products and operations and impress your audience. This template can be altered and modified as per your expectations. So, grab it now.
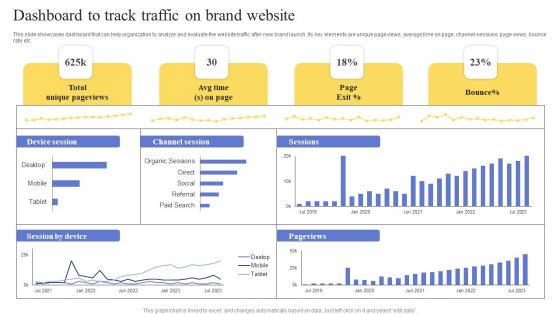
Dashboard To Track Traffic On Brand Website Maximizing Revenue Using Professional Pdf
This slide showcases dashboard that can help organization to analyze and evaluate the website traffic after new brand launch. Its key elements are unique page views, average time on page, channel sessions, page views, bounce rate etc. Are you in need of a template that can accommodate all of your creative concepts This one is crafted professionally and can be altered to fit any style. Use it with Google Slides or PowerPoint. Include striking photographs, symbols, depictions, and other visuals. Fill, move around, or remove text boxes as desired. Test out color palettes and font mixtures. Edit and save your work, or work with colleagues. Download Dashboard To Track Traffic On Brand Website Maximizing Revenue Using Professional Pdf and observe how to make your presentation outstanding. Give an impeccable presentation to your group and make your presentation unforgettable. This slide showcases dashboard that can help organization to analyze and evaluate the website traffic after new brand launch. Its key elements are unique page views, average time on page, channel sessions, page views, bounce rate etc.
Dashboard For Tracking And Measuring Business Sales And Revenue Ppt PowerPoint Presentation Slides Introduction PDF
Showcasing this set of slides titled dashboard for tracking and measuring business sales and revenue ppt powerpoint presentation slides introduction pdf. The topics addressed in these templates are revenue by pipeline jun 2020, new deals by month this year 2020, forecast june 2020, revenue goal attainment by owner jun 2020, revenue goal attainment jun 2020, pipeline coverage jul 2020. All the content presented in this PPT design is completely editable. Download it and make adjustments in color, background, font etc. as per your unique business setting.
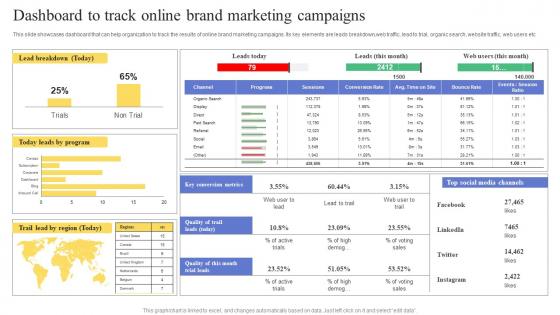
Dashboard To Track Online Brand Marketing Campaigns Maximizing Revenue Using Elements Pdf
This slide showcases dashboard that can help organization to track the results of online brand marketing campaigns. Its key elements are leads breakdown,web traffic, lead to trial, organic search, website traffic, web users etc. If you are looking for a format to display your unique thoughts, then the professionally designed Dashboard To Track Online Brand Marketing Campaigns Maximizing Revenue Using Elements Pdf is the one for you. You can use it as a Google Slides template or a PowerPoint template. Incorporate impressive visuals, symbols, images, and other charts. Modify or reorganize the text boxes as you desire. Experiment with shade schemes and font pairings. Alter, share or cooperate with other people on your work. Download Dashboard To Track Online Brand Marketing Campaigns Maximizing Revenue Using Elements Pdf and find out how to give a successful presentation. Present a perfect display to your team and make your presentation unforgettable. This slide showcases dashboard that can help organization to track the results of online brand marketing campaigns. Its key elements are leads breakdown,web traffic, lead to trial, organic search, website traffic, web users etc.
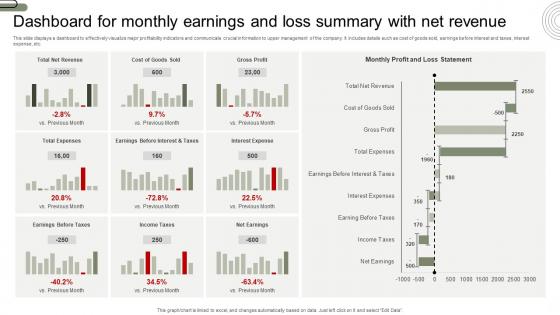
Dashboard For Monthly Earnings And Loss Summary With Net Revenue Background Pdf
This slide displays a dashboard to effectively visualize major profitability indicators and communicate crucial information to upper management of the company. It includes details such as cost of goods sold, earnings before interest and taxes, interest expense, etc. Pitch your topic with ease and precision using this Dashboard For Monthly Earnings And Loss Summary With Net Revenue Background Pdf. This layout presents information on Dashboard For Monthly Earnings, Loss Summary, Net Revenue. It is also available for immediate download and adjustment. So, changes can be made in the color, design, graphics or any other component to create a unique layout. This slide displays a dashboard to effectively visualize major profitability indicators and communicate crucial information to upper management of the company. It includes details such as cost of goods sold, earnings before interest and taxes, interest expense, etc.
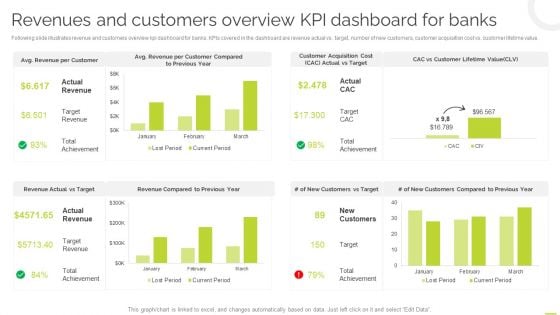
Effective BPM Tool For Business Process Management Revenues And Customers Overview KPI Dashboard For Banks Elements PDF
Following slide illustrates revenue and customers overview kpi dashboard for banks. KPIs covered in the dashboard are revenue actual vs target, number of new customers, customer acquisition cost vs. customer lifetime value. This Effective BPM Tool For Business Process Management Revenues And Customers Overview KPI Dashboard For Banks Elements PDF is perfect for any presentation, be it in front of clients or colleagues. It is a versatile and stylish solution for organizing your meetings. The Effective BPM Tool For Business Process Management Revenues And Customers Overview KPI Dashboard For Banks Elements PDF features a modern design for your presentation meetings. The adjustable and customizable slides provide unlimited possibilities for acing up your presentation. Slidegeeks has done all the homework before launching the product for you. So, do not wait, grab the presentation templates today.
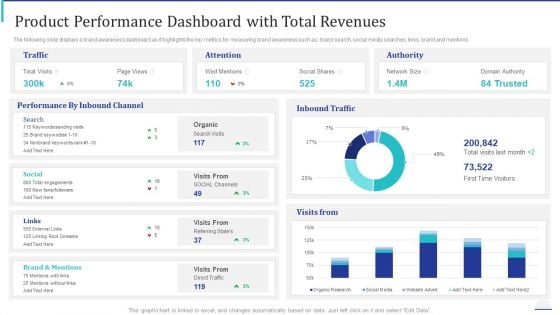
How Make Impactful Product Marketing Message Build Product Differentiation Product Performance Dashboard With Total Revenues Information PDF
The following slide displays a brand awareness dashboard as it highlights the key metrics for measuring brand awareness such as brand search, social media searches, links, brand and mentions. Deliver and pitch your topic in the best possible manner with this how make impactful product marketing message build product differentiation product performance dashboard with total revenues information pdf. Use them to share invaluable insights on social, organic, performance, traffic and impress your audience. This template can be altered and modified as per your expectations. So, grab it now.
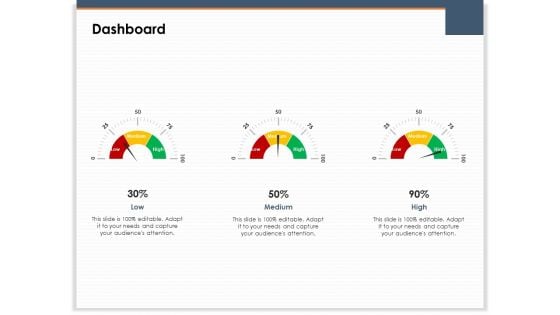
Main Revenues Progress Levers For Each Firm And Sector Dashboard Ppt PowerPoint Presentation File Images PDF
Presenting this set of slides with name main revenues progress levers for each firm and sector dashboard ppt powerpoint presentation file images pdf. The topics discussed in these slides are low, medium, high. This is a completely editable PowerPoint presentation and is available for immediate download. Download now and impress your audience.
Direct Marketing Dashboard For Tracking Business Revenues Efficient B2B And B2C Marketing Techniques For Organization Elements PDF
Purpose of the following slide is to show key metrics that can help the organization to track direct marketing efforts, it highlights essential KPIs such as NPS, customer by location etc.This Direct Marketing Dashboard For Tracking Business Revenues Efficient B2B And B2C Marketing Techniques For Organization Elements PDF is perfect for any presentation, be it in front of clients or colleagues. It is a versatile and stylish solution for organizing your meetings. The Direct Marketing Dashboard For Tracking Business Revenues Efficient B2B And B2C Marketing Techniques For Organization Elements PDF features a modern design for your presentation meetings. The adjustable and customizable slides provide unlimited possibilities for acing up your presentation. Slidegeeks has done all the homework before launching the product for you. So, do not wait, grab the presentation templates today.
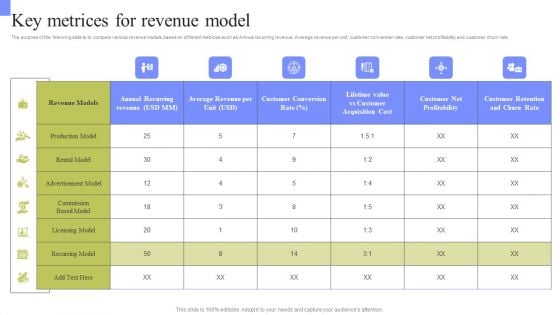
Periodic Revenue Model Key Metrices For Revenue Model Topics PDF
The purpose of the following slide is to compare various revenue models based on different metrices such as Annual recurring revenue, Average revenue per unit, customer conversion rate, customer net profitability and customer churn rate. Boost your pitch with our creative Periodic Revenue Model Key Metrices For Revenue Model Topics PDF. Deliver an awe-inspiring pitch that will mesmerize everyone. Using these presentation templates you will surely catch everyones attention. You can browse the ppts collection on our website. We have researchers who are experts at creating the right content for the templates. So you do not have to invest time in any additional work. Just grab the template now and use them.
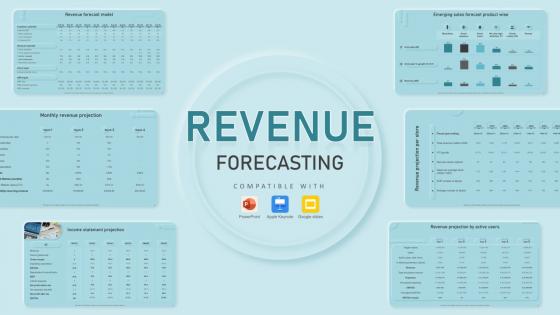
Revenue Forecasting Powerpoint Presentation Slides
Take advantage of this well-researched and professionally-designed Revenue Forecasting Powerpoint Presentation Slides to ace your next business meeting. Use this PPT complete deck to impress the management with your ideas for business growth and revenue increase. Use the Revenue Estimation, Sales Forecasting, Income Prediction, Financial Forecasting, Profit Projection-slide Template Bundle to leave no stone unturned as you present each step of your process. Employ the visual tools within the slides such as graphs, charts, and tables to ensure that the audience can never look away from the presentation. With attractive visuals, easy to understand structure, and your knowledge, your presentation will have the attention it deserves. Download this PPT Template from the link below. Plan your companys financial future with our Revenue Forecasting PowerPoint Slides. Including customizable templates, charts, and graphs, this deck simplifies income forecasting, revenue projections, and budgeting processes. Present financial data visually and showcase planning strategies with professional ease.
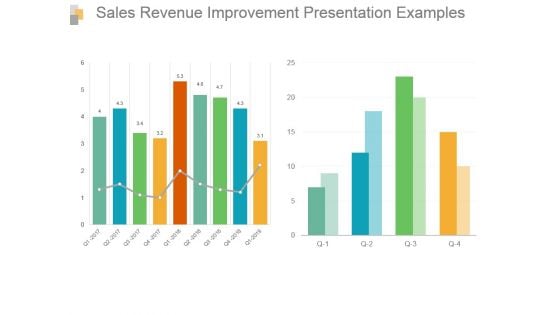
Sales Revenue Improvement Presentation Examples
This is a sales revenue improvement presentation examples. This is a two stage process. The stages in this process are bar graph, growth, sales, data, analysis.
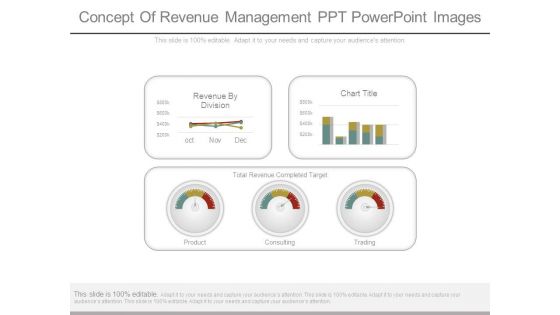
Concept Of Revenue Management Ppt Powerpoint Images
This is a concept of revenue management ppt powerpoint images. This is a five stage process. The stages in this process are revenue by division, chart title, total revenue completed target, product, consulting, trading.
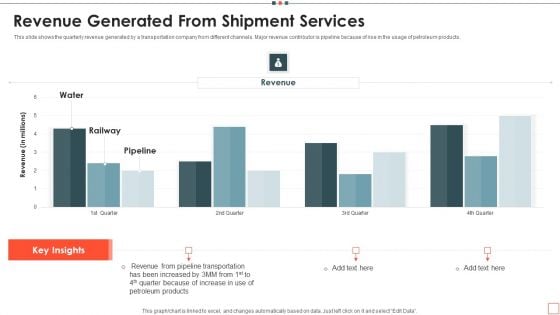
Revenue Generated From Shipment Services Topics PDF
This slide shows the quarterly revenue generated by a transportation company from different channels. Major revenue contributor is pipeline because of rise in the usage of petroleum products. Pitch your topic with ease and precision using this Shipment Services Company Monthly Dashboard Designs PDF. This layout presents information on Revenue Generated From Shipment Services. It is also available for immediate download and adjustment. So, changes can be made in the color, design, graphics or any other component to create a unique layout.
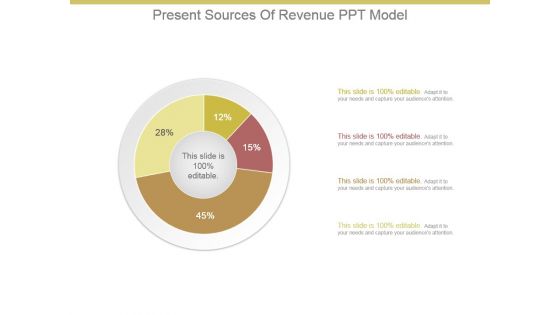
Present Sources Of Revenue Ppt Model
This is a present sources of revenue ppt model. This is a four stage process. The stages in this process are business, marketing, donut, percentage, management.
Cyclic Revenue Model Powerpoint Presentation Slides
Use this Cyclic Revenue Model Powerpoint Presentation Slides to ensure the business world gets to know you as a presentation expert with tremendous recall value. With its focus on providing the worlds best designs to highlight business ideas that have the potential to change the world, this PPT Template is sure to win you clients. The complete deck in Subscription Based Business Model, Saas Revenue Model, Monthly Recurring Revenue slides is a compendium of information, structured in a manner that provides the best framework for a presentation. Use this completely editable and customizable presentation to make an impact and improve your order book. Download now. A recurring revenue model ensures steady income as customers purchase products or services at predictable intervals. Our Cyclic Revenue Model presentation helps strategy managers boost revenue inflow by implementing structured revenue strategies. It highlights past financial issues like low profits and suggests effective solutions. The SaaS revenue model deck analyzes various revenue types based on factors like annual recurring revenue, customer conversion rates, and average revenue per unit. It also explores different recurring revenue models, their benefits, and implementation steps. The presentation includes key performance metrics such as churn rate and account expansion, with dashboards for tracking revenue performance. Get access now.
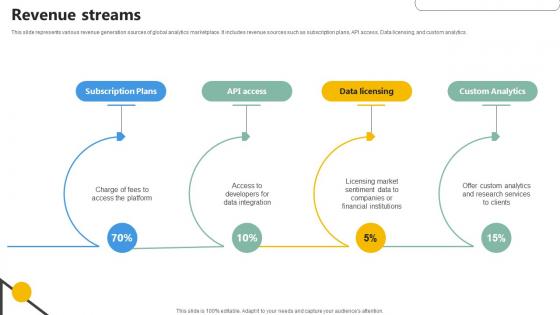
Revenue Streams Analytics Company Investor Funding Elevator
This slide represents various revenue generation sources of global analytics marketplace. It includes revenue sources such as subscription plans, API access, Data licensing, and custom analytics.This Revenue Streams Analytics Company Investor Funding Elevator is perfect for any presentation, be it in front of clients or colleagues. It is a versatile and stylish solution for organizing your meetings. The Revenue Streams Analytics Company Investor Funding Elevator features a modern design for your presentation meetings. The adjustable and customizable slides provide unlimited possibilities for acing up your presentation. Slidegeeks has done all the homework before launching the product for you. So, do not wait, grab the presentation templates today This slide represents various revenue generation sources of global analytics marketplace. It includes revenue sources such as subscription plans, API access, Data licensing, and custom analytics.
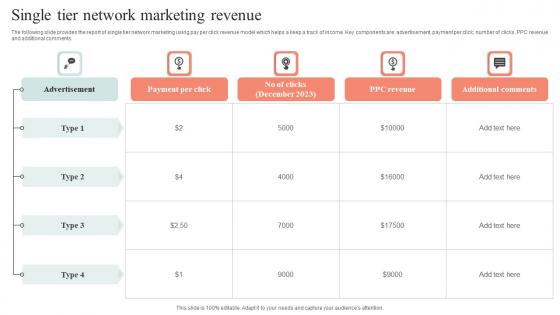
Single Tier Network Marketing Revenue Formats Pdf
The following slide provides the report of single tier network marketing using pay per click revenue model which helps a keep a track of income. Key components are advertisement, payment per click, number of clicks, PPC revenue and additional comments. Showcasing this set of slides titled Single Tier Network Marketing Revenue Formats Pdf. The topics addressed in these templates are Single Tier Network, Marketing Revenue. All the content presented in this PPT design is completely editable. Download it and make adjustments in color, background, font etc. as per your unique business setting. The following slide provides the report of single tier network marketing using pay per click revenue model which helps a keep a track of income. Key components are advertisement, payment per click, number of clicks, PPC revenue and additional comments.
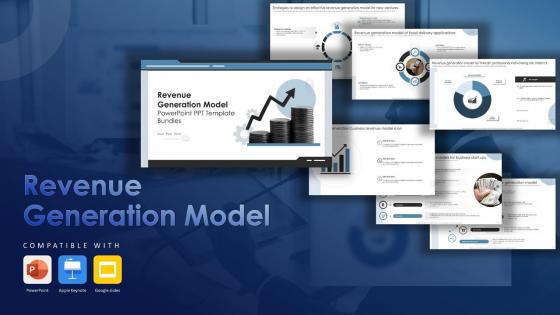
Revenue Generation Model Powerpoint Ppt Template Bundles
Using this ready-made PowerPoint slide, you can incorporate your own data to make an impact with your business innovation and clarity of goals. Use this brilliantly designed Revenue Generation Model Powerpoint Ppt Template Bundles to showcase how ultimately all business concepts are related. This presentation template can also be used to record resource allocation in a visual form. The B2B Revenue Model, Ecommerce Revenue Model, Start Up Revenue Models-Slide Revenue Generation Model Powerpoint Ppt Template Bundles is suitable for all your business needs, where you need to make sure that all bases are covered. Download this PPT template now to start a journey on your chosen business, with customer satisfaction the key aim. Our Revenue Generation Model PowerPoint PPT Template Bundles are creatively designed to enhance any presentation. Use them to deliver a professional and polished look.
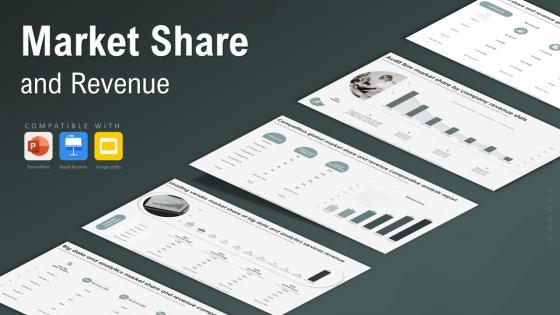
Market Share And Revenue Powerpoint Ppt
This Market Share And Revenue Powerpoint Ppt is designed to help you retain your audiences attention. This content-ready PowerPoint Template enables you to take your audience on a journey and share information in a way that is easier to recall. It helps you highlight the crucial parts of your work so that the audience does not get saddled with information download. This Market Share And Revenue From Sales, Big Data Market Share, Competitors Market Share, Unit Market And Revenue Share-slide PPT Deck comes prepared with the graphs and charts you could need to showcase your information through visuals. You only need to enter your own data in them. Download this editable PowerPoint Theme and walk into that meeting with confidence. The Market Share and Revenue PowerPoint PPT is a dynamic presentation template designed to analyze and showcase a companys market performance. It features visually appealing slides covering market share trends, revenue growth comparisons, and competitive analysis. This template includes charts, graphs, and infographics to clearly communicate key metrics and business insights. Ideal for business analysts, marketing professionals, and executives, it enables users to highlight strategic achievements, performance benchmarks, and growth opportunities effectively.


 Continue with Email

 Home
Home


