Revenue Graph
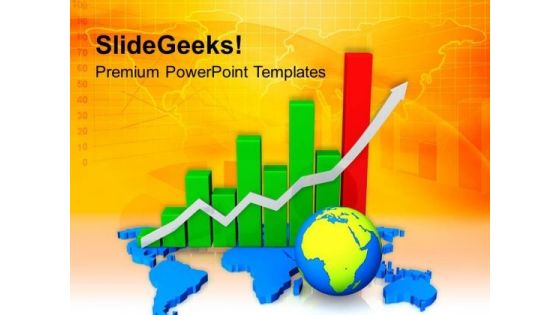
World Business Growth Graph PowerPoint Templates Ppt Backgrounds For Slides 0413
We present our World Business Growth Graph PowerPoint Templates PPT Backgrounds For Slides 0413.Use our Process and Flows PowerPoint Templates because They will Put your wonderful verbal artistry on display. Our PowerPoint Templates and Slides will provide you the necessary glam and glitter. Use our Globe PowerPoint Templates because Our PowerPoint Templates and Slides team portray an attitude of elegance. Personify this quality by using them regularly. Use our Earth PowerPoint Templates because you should Whip up a frenzy with our PowerPoint Templates and Slides. They will fuel the excitement of your team. Download and present our Business PowerPoint Templates because Our PowerPoint Templates and Slides are aesthetically designed to attract attention. We gaurantee that they will grab all the eyeballs you need. Use our Arrows PowerPoint Templates because Our PowerPoint Templates and Slides are focused like a searchlight beam. They highlight your ideas for your target audience.Use these PowerPoint slides for presentations relating to Profit growth charts with world globe, process and flows, globe, earth, business, arrows. The prominent colors used in the PowerPoint template are Green, Blue, Red. Our World Business Growth Graph PowerPoint Templates Ppt Backgrounds For Slides 0413 are committed to benefit you. They ensure your thoughts get the credit.
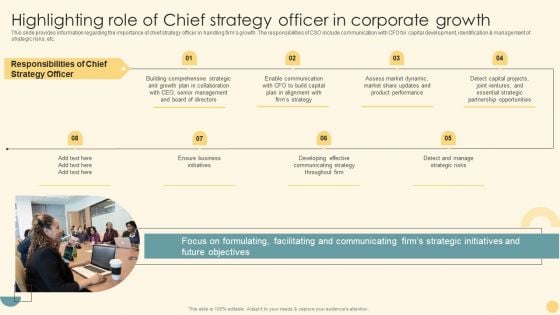
Highlighting Role Of Chief Strategy Officer In Corporate Growth Ppt PowerPoint Presentation Diagram Graph Charts PDF
This slide provides information regarding the importance of chief strategy officer in handling firms growth. The responsibilities of CSO include communication with CFO for capital development, identification and management of strategic risks, etc. Slidegeeks is here to make your presentations a breeze with Highlighting Role Of Chief Strategy Officer In Corporate Growth Ppt PowerPoint Presentation Diagram Graph Charts PDF With our easy to use and customizable templates, you can focus on delivering your ideas rather than worrying about formatting. With a variety of designs to choose from, you are sure to find one that suits your needs. And with animations and unique photos, illustrations, and fonts, you can make your presentation pop. So whether you are giving a sales pitch or presenting to the board, make sure to check out Slidegeeks first.
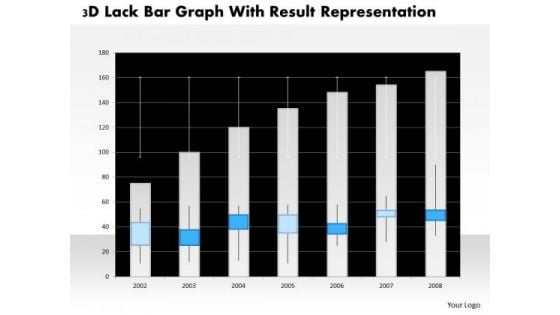
Business Diagram 3d Lack Bar Graph With Result Representation PowerPoint Slide
This business diagram has graphic of 3d lack bar graph. This diagram is a data visualization tool that gives you a simple way to present statistical information. This slide helps your audience examine and interpret the data you present.

Business Diagram Human Face With Colored Graph For Data Analysis PowerPoint Slide
This diagram displays human face graphic with colored graph. This diagram can be used to represent strategy, planning, thinking of business plan. Display business options in your presentations by using this creative diagram.
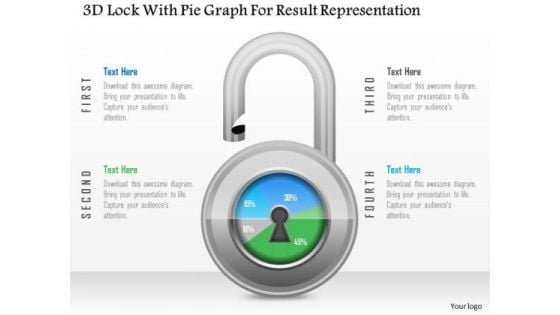
Business Diagram 3d Lock With Pie Graph For Result Representation PowerPoint Slide
This Power Point diagram has been crafted with pie chart in shape of lock. It contains diagram of lock pie chart to compare and present data in an effective manner. Use this diagram to build professional presentations for your viewers.
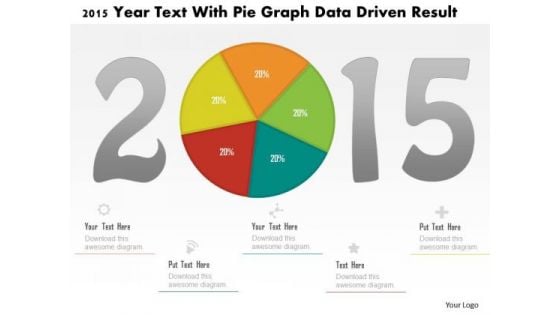
Business Diagram 2015 Year Text With Pie Graph Data Driven Result PowerPoint Slide
This business diagram displays 2015 year numbers with pie chart. This diagram is suitable to display business strategy for year 2015. Download this professional slide to present information in an attractive manner

Business Diagram Data Driven Bar Graph And Pie Chart For Analysis PowerPoint Slide
This PowerPoint template displays technology gadgets with various business charts. Use this diagram slide, in your presentations to make business reports for statistical analysis. You may use this diagram to impart professional appearance to your presentations.
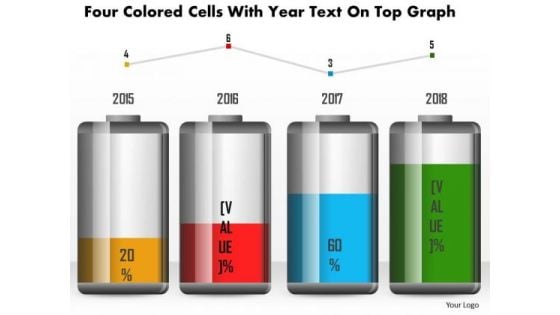
Business Diagram Four Colored Cells With Year Text On Top Graph PowerPoint Slide
This business diagram has been designed with battery cell graphic for business timeline. This slide can be used for business planning and management. Use this diagram for your business and success milestones related presentations.
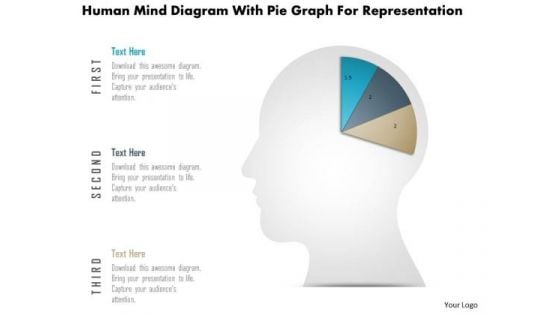
Business Diagram Human Mind Diagram With Pie Graph For Representation PowerPoint Slide
This diagram displays human face graphic divided into sections. This section can be used for data display. Use this diagram to build professional presentations for your viewers.
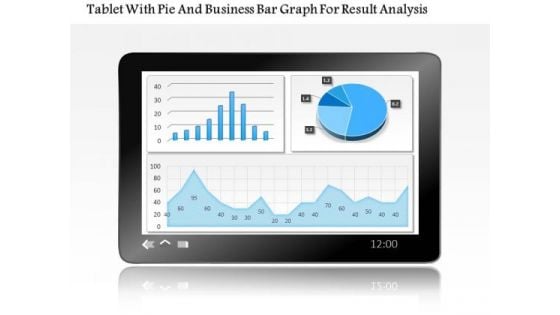
Business Diagram Tablet With Pie And Business Bar Graph For Result Analysis PowerPoint Slide
This PowerPoint template displays technology gadgets with various business charts. Use this diagram slide, in your presentations to make business reports for statistical analysis. You may use this diagram to impart professional appearance to your presentations.

Business Diagram Three Staged Pencil Diagram For Graph Formation PowerPoint Slide
This business diagram displays set of pencils. This Power Point template has been designed to compare and present business data. Download this diagram to represent stages of business growth.
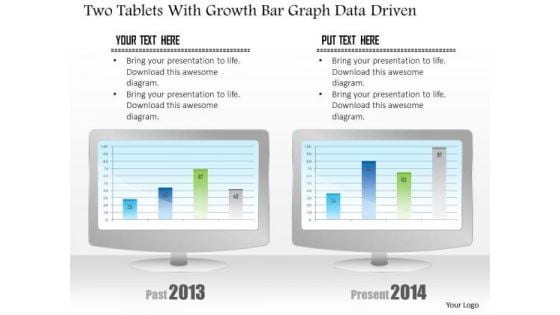
Business Diagram Two Tablets With Growth Bar Graph Data Driven PowerPoint Slide
This business diagram has been designed with comparative charts on tablets. This slide suitable for data representation. You can also use this slide to present business reports and information. Use this diagram to present your views in a wonderful manner.

Business Graph With Arrow Globe PowerPoint Templates And PowerPoint Backgrounds 0511
Microsoft PowerPoint Template and Background with business growth with arrows and globe Encourage your community to take action. Get them to back the cause you champion.
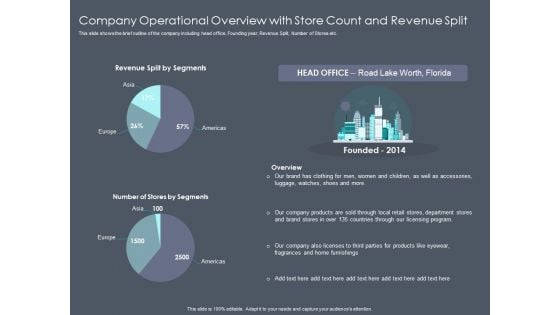
Private Equity Fund Pitch Deck To Raise Series C Funding Company Operational Overview With Store Count And Revenue Split Rules PDF
This slide shows the brief outline of the company including head office, Founding year, Revenue Split, Number of Stores etc. Deliver an awe-inspiring pitch with this creative private equity fund pitch deck to raise series c funding company operational overview with store count and revenue split rules pdf bundle. Topics like revenue split segments, number stores segments, licensing program, products can be discussed with this completely editable template. It is available for immediate download depending on the needs and requirements of the user.

Strategic Plan To Increase Sales Volume And Revenue Current Length Of Sales Cycle In Absence Of Effective Sales Strategy Ideas PDF
This slide shows details about the increasing Sales Cycle Length of the Company in the past 3 years. The reasons for increasing Sales cycle Length are poor lead generation, poor sales process optimization, using cold calling technique most of the times etc. Deliver an awe inspiring pitch with this creative strategic plan to increase sales volume and revenue current length of sales cycle in absence of effective sales strategy ideas pdf bundle. Topics like technique, sales, process, optimization can be discussed with this completely editable template. It is available for immediate download depending on the needs and requirements of the user.
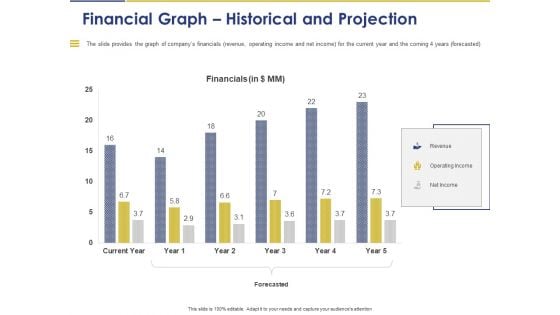
Convertible Note Pitch Deck Funding Strategy Financial Graph Historical And Projection Ppt PowerPoint Presentation Infographics Layouts PDF
Presenting this set of slides with name convertible note pitch deck funding strategy financial graph historical and projection ppt powerpoint presentation infographics layouts pdf. The topics discussed in these slides are financials, revenue, operating income, net income, forecasted. This is a completely editable PowerPoint presentation and is available for immediate download. Download now and impress your audience.
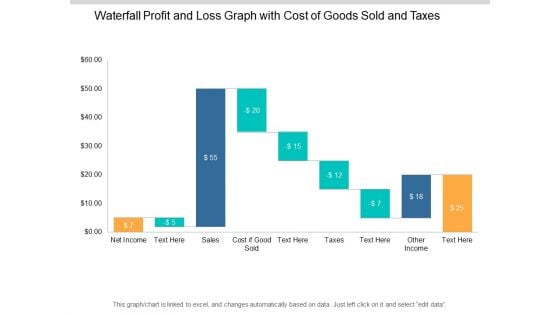
Waterfall Profit And Loss Graph With Cost Of Goods Sold And Taxes Ppt PowerPoint Presentation Show Slideshow
This is a waterfall profit and loss graph with cost of goods sold and taxes ppt powerpoint presentation show slideshow. This is a nine stage process. The stages in this process are sales waterfall, waterfall chart, business.
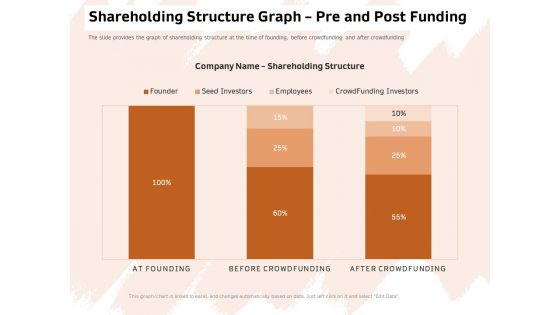
Investor Deck For Capital Generation From Substitute Funding Options Shareholding Structure Graph Pre And Post Funding Template PDF
Presenting this set of slides with name investor deck for capital generation from substitute funding options shareholding structure graph pre and post funding template pdf. The topics discussed in these slides are founder, seed investors, employees, crowdfunding investors. This is a completely editable PowerPoint presentation and is available for immediate download. Download now and impress your audience.
ROI On Capital Icon With Dollar Symbol And Graph Ppt PowerPoint Presentation Infographic Template Example Introduction PDF
Presenting roi on capital icon with dollar symbol and graph ppt powerpoint presentation infographic template example introduction pdf to dispense important information. This template comprises three stages. It also presents valuable insights into the topics including roi on capital icon with dollar symbol and graph. This is a completely customizable PowerPoint theme that can be put to use immediately. So, download it and address the topic impactfully.
Stock Market Analysis Magnifying Glass Over Bar Graph And Dollar Sign Ppt PowerPoint Presentation Icon Visual Aids
This is a stock market analysis magnifying glass over bar graph and dollar sign ppt powerpoint presentation icon visual aids. This is a four stage process. The stages in this process are stock market, financial markets, bull market.
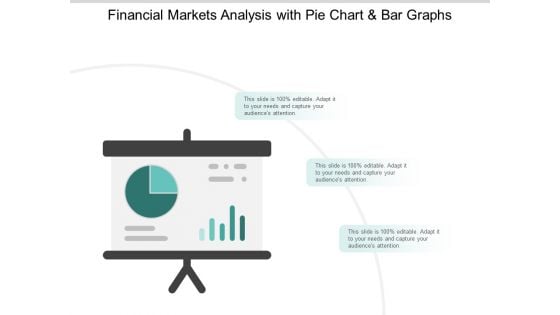
Stock Market Survey Reporting With Pie Chat And Bar Graph Ppt PowerPoint Presentation Infographic Template Example 2015
This is a stock market survey reporting with pie chat and bar graph ppt powerpoint presentation infographic template example 2015. This is a three stage process. The stages in this process are stock market, financial markets, bull market.
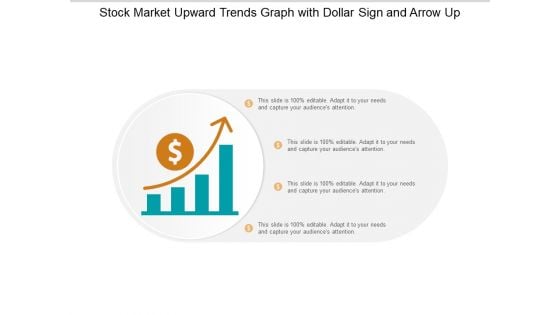
Stock Market Upward Trends Graph With Dollar Sign And Arrow Up Ppt PowerPoint Presentation Professional Graphics Download
This is a stock market upward trends graph with dollar sign and arrow up ppt powerpoint presentation professional graphics download. This is a four stage process. The stages in this process are stock market, financial markets, bull market.
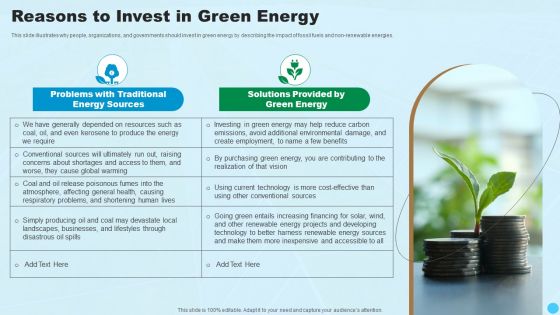
Reasons To Invest In Green Energy Clean And Renewable Energy Ppt PowerPoint Presentation Diagram Graph Charts PDF
This slide illustrates why people, organizations, and governments should invest in green energy by describing the impact of fossil fuels and non-renewable energies.Presenting Reasons To Invest In Green Energy Clean And Renewable Energy Ppt PowerPoint Presentation Diagram Graph Charts PDF to provide visual cues and insights. Share and navigate important information on two stages that need your due attention. This template can be used to pitch topics like Problems Traditional, Energy Sources, Solutions Provided. In addtion, this PPT design contains high resolution images, graphics, etc, that are easily editable and available for immediate download.
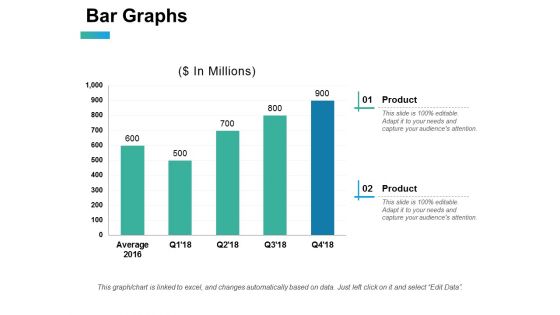
Bar Graphs Ppt PowerPoint Presentation Gallery Elements
This is a bar graphs ppt powerpoint presentation gallery elements. This is a two stage process. The stages in this process are Bar Graphs, Business, Strategy, Marketing, Analysis.
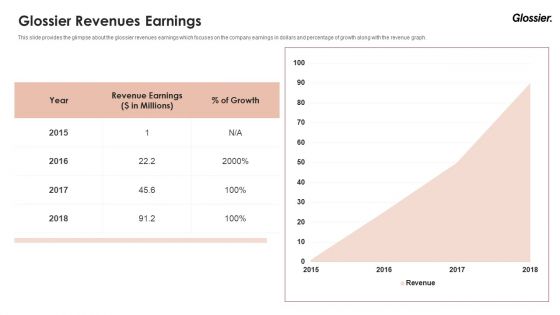
Glossier Financing Elevator Pitch Deck Glossier Revenues Earnings Ppt Slides Graphics Example PDF
This slide provides the glimpse about the glossier revenues earnings which focuses on the company earnings in dollars and percentage of growth along with the revenue graph. Deliver an awe-inspiring pitch with this creative glossier financing elevator pitch deck glossier revenues earnings ppt slides graphics example pdf bundle. Topics like glossier revenues earnings can be discussed with this completely editable template. It is available for immediate download depending on the needs and requirements of the user.
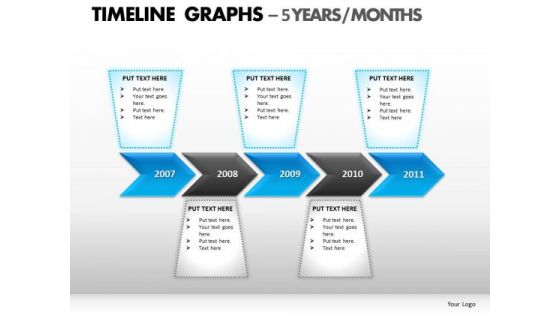
PowerPoint Process Download Timeline Graphs Ppt Template
PowerPoint Process Download TimeLine Graphs PPT Template-These high quality powerpoint pre-designed slides and powerpoint templates have been carefully created by our professional team to help you impress your audience. All slides have been created and are 100% editable in powerpoint. Each and every property of any graphic - color, size, orientation, shading, outline etc. can be modified to help you build an effective powerpoint presentation. Any text can be entered at any point in the powerpoint template or slide. Simply DOWNLOAD, TYPE and PRESENT! Research problems with our PowerPoint Process Download Timeline Graphs Ppt Template. Download without worries with our money back guaranteee.
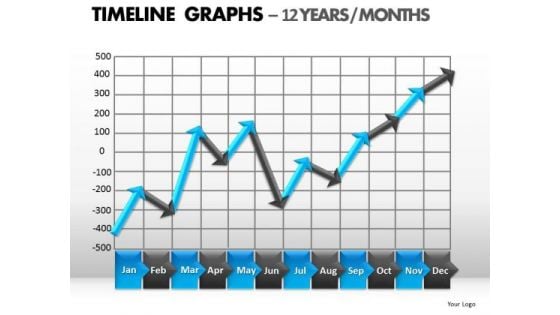
PowerPoint Slides Success Timeline Graphs Ppt Themes
PowerPoint Slides Success TimeLine Graphs PPT Themes-These high quality powerpoint pre-designed slides and powerpoint templates have been carefully created by our professional team to help you impress your audience. All slides have been created and are 100% editable in powerpoint. Each and every property of any graphic - color, size, orientation, shading, outline etc. can be modified to help you build an effective powerpoint presentation. Any text can be entered at any point in the powerpoint template or slide. Simply DOWNLOAD, TYPE and PRESENT! Perfect your presentations with our PowerPoint Slides Success Timeline Graphs Ppt Themes. Download without worries with our money back guaranteee.
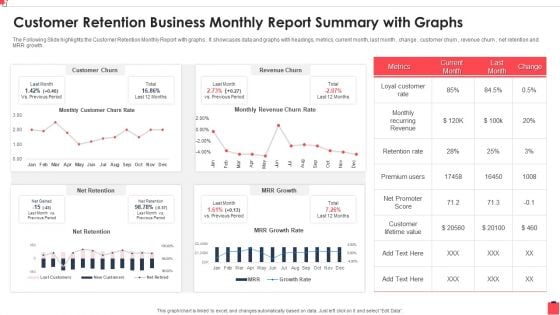
Customer Retention Business Monthly Report Summary With Graphs Guidelines PDF
The Following Slide highlights the Customer Retention Monthly Report with graphs . It showcases data and graphs with headings, metrics, current month, last month , change , customer churn , revenue churn , net retention and MRR growth. Showcasing this set of slides titled Customer Retention Business Monthly Report Summary With Graphs Guidelines PDF The topics addressed in these templates are Recurring Revenue, Customer Churn, Promoter Score All the content presented in this PPT design is completely editable. Download it and make adjustments in color, background, font etc. as per your unique business setting.
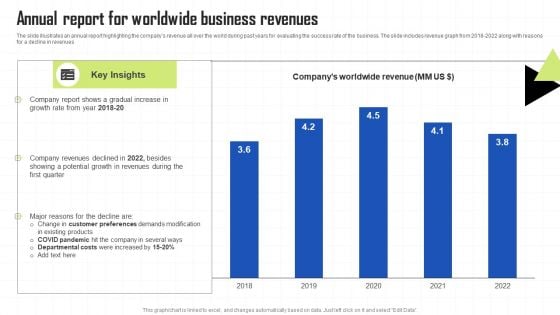
Key Techniques To Enhance Cost Efficiency Annual Report For Worldwide Business Revenues Professional PDF
The slide illustrates an annual report highlighting the companys revenue all over the world during past years for evaluating the success rate of the business. The slide includes revenue graph from 2018-2022 along with reasons for a decline in revenues Slidegeeks is one of the best resources for PowerPoint templates. You can download easily and regulate Key Techniques To Enhance Cost Efficiency Annual Report For Worldwide Business Revenues Professional PDF for your personal presentations from our wonderful collection. A few clicks is all it takes to discover and get the most relevant and appropriate templates. Use our Templates to add a unique zing and appeal to your presentation and meetings. All the slides are easy to edit and you can use them even for advertisement purposes.
CRM Software Revenues Forecast Icons PDF
This slide provides the glimpse of the CRM software revenues forecast which showcase revenues for upcoming 9 years.Deliver and pitch your topic in the best possible manner with this crm software revenues forecast icons pdf. Use them to share invaluable insights on crm software revenues forecast and impress your audience. This template can be altered and modified as per your expectations. So, grab it now.
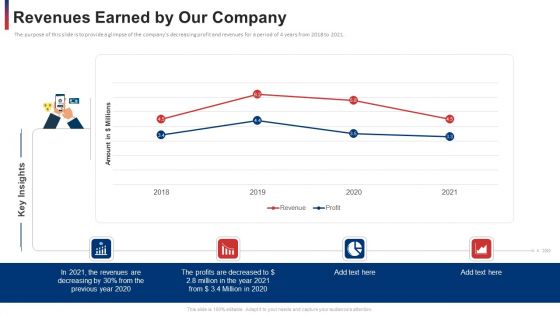
Revenues Earned By Our Company Themes PDF
The purpose of this slide is to provide a glimpse of the companys decreasing profit and revenues for a period of 4 years from 2018 to 2021. Deliver and pitch your topic in the best possible manner with this revenues earned by our company themes pdf. Use them to share invaluable insights on revenues earned by our company and impress your audience. This template can be altered and modified as per your expectations. So, grab it now.
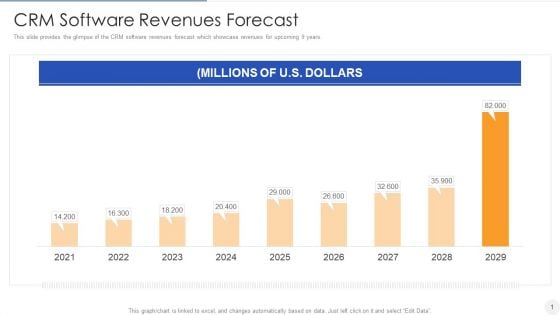
CRM Software Revenues Forecast Template PDF
Deliver an awe inspiring pitch with this creative crm software revenues forecast template pdf bundle. Topics like crm software revenues forecast can be discussed with this completely editable template. It is available for immediate download depending on the needs and requirements of the user.
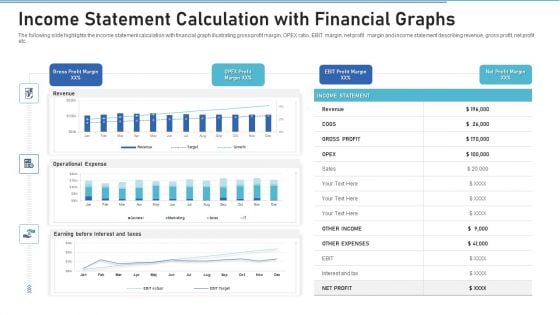
Income Statement Calculation With Financial Graphs Pictures PDF
Showcasing this set of slides titled income statement calculation with financial graphs pictures pdf. The topics addressed in these templates are revenue, gross profit, expenses. All the content presented in this PPT design is completely editable. Download it and make adjustments in color, background, font etc. as per your unique business setting.
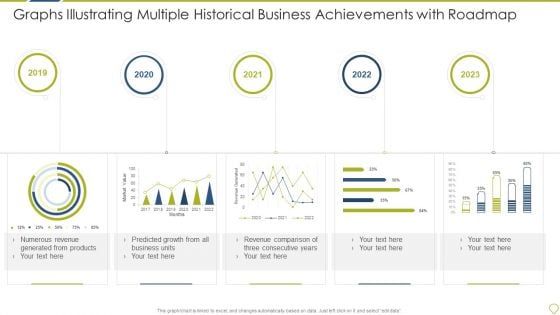
Graphs Illustrating Multiple Historical Business Achievements With Roadmap Themes PDF
Showcasing this set of slides titled graphs illustrating multiple historical business achievements with roadmap themes pdf. The topics addressed in these templates are revenue, business, growth. All the content presented in this PPT design is completely editable. Download it and make adjustments in color, background, font etc. as per your unique business setting.
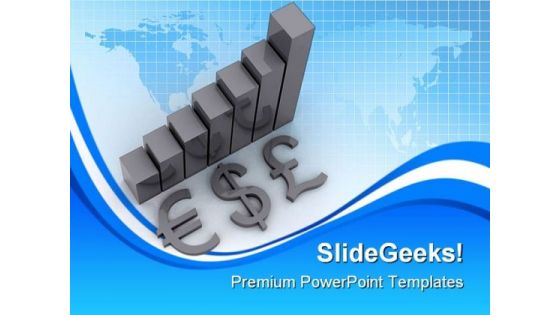
Graphs And Currency Business PowerPoint Templates And PowerPoint Backgrounds 0211
Microsoft PowerPoint Template and Background with black graphs with currency signs Make informative presentations with our Graphs And Currency Business PowerPoint Templates And PowerPoint Backgrounds 0211. Dont waste time struggling with PowerPoint. Let us do it for you.
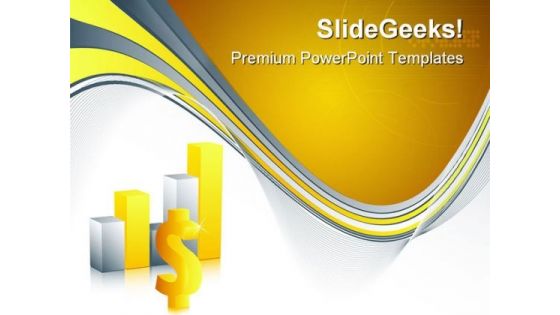
Abstract Bar Graphs Business PowerPoint Templates And PowerPoint Backgrounds 0411
Microsoft PowerPoint Template and Background with background with bar graphs, dollar sign and diagram Be an outperforming global competititor with our Abstract Bar Graphs Business PowerPoint Templates And PowerPoint Backgrounds 0411. They will make you look good.

Our Charts And Graphs Ppt PowerPoint Presentation File Visuals
This is a our charts and graphs ppt powerpoint presentation file visuals. This is a one stage process. The stages in this process are business, strategy, marketing, analysis, finance.
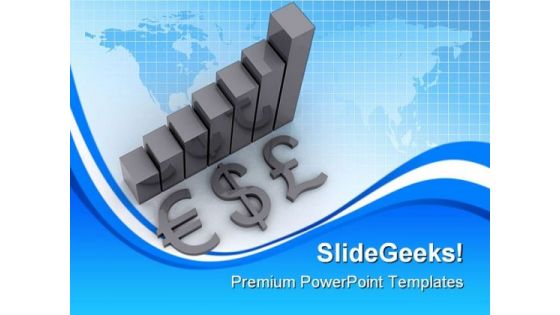
Graphs And Currency Business PowerPoint Themes And PowerPoint Slides 0211
Microsoft PowerPoint Theme and Slide with black graphs with currency signs Enumerate your ideas with our Graphs And Currency Business PowerPoint Themes And PowerPoint Slides 0211. Prioritize them as per your wish.
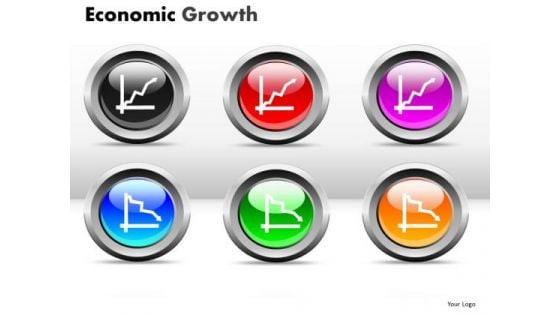
PowerPoint Graphs Going Up Or Down PowerPoint Slides
PowerPoint Graphs Going up or Down PowerPoint Slides-These high quality powerpoint pre-designed slides and powerpoint templates have been carefully created by our professional team to help you impress your audience. All slides have been created and are 100% editable in powerpoint. Each and every property of any graphic - color, size, orientation, shading, outline etc. can be modified to help you build an effective powerpoint presentation. Any text can be entered at any point in the powerpoint template or slide. Simply DOWNLOAD, TYPE and PRESENT!These PowerPoint designs and slide layouts can be used to in presentations relating to --Achievement, analysis, arrow, bank, banking, bar, business, capital, chart, coin, concept, credit, currency, deposit, diagram, earn, earnings, economics, finance, financial, gain, gold, golden, graph, growth, idea, interest, investment, isolated, make, marketing, monetary, money, company,computer,funding,grid,growing,green,growth,precut,statistics,succeed,tradc, savings, stack, strategy, success Be productive with our PowerPoint Graphs Going Up Or Down PowerPoint Slides. You will come out on top.

Our Graphs And Charts Ppt PowerPoint Presentation Infographics Infographics
This is a our graphs and charts ppt powerpoint presentation infographics infographics. This is a one stage process. The stages in this process are business, strategy, analysis, pretention, chart and graph.
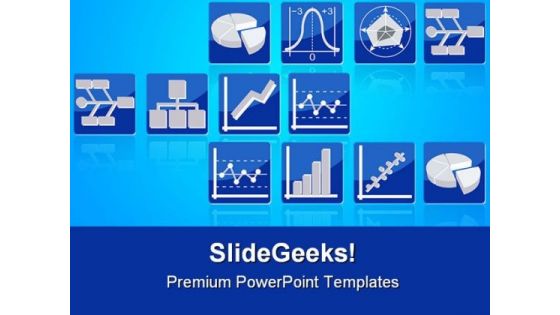
Charts Graphs Business PowerPoint Themes And PowerPoint Slides 0411
Microsoft PowerPoint Theme and Slide with set of icons with different types of charts and graphs Decrease wastage with our Charts Graphs Business PowerPoint Themes And PowerPoint Slides 0411. Download without worries with our money back guaranteee.
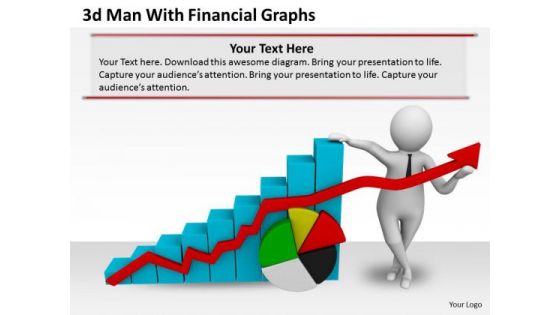
Business Strategy Execution 3d Man With Financial Graphs Concepts
Plan For All Contingencies With Our Business Strategy Execution 3D Man With Financial Graphs Concepts Powerpoint Templates. Douse The Fire Before It Catches.
Financial Planning Graphs For Investment Details Vector Icon Diagrams PDF
Presenting financial planning graphs for investment details vector icon diagrams pdf to dispense important information. This template comprises three stages. It also presents valuable insights into the topics including financial planning graphs for investment details vector icon. This is a completely customizable PowerPoint theme that can be put to use immediately. So, download it and address the topic impactfully.
Information Sheet Icon With Financial Graphs Download PDF
Persuade your audience using this information sheet icon with financial graphs download pdf. This PPT design covers three stages, thus making it a great tool to use. It also caters to a variety of topics including information sheet icon with financial graphs. Download this PPT design now to present a convincing pitch that not only emphasizes the topic but also showcases your presentation skills.
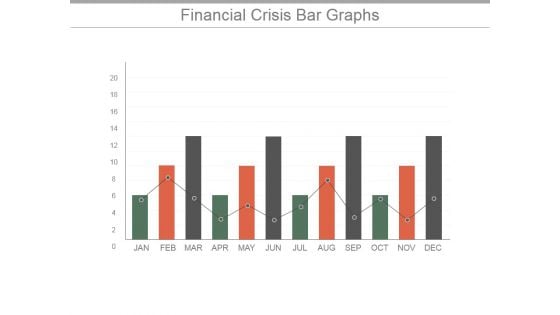
Financial Crisis Bar Graphs Ppt PowerPoint Presentation Background Images
This is a financial crisis bar graphs ppt powerpoint presentation background images. This is a twelve stage process. The stages in this process are business, analysis, strategy, finance, success, management.
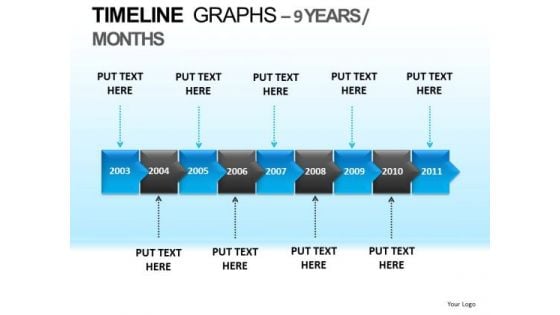
PowerPoint Template Company Growth Timeline Graphs Ppt Process
PowerPoint Template Company Growth timeline graphs PPT Process-These high quality, editable pre-designed powerpoint slides have been carefully created by our professional team to help you impress your audience. Each graphic in every slide is vector based and is 100% editable in powerpoint. Each and every property of any slide - color, size, shading etc can be modified to build an effective powerpoint presentation. Use these slides to convey complex business concepts in a simplified manner. Any text can be entered at any point in the powerpoint slide. Simply DOWNLOAD, TYPE and PRESENT! Rejuvenate your vision with our PowerPoint Template Company Growth Timeline Graphs Ppt Process. Download without worries with our money back guaranteee.
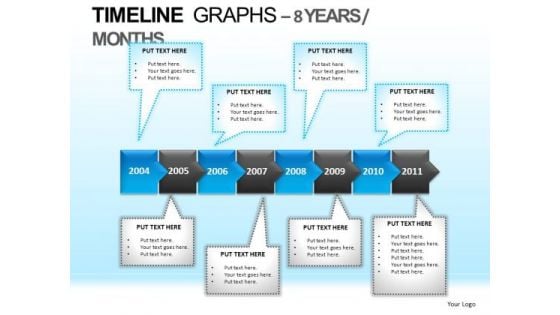
PowerPoint Slides Business Education Timeline Graphs Ppt Process
PowerPoint Slides Business Education timeline graphs PPT Process-These high quality, editable pre-designed powerpoint slides have been carefully created by our professional team to help you impress your audience. Each graphic in every slide is vector based and is 100% editable in powerpoint. Each and every property of any slide - color, size, shading etc can be modified to build an effective powerpoint presentation. Use these slides to convey complex business concepts in a simplified manner. Any text can be entered at any point in the powerpoint slide. Simply DOWNLOAD, TYPE and PRESENT! Test boundaries of presenting with our PowerPoint Slides Business Education Timeline Graphs Ppt Process. Download without worries with our money back guaranteee.
Growing Online Revenues PowerPoint Ppt Templates
Growing Online Revenues PowerPoint PPT templates-These high quality powerpoint pre-designed slides and powerpoint templates have been carefully created by our professional team to help you impress your audience. All slides have been created and are 100% editable in powerpoint. Each and every property of any graphic - color, size, orientation, shading, outline etc. can be modified to help you build an effective powerpoint presentation. Any text can be entered at any point in the powerpoint template or slide. Simply DOWNLOAD, TYPE and PRESENT!These PowerPoint designs and slide layouts can be used to in presentations relating to --Achievement, analysis, arrow, bank, banking, bar, business, capital, chart, coin, concept, credit, currency, deposit, diagram, earn, earnings, economics, finance, financial, gain, gold, golden, graph, growth, idea, interest, investment, isolated, make, marketing, monetary, money, company,computer,funding,grid,growing,green,growth,precut,statistics,succeed,tradc, savings, stack, strategy, success Our Growing Online Revenues PowerPoint Ppt Templates will be your alter ego. They will exemplify your thoughts.
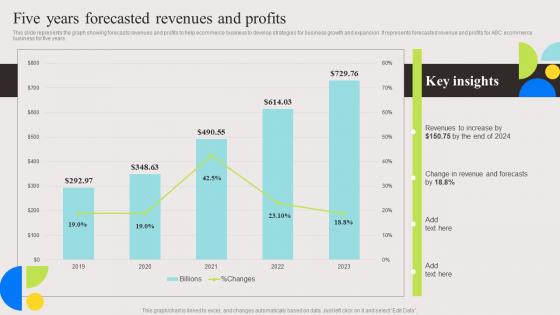
Five Years Forecasted Revenues And Evaluation And Deployment Of Enhanced Themes Pdf
This slide represents the graph showing forecasts revenues and profits to help ecommerce business to develop strategies for business growth and expansion. It represents forecasted revenue and profits for ABC ecommerce business for five years. Make sure to capture your audiences attention in your business displays with our gratis customizable Five Years Forecasted Revenues And Evaluation And Deployment Of Enhanced Themes Pdf. These are great for business strategies, office conferences, capital raising or task suggestions. If you desire to acquire more customers for your tech business and ensure they stay satisfied, create your own sales presentation with these plain slides. This slide represents the graph showing forecasts revenues and profits to help ecommerce business to develop strategies for business growth and expansion. It represents forecasted revenue and profits for ABC ecommerce business for five years.
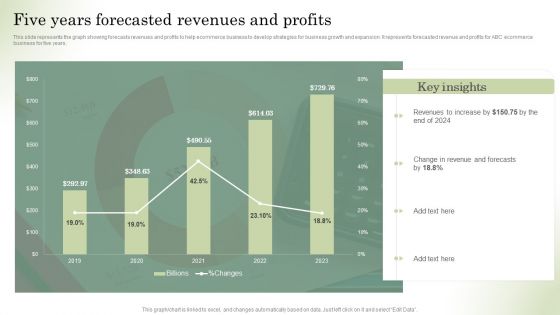
Optimizing Online Stores Five Years Forecasted Revenues And Profits Ideas PDF
This slide represents the graph showing forecasts revenues and profits to help ecommerce business to develop strategies for business growth and expansion. It represents forecasted revenue and profits for ABC ecommerce business for five years. Make sure to capture your audiences attention in your business displays with our gratis customizable Optimizing Online Stores Five Years Forecasted Revenues And Profits Ideas PDF. These are great for business strategies, office conferences, capital raising or task suggestions. If you desire to acquire more customers for your tech business and ensure they stay satisfied, create your own sales presentation with these plain slides.
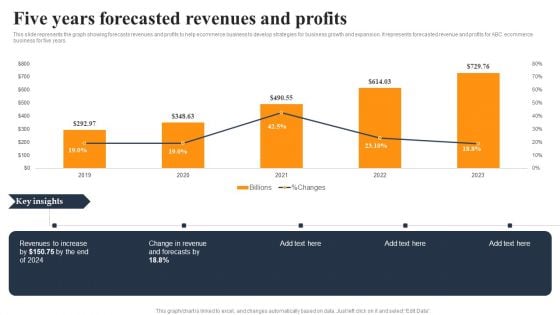
Implementing An Effective Ecommerce Management Framework Five Years Forecasted Revenues And Profits Ideas PDF
This slide represents the graph showing forecasts revenues and profits to help ecommerce business to develop strategies for business growth and expansion. It represents forecasted revenue and profits for ABC ecommerce business for five years. Make sure to capture your audiences attention in your business displays with our gratis customizable Implementing An Effective Ecommerce Management Framework Five Years Forecasted Revenues And Profits Ideas PDF. These are great for business strategies, office conferences, capital raising or task suggestions. If you desire to acquire more customers for your tech business and ensure they stay satisfied, create your own sales presentation with these plain slides.
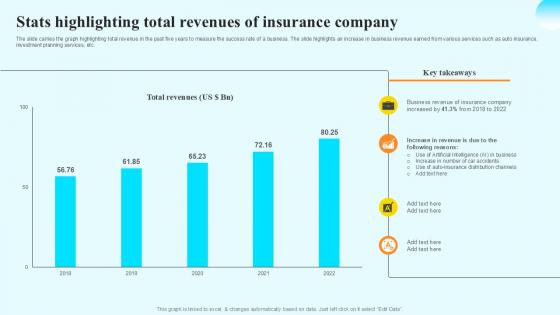
Stats Highlighting Total Revenues Steps By Step Guide For Claiming Car PPT Slide
The slide carries the graph highlighting total revenue in the past five years to measure the success rate of a business. The slide highlights an increase in business revenue earned from various services such as auto insurance, investment planning services, etc. Welcome to our selection of the Stats Highlighting Total Revenues Steps By Step Guide For Claiming Car PPT Slide. These are designed to help you showcase your creativity and bring your sphere to life. Planning and Innovation are essential for any business that is just starting out. This collection contains the designs that you need for your everyday presentations. All of our PowerPoints are 100Percent editable, so you can customize them to suit your needs. This multi-purpose template can be used in various situations. Grab these presentation templates today. The slide carries the graph highlighting total revenue in the past five years to measure the success rate of a business. The slide highlights an increase in business revenue earned from various services such as auto insurance, investment planning services, etc.
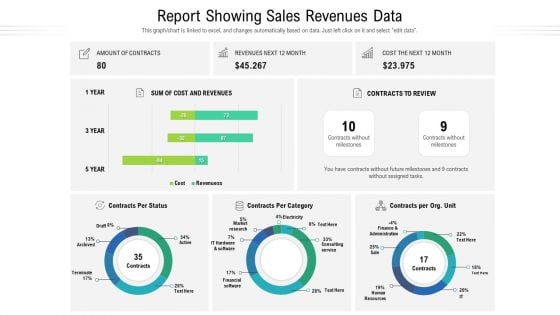
Report Showing Sales Revenues Data Ppt Show Backgrounds PDF
This graph or chart is linked to excel, and changes automatically based on data. Just left click on it and select edit data. Showcasing this set of slides titled report showing sales revenues data ppt show backgrounds pdf. The topics addressed in these templates are cost and revenues, market research, finance and administration. All the content presented in this PPT design is completely editable. Download it and make adjustments in color, background, font etc. as per your unique business setting.
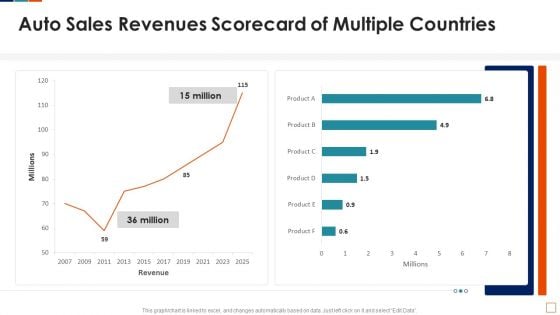
Auto Sales Revenues Scorecard Of Multiple Countries Inspiration PDF
This graph or chart is linked to excel, and changes automatically based on data. Just left click on it and select Edit Data. Deliver an awe inspiring pitch with this creative Auto Sales Revenues Scorecard Of Multiple Countries Inspiration PDF bundle. Topics like Auto Sales Revenues, Scorecard Multiple Countries can be discussed with this completely editable template. It is available for immediate download depending on the needs and requirements of the user.
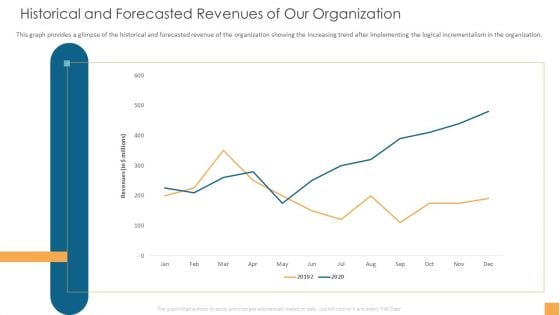
Analytical Incrementalism Historical And Forecasted Revenues Of Our Organization Formats PDF
This graph provides a glimpse of the historical and forecasted revenue of the organization showing the increasing trend after implementing the logical incrementalism in the organization. Deliver an awe-inspiring pitch with this creative analytical incrementalism historical and forecasted revenues of our organization formats pdf bundle. Topics like historical and forecasted revenues of our organization can be discussed with this completely editable template. It is available for immediate download depending on the needs and requirements of the user.
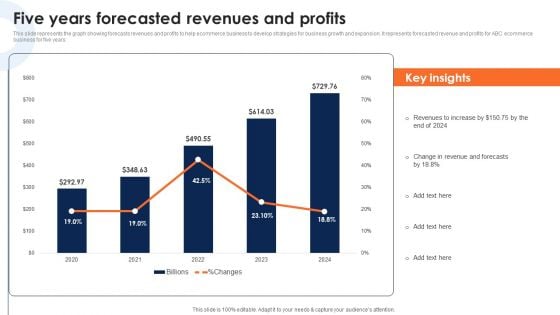
Five Years Forecasted Revenues And Profits Deploying Ecommerce Order Management Software Diagrams PDF
This slide represents the graph showing forecasts revenues and profits to help ecommerce business to develop strategies for business growth and expansion. It represents forecasted revenue and profits for ABC ecommerce business for five years.Crafting an eye-catching presentation has never been more straightforward. Let your presentation shine with this tasteful yet straightforward Five Years Forecasted Revenues And Profits Deploying Ecommerce Order Management Software Diagrams PDF template. It offers a minimalistic and classy look that is great for making a statement. The colors have been employed intelligently to add a bit of playfulness while still remaining professional. Construct the ideal Five Years Forecasted Revenues And Profits Deploying Ecommerce Order Management Software Diagrams PDF that effortlessly grabs the attention of your audience. Begin now and be certain to wow your customers.
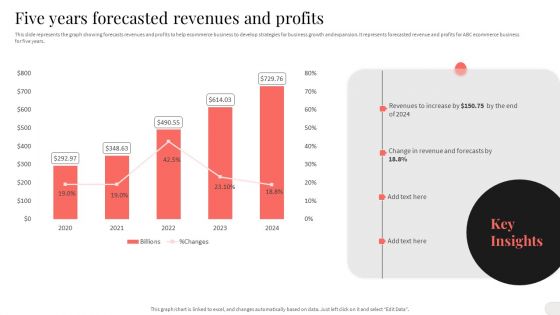
Analyzing And Implementing Effective CMS Five Years Forecasted Revenues And Profits Mockup PDF
This slide represents the graph showing forecasts revenues and profits to help ecommerce business to develop strategies for business growth and expansion. It represents forecasted revenue and profits for ABC ecommerce business for five years. Take your projects to the next level with our ultimate collection of Analyzing And Implementing Effective CMS Five Years Forecasted Revenues And Profits Mockup PDF. Slidegeeks has designed a range of layouts that are perfect for representing task or activity duration, keeping track of all your deadlines at a glance. Tailor these designs to your exact needs and give them a truly corporate look with your own brand colors they will make your projects stand out from the rest.

Analyzing And Deploying Effective CMS Five Years Forecasted Revenues And Profits Demonstration PDF
This slide represents the graph showing forecasts revenues and profits to help ecommerce business to develop strategies for business growth and expansion. It represents forecasted revenue and profits for ABC ecommerce business for five years. Take your projects to the next level with our ultimate collection of Analyzing And Deploying Effective CMS Five Years Forecasted Revenues And Profits Demonstration PDF. Slidegeeks has designed a range of layouts that are perfect for representing task or activity duration, keeping track of all your deadlines at a glance. Tailor these designs to your exact needs and give them a truly corporate look with your own brand colors they will make your projects stand out from the rest.
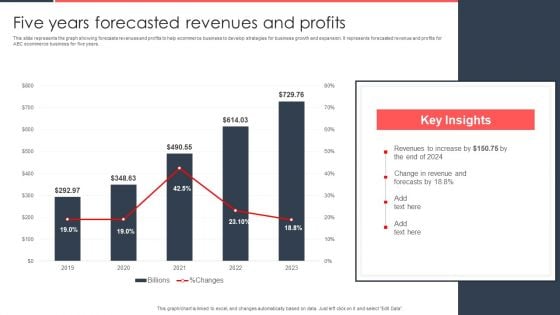
Implementing Management System To Enhance Ecommerce Processes Five Years Forecasted Revenues And Profits Brochure PDF
This slide represents the graph showing forecasts revenues and profits to help ecommerce business to develop strategies for business growth and expansion. It represents forecasted revenue and profits for ABC ecommerce business for five years. Take your projects to the next level with our ultimate collection of Implementing Management System To Enhance Ecommerce Processes Five Years Forecasted Revenues And Profits Brochure PDF. Slidegeeks has designed a range of layouts that are perfect for representing task or activity duration, keeping track of all your deadlines at a glance. Tailor these designs to your exact needs and give them a truly corporate look with your own brand colors they will make your projects stand out from the rest.
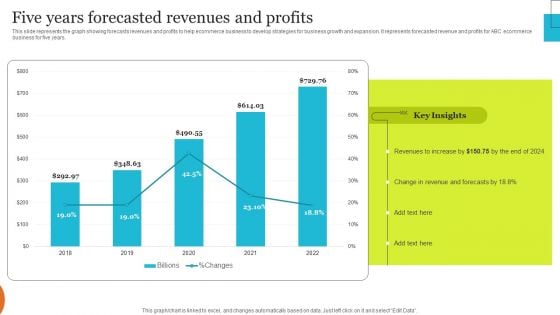
Implementing Effective Ecommerce Managemnet Platform Five Years Forecasted Revenues And Profits Brochure PDF
This slide represents the graph showing forecasts revenues and profits to help ecommerce business to develop strategies for business growth and expansion. It represents forecasted revenue and profits for ABC ecommerce business for five years. Slidegeeks is one of the best resources for PowerPoint templates. You can download easily and regulate Implementing Effective Ecommerce Managemnet Platform Five Years Forecasted Revenues And Profits Brochure PDF for your personal presentations from our wonderful collection. A few clicks is all it takes to discover and get the most relevant and appropriate templates. Use our Templates to add a unique zing and appeal to your presentation and meetings. All the slides are easy to edit and you can use them even for advertisement purposes.


 Continue with Email

 Home
Home


