Revenue Graph
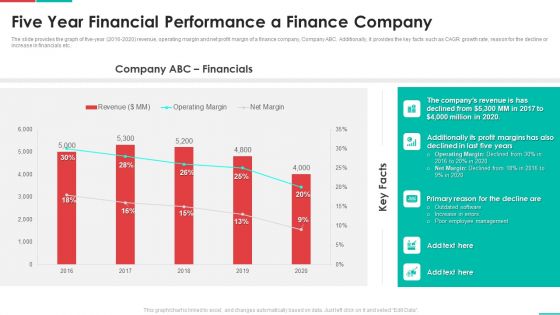
Roadmap For Financial Accounting Transformation Five Year Financial Performance A Finance Company Download PDF
The slide provides the graph of five-year 2016-2020 revenue, operating margin and net profit margin of a finance company, Company ABC. Additionally, it provides the key facts such as CAGR growth rate, reason for the decline or increase in financials etc. Deliver and pitch your topic in the best possible manner with this roadmap for financial accounting transformation five year financial performance a finance company download pdf. Use them to share invaluable insights on revenue, profit margins, management and impress your audience. This template can be altered and modified as per your expectations. So, grab it now.
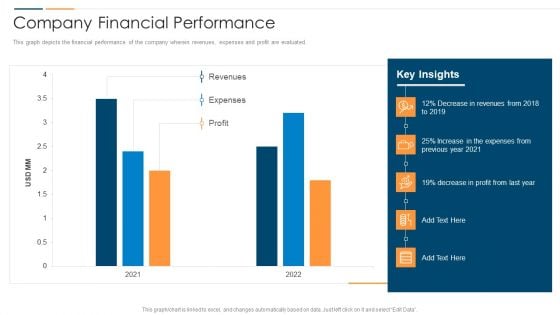
Revolution In Online Business Company Financial Performance Ppt PowerPoint Presentation File Slides PDF
This graph depicts the financial performance of the company wherein revenues, expenses and profit are evaluated. Deliver an awe inspiring pitch with this creative Revolution In Online Business Company Financial Performance Ppt PowerPoint Presentation File Slides PDF bundle. Topics like Increase Expenses Previous, Revenues Expenses Profit, 2021 To 2022 can be discussed with this completely editable template. It is available for immediate download depending on the needs and requirements of the user.
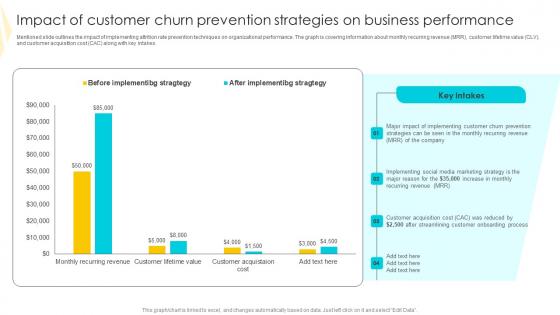
Impact Of Customer Churn Strategies To Mitigate Customer Churn Slides Pdf
Mentioned slide outlines the impact of implementing attrition rate prevention techniques on organizational performance. The graph is covering information about monthly recurring revenue MRR, customer lifetime value CLV, and customer acquisition cost CAC along with key intakes. Are you in need of a template that can accommodate all of your creative concepts This one is crafted professionally and can be altered to fit any style. Use it with Google Slides or PowerPoint. Include striking photographs, symbols, depictions, and other visuals. Fill, move around, or remove text boxes as desired. Test out color palettes and font mixtures. Edit and save your work, or work with colleagues. Download Impact Of Customer Churn Strategies To Mitigate Customer Churn Slides Pdf and observe how to make your presentation outstanding. Give an impeccable presentation to your group and make your presentation unforgettable. Mentioned slide outlines the impact of implementing attrition rate prevention techniques on organizational performance. The graph is covering information about monthly recurring revenue MRR, customer lifetime value CLV, and customer acquisition cost CAC along with key intakes.
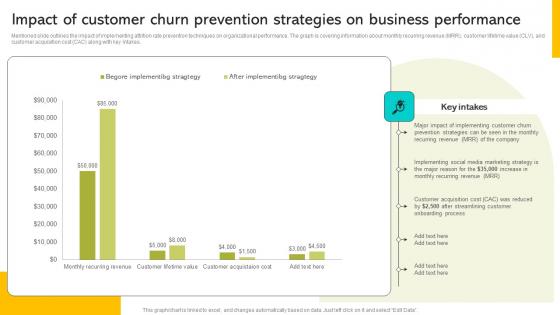
Implementing Strategies To Enhance Impact Of Customer Churn Prevention Strategies On Pictures PDF
Mentioned slide outlines the impact of implementing attrition rate prevention techniques on organizational performance. The graph is covering information about monthly recurring revenue MRR, customer lifetime value CLV, and customer acquisition cost CAC along with key intakes. Formulating a presentation can take up a lot of effort and time, so the content and message should always be the primary focus. The visuals of the PowerPoint can enhance the presenters message, so our Implementing Strategies To Enhance Impact Of Customer Churn Prevention Strategies On Pictures PDF was created to help save time. Instead of worrying about the design, the presenter can concentrate on the message while our designers work on creating the ideal templates for whatever situation is needed. Slidegeeks has experts for everything from amazing designs to valuable content, we have put everything into Implementing Strategies To Enhance Impact Of Customer Churn Prevention Strategies On Pictures PDF Mentioned slide outlines the impact of implementing attrition rate prevention techniques on organizational performance. The graph is covering information about monthly recurring revenue MRR, customer lifetime value CLV, and customer acquisition cost CAC along with key intakes.
Financial Performance Property Listings Platform Pitch Deck PPT Sample
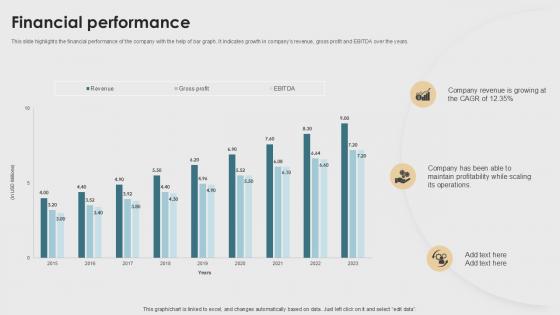
This slide highlights the financial performance of the company with the help of bar graph. It indicates growth in companys revenue, gross profit and EBITDA over the years. Present like a pro with Financial Performance Property Listings Platform Pitch Deck PPT Sample. Create beautiful presentations together with your team, using our easy to use presentation slides. Share your ideas in real time and make changes on the fly by downloading our templates. So whether you are in the office, on the go, or in a remote location, you can stay in sync with your team and present your ideas with confidence. With Slidegeeks presentation got a whole lot easier. Grab these presentations today. This slide highlights the financial performance of the company with the help of bar graph.It indicates growth in companys revenue, gross profit and EBITDA over the years.
Business Synergies P And L Trend Analysis Ppt Gallery Themes PDF
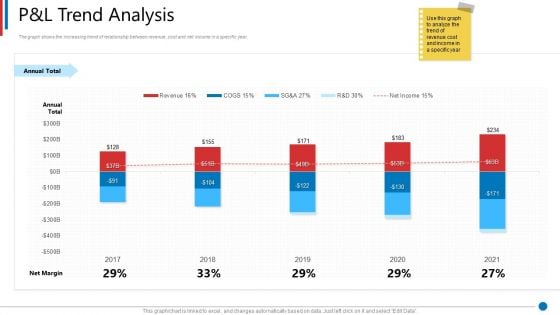
The graph shows the increasing trend of relationship between revenue, cost and net income in a specific year. Deliver an awe-inspiring pitch with this creative business synergies p and l trend analysis ppt gallery themes pdf bundle. Topics like p and l trend analysis can be discussed with this completely editable template. It is available for immediate download depending on the needs and requirements of the user.
Real Time Incident Management Solution Investor Funding Pitch Deck Financial Performance Information PDF
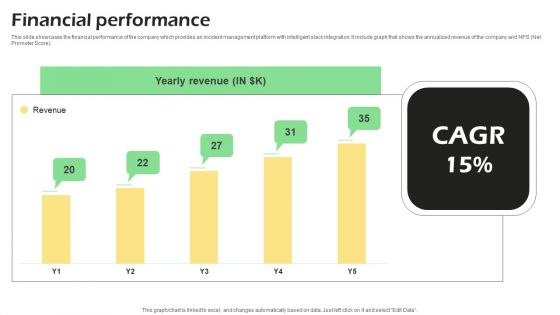
This slide showcases the financial performance of the company which provides an incident management platform with intelligent slack integration. It include graph that shows the annualized revenue of the company and NPS Net Promoter Score. Crafting an eye catching presentation has never been more straightforward. Let your presentation shine with this tasteful yet straightforward Real Time Incident Management Solution Investor Funding Pitch Deck Financial Performance Information PDF template. It offers a minimalistic and classy look that is great for making a statement. The colors have been employed intelligently to add a bit of playfulness while still remaining professional. Construct the ideal Real Time Incident Management Solution Investor Funding Pitch Deck Financial Performance Information PDF that effortlessly grabs the attention of your audience. Begin now and be certain to wow your customers.
Business Financial Highlights For Planning And Forecasting Background PDF
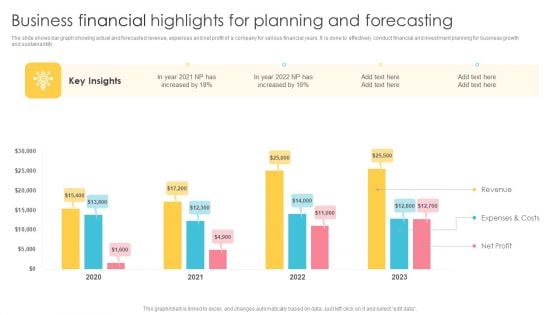
The slide shows bar graph showing actual and forecasted revenue, expenses and net profit of a company for various financial years. It is done to effectively conduct financial and investment planning for business growth and sustainability. Pitch your topic with ease and precision using this Business Financial Highlights For Planning And Forecasting Background PDF. This layout presents information on Revenue, Expenses And Costs, Net Profit. It is also available for immediate download and adjustment. So, changes can be made in the color, design, graphics or any other component to create a unique layout.
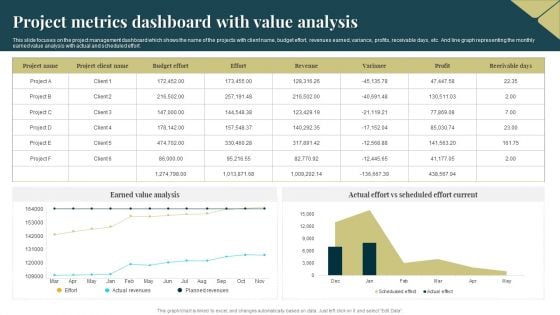
Project Metrics Dashboard With Value Analysis Introduction PDF
This slide focuses on the project management dashboard which shows the name of the projects with client name, budget effort, revenues earned, variance, profits, receivable days, etc. And line graph representing the monthly earned value analysis with actual and scheduled effort. Showcasing this set of slides titled Project Metrics Dashboard With Value Analysis Introduction PDF. The topics addressed in these templates are Budget Effort, Revenues, Earned Value Analysis. All the content presented in this PPT design is completely editable. Download it and make adjustments in color, background, font etc. as per your unique business setting.
Business Graph01 Success PowerPoint Templates And PowerPoint Backgrounds 0711
Microsoft PowerPoint Template and Background with vector graph showing rise in profits or earnings in With our Business Graph01 Success PowerPoint Templates And PowerPoint Backgrounds 0711 you will feel up to it. Derive the confidence to go for it.
Business Graph02 Success PowerPoint Templates And PowerPoint Backgrounds 1011
Microsoft PowerPoint Template and Background with business graph with arrow showing profits and gains Go to any extent with our Business Graph02 Success PowerPoint Templates And PowerPoint Backgrounds 1011. Whatever the distance they will cover it with you.
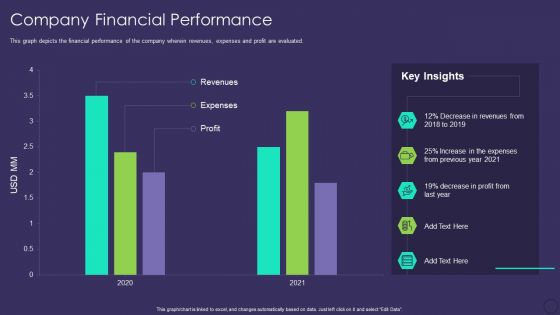
Comprehensive Business Digitization Deck Company Financial Performance Formats PDF
This graph depicts the financial performance of the company wherein revenues, expenses and profit are evaluated. Deliver and pitch your topic in the best possible manner with this comprehensive business digitization deck company financial performance formats pdf. Use them to share invaluable insights on revenues, expenses, profit and impress your audience. This template can be altered and modified as per your expectations. So, grab it now.
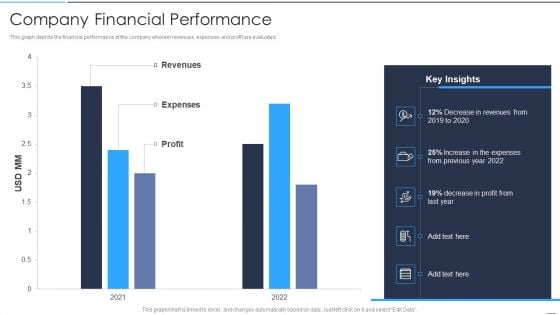
Accelerate Online Journey Now Company Financial Performance Topics PDF
This graph depicts the financial performance of the company wherein revenues, expenses and profit are evaluated.Deliver and pitch your topic in the best possible manner with this Accelerate Online Journey Now Company Financial Performance Topics PDF Use them to share invaluable insights on Decrease Revenues, Increase Expenses, Decrease Profit and impress your audience. This template can be altered and modified as per your expectations. So, grab it now.
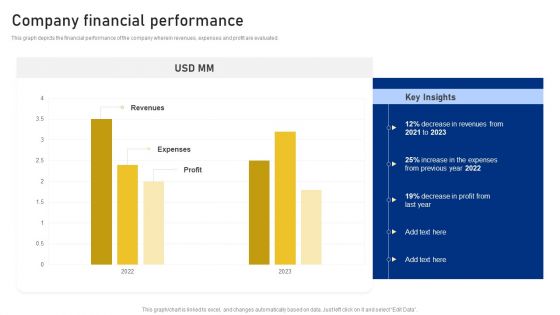
Reshaping Business In Digital Company Financial Performance Sample PDF
This graph depicts the financial performance of the company wherein revenues, expenses and profit are evaluated. Deliver and pitch your topic in the best possible manner with this Reshaping Business In Digital Company Financial Performance Sample PDF. Use them to share invaluable insights on Decrease Revenues, 2021 To 2023, Profit and impress your audience. This template can be altered and modified as per your expectations. So, grab it now.
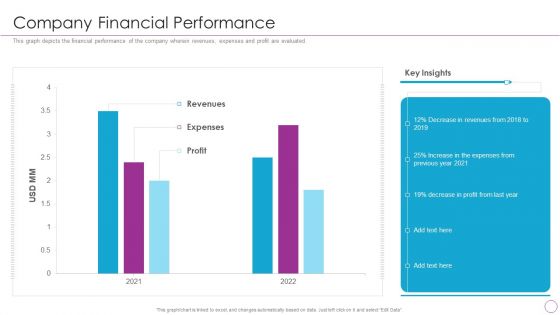
Integration Of Digital Technology In Organization Company Financial Performance Graphics PDF
This graph depicts the financial performance of the company wherein revenues, expenses and profit are evaluated.Deliver and pitch your topic in the best possible manner with this Integration Of Digital Technology In Organization Company Financial Performance Graphics PDF Use them to share invaluable insights on Decrease In Revenues, Increase Expenses, Decrease In Profit and impress your audience. This template can be altered and modified as per your expectations. So, grab it now.
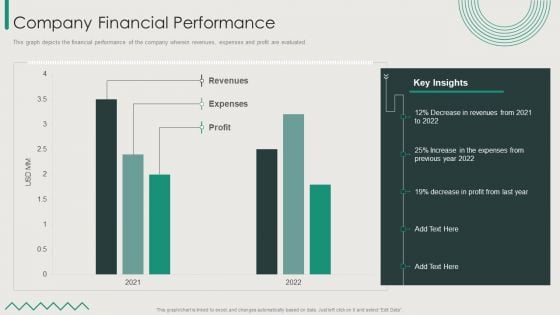
Organization Transition Company Financial Performance Ppt PowerPoint Presentation File Inspiration PDF
This graph depicts the financial performance of the company wherein revenues, expenses and profit are evaluated. Deliver and pitch your topic in the best possible manner with this Organization Transition Company Financial Performance Ppt PowerPoint Presentation File Inspiration PDF. Use them to share invaluable insights on Revenues, Expenses, 2021 To 2022, Profit and impress your audience. This template can be altered and modified as per your expectations. So, grab it now.

Graph01 Business PowerPoint Templates And PowerPoint Backgrounds 0511
Microsoft PowerPoint Template and Background with man with hand on graph Clear bottlenecks with our Graph01 Business PowerPoint Templates And PowerPoint Backgrounds 0511. Get past any obstacle in your way.

Business Graph02 Success PowerPoint Templates And PowerPoint Backgrounds 0711
Microsoft PowerPoint Template and Background with steps to the success business graph Our Business Graph02 Success PowerPoint Templates And PowerPoint Backgrounds 0711 are every bit as good as we claim. You might find them even better.
Pie Graph02 Business PowerPoint Templates And PowerPoint Backgrounds 0711
Microsoft PowerPoint Template and Background with business pie graph Do not doubt the effect of your plans. Positive outcomes are a fait accompli with our Pie Graph02 Business PowerPoint Templates And PowerPoint Backgrounds 0711.
Business Graph01 Finance PowerPoint Templates And PowerPoint Backgrounds 1011
Microsoft PowerPoint Template and Background with growing gold graph with a red arrow pointing upward Deliver growth on a platter with our Business Graph01 Finance PowerPoint Templates And PowerPoint Backgrounds 1011. You will come out on top.
Business Graph01 Success PowerPoint Themes And PowerPoint Slides 0711
Microsoft PowerPoint Theme and Slide with vector graph showing rise in profits or earnings in Our Business Graph01 Success PowerPoint Themes And PowerPoint Slides 0711 can be very enticing. Their blend of colors will captivate anyone.

Graph01 Business PowerPoint Themes And PowerPoint Slides 0511
Microsoft PowerPoint Theme and Slide with man with hand on graph Deliver growth on a platter with our Graph01 Business PowerPoint Themes And PowerPoint Slides 0511. You will come out on top.
Business Graph02 Success PowerPoint Themes And PowerPoint Slides 0711
Microsoft PowerPoint Theme and Slide with steps to the success business graph Advocate your case with our Business Graph02 Success PowerPoint Themes And PowerPoint Slides 0711. They will deliver a strong defense.
Graph03 Business PowerPoint Templates And PowerPoint Backgrounds 0511
Microsoft PowerPoint Template and Background with man with hand on graph gradient Edit plans with our Graph03 Business PowerPoint Templates And PowerPoint Backgrounds 0511. Download without worries with our money back guaranteee.
Graph05 Business PowerPoint Templates And PowerPoint Backgrounds 0511
Microsoft PowerPoint Template and Background with business graph with green arrow showing profits Carry your thoughts on our Graph05 Business PowerPoint Templates And PowerPoint Backgrounds 0511. They will take them that much further.
Business Graph01 Abstract PowerPoint Themes And PowerPoint Slides 0211
Microsoft PowerPoint Theme and Slides with business graph of multicolored arrows Navigate difficult territory with our Business Graph01 Abstract PowerPoint Themes And PowerPoint Slides 0211. Download without worries with our money back guaranteee.
Business Graph03 Success PowerPoint Themes And PowerPoint Slides 0511
Microsoft PowerPoint Theme and Slide with bussiness graph Verbalize your views with our Business Graph03 Success PowerPoint Themes And PowerPoint Slides 0511. Download without worries with our money back guaranteee.
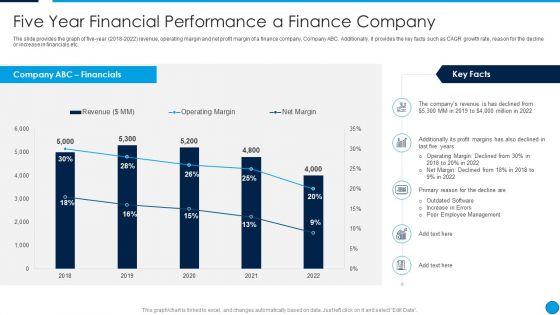
Summary Financial Five Year Financial Performance A Finance Company Themes PDF
The slide provides the graph of five-year 2018 to 2022 revenue, operating margin and net profit margin of a finance company, Company ABC. Additionally, it provides the key facts such as CAGR growth rate, reason for the decline or increase in financials etc. Deliver and pitch your topic in the best possible manner with this Summary Financial Five Year Financial Performance A Finance Company Themes PDF. Use them to share invaluable insights on Revenue, Operating Margin, Net Margin, 2018 To 2022 and impress your audience. This template can be altered and modified as per your expectations. So, grab it now.
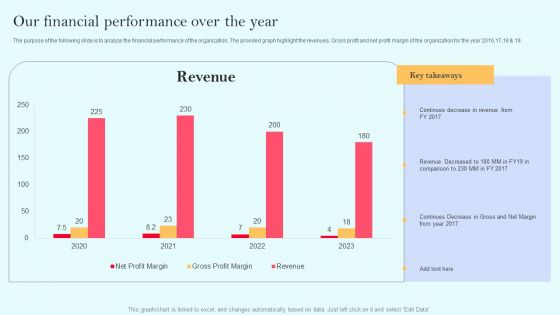
Recurring Income Generation Model Our Financial Performance Over The Year Clipart PDF
The purpose of the following slide is to analyze the financial performance of the organization. The provided graph highlight the revenues, Gross profit and net profit margin of the organization for the year 2016,17,18 and 19. Welcome to our selection of the Recurring Income Generation Model Our Financial Performance Over The Year Clipart PDF. These are designed to help you showcase your creativity and bring your sphere to life. Planning and Innovation are essential for any business that is just starting out. This collection contains the designs that you need for your everyday presentations. All of our PowerPoints are 100 percent editable, so you can customize them to suit your needs. This multi purpose template can be used in various situations. Grab these presentation templates today.
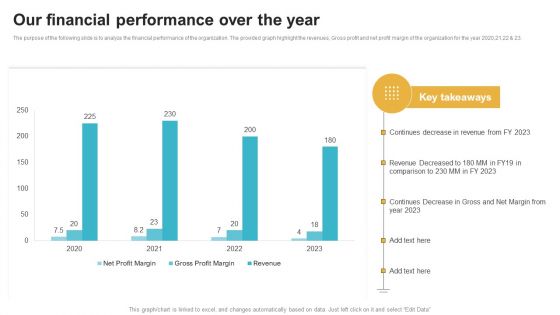
Saas Continuous Income Generation Model For Software Startup Our Financial Performance Over The Year Download PDF
The purpose of the following slide is to analyze the financial performance of the organization. The provided graph highlight the revenues, Gross profit and net profit margin of the organization for the year 2020,21,22 and 23. Welcome to our selection of the Saas Continuous Income Generation Model For Software Startup Our Financial Performance Over The Year Download PDF. These are designed to help you showcase your creativity and bring your sphere to life. Planning and Innovation are essential for any business that is just starting out. This collection contains the designs that you need for your everyday presentations. All of our PowerPoints are 100 percent editable, so you can customize them to suit your needs. This multi purpose template can be used in various situations. Grab these presentation templates today.
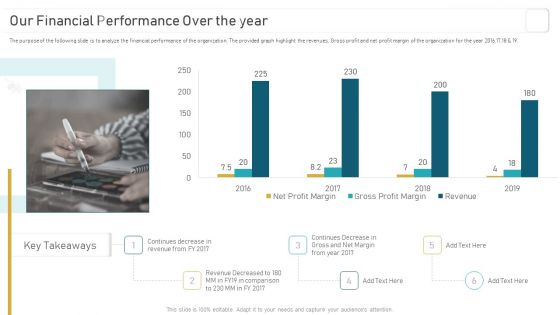
Deploying And Managing Recurring Our Financial Performance Over The Year Infographics PDF
The purpose of the following slide is to analyze the financial performance of the organization. The provided graph highlight the revenues, Gross profit and net profit margin of the organization for the year 2016,17,18 and 19. If you are looking for a format to display your unique thoughts, then the professionally designed Deploying And Managing Recurring Our Financial Performance Over The Year Infographics PDF is the one for you. You can use it as a Google Slides template or a PowerPoint template. Incorporate impressive visuals, symbols, images, and other charts. Modify or reorganize the text boxes as you desire. Experiment with shade schemes and font pairings. Alter, share or cooperate with other people on your work. Download Deploying And Managing Recurring Our Financial Performance Over The Year Infographics PDF and find out how to give a successful presentation. Present a perfect display to your team and make your presentation unforgettable.
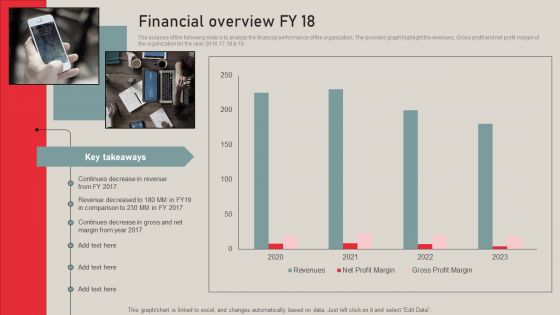
Individualized Pricing Approach For Managed Services Financial Overview FY 18 Structure PDF
The purpose of the following slide is to analyze the financial performance of the organization. The provided graph highlight the revenues, Gross profit and net profit margin of the organization for the year 2016,17,18 and 19. Create an editable Individualized Pricing Approach For Managed Services Financial Overview FY 18 Structure PDF that communicates your idea and engages your audience. Whether you are presenting a business or an educational presentation, pre designed presentation templates help save time. Individualized Pricing Approach For Managed Services Financial Overview FY 18 Structure PDF is highly customizable and very easy to edit, covering many different styles from creative to business presentations. Slidegeeks has creative team members who have crafted amazing templates. So, go and get them without any delay.
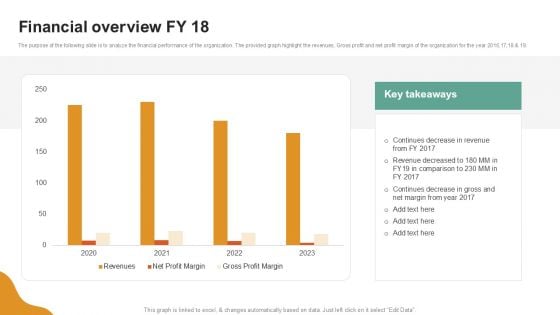
A LA Carte Business Strategy Financial Overview FY 18 Topics PDF
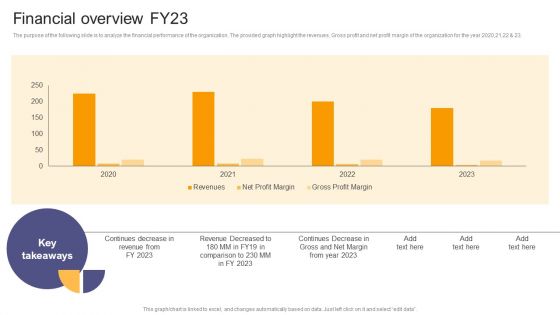
Per Device Pricing Strategy For Managed Solutions Financial Overview FY23 Ideas PDF
The purpose of the following slide is to analyze the financial performance of the organization. The provided graph highlight the revenues, Gross profit and net profit margin of the organization for the year 2020,21,22 and 23. Find highly impressive Per Device Pricing Strategy For Managed Solutions Financial Overview FY23 Ideas PDF on Slidegeeks to deliver a meaningful presentation. You can save an ample amount of time using these presentation templates. No need to worry to prepare everything from scratch because Slidegeeks experts have already done a huge research and work for you. You need to download Per Device Pricing Strategy For Managed Solutions Financial Overview FY23 Ideas PDF for your upcoming presentation. All the presentation templates are 100 percent editable and you can change the color and personalize the content accordingly. Download now.
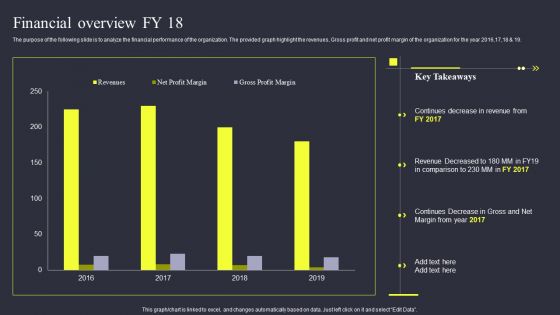
Strategies To Enhance Managed Service Business Financial Overview Fy 18 Information PDF
The purpose of the following slide is to analyze the financial performance of the organization. The provided graph highlight the revenues, Gross profit and net profit margin of the organization for the year 2016,17,18 and 19. Coming up with a presentation necessitates that the majority of the effort goes into the content and the message you intend to convey. The visuals of a PowerPoint presentation can only be effective if it supplements and supports the story that is being told. Keeping this in mind our experts created Strategies To Enhance Managed Service Business Financial Overview Fy 18 Information PDF to reduce the time that goes into designing the presentation. This way, you can concentrate on the message while our designers take care of providing you with the right template for the situation.
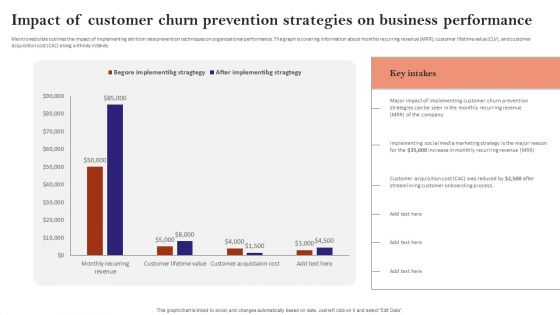
Impact Of Customer Churn Prevention Strategies On Business Performance Demonstration PDF
Mentioned slide outlines the impact of implementing attrition rate prevention techniques on organizational performance. The graph is covering information about monthly recurring revenue MRR, customer lifetime value CLV, and customer acquisition cost CAC along with key intakes. Are you in need of a template that can accommodate all of your creative concepts This one is crafted professionally and can be altered to fit any style. Use it with Google Slides or PowerPoint. Include striking photographs, symbols, depictions, and other visuals. Fill, move around, or remove text boxes as desired. Test out color palettes and font mixtures. Edit and save your work, or work with colleagues. Download Impact Of Customer Churn Prevention Strategies On Business Performance Demonstration PDF and observe how to make your presentation outstanding. Give an impeccable presentation to your group and make your presentation unforgettable.
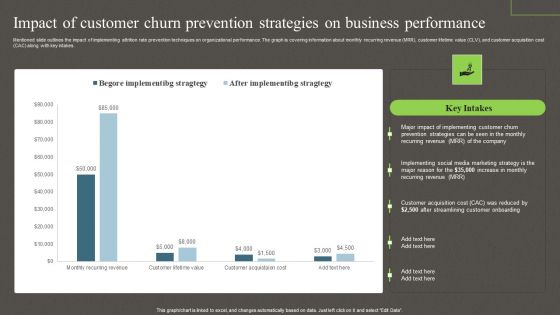
Impact Of Customer Churn Prevention Strategies On Business Performance Ppt PowerPoint Presentation Diagram Images PDF
Mentioned slide outlines the impact of implementing attrition rate prevention techniques on organizational performance. The graph is covering information about monthly recurring revenue MRR, customer lifetime value CLV, and customer acquisition cost CAC along with key intakes. The Impact Of Customer Churn Prevention Strategies On Business Performance Ppt PowerPoint Presentation Diagram Images PDF is a compilation of the most recent design trends as a series of slides. It is suitable for any subject or industry presentation, containing attractive visuals and photo spots for businesses to clearly express their messages. This template contains a variety of slides for the user to input data, such as structures to contrast two elements, bullet points, and slides for written information. Slidegeeks is prepared to create an impression.

Graph02 Business PowerPoint Templates And PowerPoint Backgrounds 0511
Microsoft PowerPoint Template and Background with line graph, showing up trend in business Draw them to your thoughts with our Graph02 Business PowerPoint Templates And PowerPoint Backgrounds 0511. They will cease to sit on the fence.
Graph02 Business PowerPoint Themes And PowerPoint Slides 0511
Microsoft PowerPoint Theme and Slide with line graph, showing up trend in business Show enterprise in your plans. Put them forth on our Graph02 Business PowerPoint Themes And PowerPoint Slides 0511.
Profit Graph01 Business PowerPoint Templates And PowerPoint Themes 0512
Microsoft Powerpoint Templates and Background with bar chart growth-Profit Graph01 Business PowerPoint Templates And PowerPoint Themes 0512-These PowerPoint designs and slide layouts can be used for themes relating to -Bar chart growth, shapes, business, finance, success, marketing Address eco-clubs with our Profit Graph01 Business PowerPoint Templates And PowerPoint Themes 0512. Advocate curbing of carbon emissions.

Graph04 Business PowerPoint Templates And PowerPoint Backgrounds 0511
Microsoft PowerPoint Template and Background with businessman climbing a chart Acquire success with our Graph04 Business PowerPoint Templates And PowerPoint Backgrounds 0511. Download without worries with our money back guaranteee.
Graph01 Finance PowerPoint Themes And PowerPoint Slides 0511
Microsoft PowerPoint Slide and Theme with financial computing deskto computer with bar chart Interpret plans with our Graph01 Finance PowerPoint Themes And PowerPoint Slides 0511. Download without worries with our money back guaranteee.
Graph02 Business PowerPoint Templates And PowerPoint Backgrounds 0611
Microsoft PowerPoint Template and Background with a bar chart showing falling profits Create dreams with our Graph02 Business PowerPoint Templates And PowerPoint Backgrounds 0611. Give your audience a dose of fascination.

Business Graph01 Success PowerPoint Themes And PowerPoint Slides 0211
Microsoft PowerPoint Theme and Slides with world map with glossy earth globe in business theme Support your thoughts with our Business Graph01 Success PowerPoint Themes And PowerPoint Slides 0211. Download without worries with our money back guaranteee.
Graph01 Finance PowerPoint Templates And PowerPoint Backgrounds 0511
Microsoft PowerPoint Template and Background with financial computing deskto computer with bar chart Delve on the cold facts in detail. Explain the factual analysis on our Graph01 Finance PowerPoint Templates And PowerPoint Backgrounds 0511.
Bar Graph01 Business PowerPoint Templates And PowerPoint Themes 0512
Microsoft Powerpoint Templates and Background with bar graph-Bar Graph01 Business PowerPoint Templates And PowerPoint Themes 0512-These PowerPoint designs and slide layouts can be used for themes relating to -Bar graph,success, marketing, sales, business, finance Charge your account with our Bar Graph01 Business PowerPoint Templates And PowerPoint Themes 0512. Earn the interest of your audience.
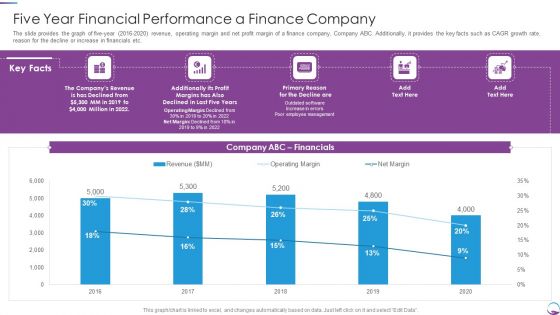
Five Year Financial Performance A Finance Company Slides PDF
The slide provides the graph of five year 2016 to 2020 revenue, operating margin and net profit margin of a finance company, Company ABC. Additionally, it provides the key facts such as CAGR growth rate, reason for the decline or increase in financials etc. Deliver and pitch your topic in the best possible manner with this Five Year Financial Performance A Finance Company Slides PDF. Use them to share invaluable insights on Five Year Financial Performance A Finance Company and impress your audience. This template can be altered and modified as per your expectations. So, grab it now.
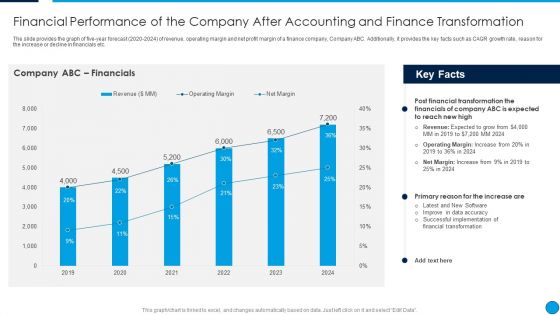
Summary Financial Performance Of The Company After Accounting And Finance Ideas PDF
The slide provides the graph of five-year forecast 2020 to 2024 of revenue, operating margin and net profit margin of a finance company, Company ABC. Additionally, it provides the key facts such as CAGR growth rate, reason for the increase or decline in financials etc. Deliver and pitch your topic in the best possible manner with this Summary Financial Performance Of The Company After Accounting And Finance Ideas PDF. Use them to share invaluable insights on Financials, Revenue, Operating Margin, Net Margin, 2019 To 2024 and impress your audience. This template can be altered and modified as per your expectations. So, grab it now.
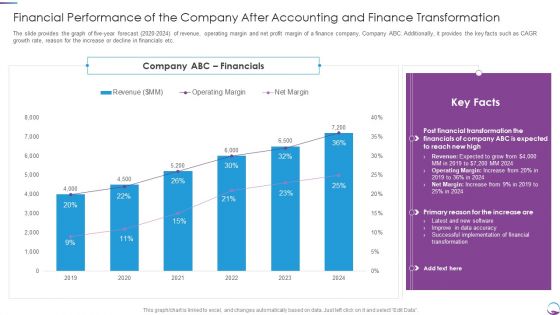
Financial Performance Of The Company After Accounting And Finance Transformation Mockup PDF
The slide provides the graph of five year forecast 2020 to 2024 of revenue, operating margin and net profit margin of a finance company, Company ABC. Additionally, it provides the key facts such as CAGR growth rate, reason for the increase or decline in financials etc. Deliver and pitch your topic in the best possible manner with this Financial Performance Of The Company After Accounting And Finance Transformation Mockup PDF. Use them to share invaluable insights on Financial, Revenue, Margin, Implementation and impress your audience. This template can be altered and modified as per your expectations. So, grab it now.
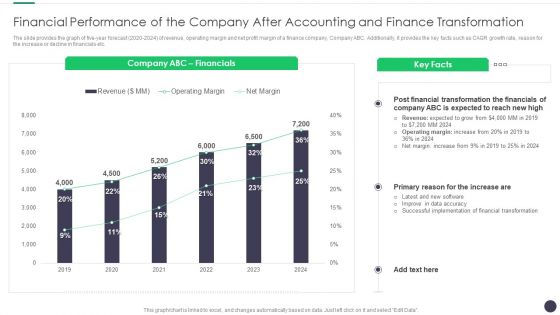
Finance And Accounting Online Conversion Plan Financial Performance Of The Company Brochure PDF
The slide provides the graph of five year forecast 2020 to 2024 of revenue, operating margin and net profit margin of a finance company, Company ABC. Additionally, it provides the key facts such as CAGR growth rate, reason for the increase or decline in financials etc. Deliver and pitch your topic in the best possible manner with this Finance And Accounting Online Conversion Plan Financial Performance Of The Company Brochure PDF. Use them to share invaluable insights on Company, Financials, Financial Transformation and impress your audience. This template can be altered and modified as per your expectations. So, grab it now.
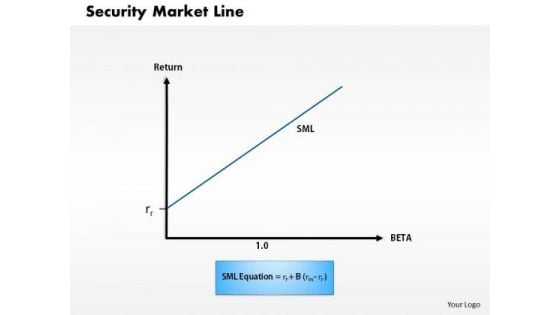
Business Framework Security Market Line 1 PowerPoint Presentation
This diagram displays graph of security market line. You can use line graph to plot changes in data over time, such as monthly revenue and earnings changes or daily changes in stock market prices.
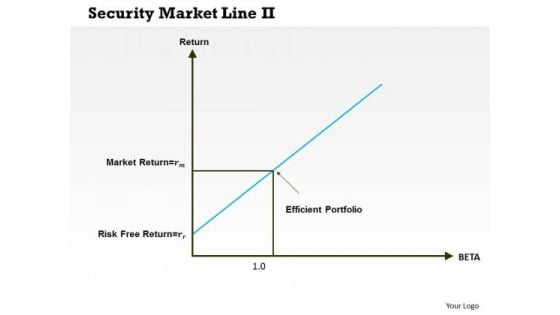
Business Framework Security Market Line 11 PowerPoint Presentation
This diagram displays graph of security market line. You can use line graph to plot changes in data over time, such as monthly revenue and earnings changes or daily changes in stock market prices.
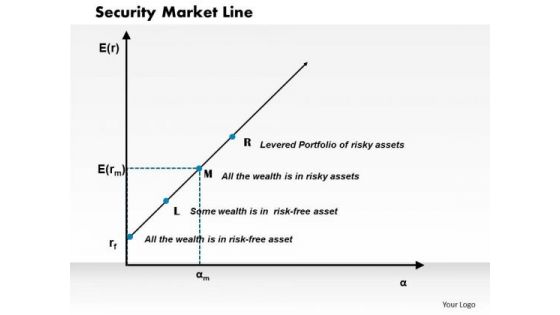
Business Framework Security Market Line PowerPoint Presentation
This diagram displays graph of security market line. You can use line graph to plot changes in data over time, such as monthly revenue and earnings changes or daily changes in stock market prices.
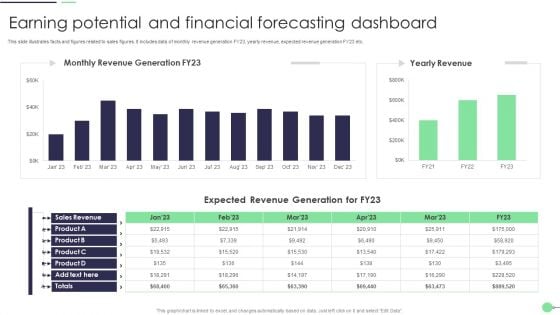
Earning Potential And Financial Forecasting Dashboard Summary PDF
This slide illustrates facts and figures related to sales figures. It includes data of monthly revenue generation FY23, yearly revenue, expected revenue generation FY23 etc. Pitch your topic with ease and precision using this Earning Potential And Financial Forecasting Dashboard Summary PDF. This layout presents information on Sales Revenue, Expected Revenue, Product. It is also available for immediate download and adjustment. So, changes can be made in the color, design, graphics or any other component to create a unique layout.
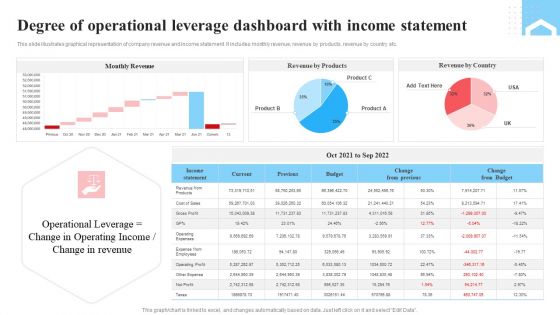
Degree Of Operational Leverage Dashboard With Income Statement Ppt Infographics Layout PDF
This slide illustrates graphical representation of company revenue and income statement. It includes monthly revenue, revenue by products, revenue by country etc. Pitch your topic with ease and precision using this Degree Of Operational Leverage Dashboard With Income Statement Ppt Infographics Layout PDF. This layout presents information on Monthly Revenue, Income Statement, Product. It is also available for immediate download and adjustment. So, changes can be made in the color, design, graphics or any other component to create a unique layout.
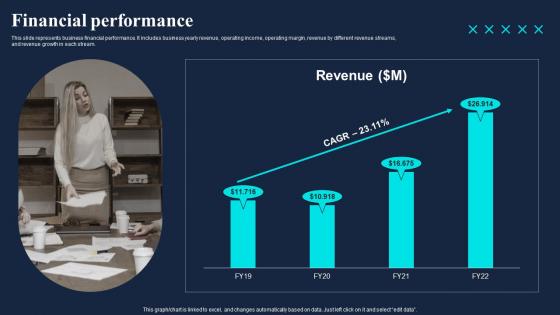
Financial Performance Gaming Company Fund Raising Pitch Deck Topics Pdf
This slide represents business financial performance. It includes business yearly revenue, operating income, operating margin, revenue by different revenue streams, and revenue growth in each stream. Present like a pro with Financial Performance Gaming Company Fund Raising Pitch Deck Topics Pdf Create beautiful presentations together with your team, using our easy to use presentation slides. Share your ideas in real time and make changes on the fly by downloading our templates. So whether you are in the office, on the go, or in a remote location, you can stay in sync with your team and present your ideas with confidence. With Slidegeeks presentation got a whole lot easier. Grab these presentations today. This slide represents business financial performance. It includes business yearly revenue, operating income, operating margin, revenue by different revenue streams, and revenue growth in each stream.
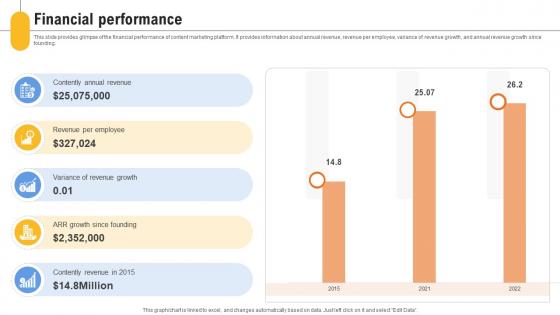
Financial Performance Content Management Platform Investor Funding Elevator Pitch Deck
This slide provides glimpse of the financial performance of content marketing platform. It provides information about annual revenue, revenue per employee, variance of revenue growth, and annual revenue growth since founding. Present like a pro with Financial Performance Content Management Platform Investor Funding Elevator Pitch Deck. Create beautiful presentations together with your team, using our easy-to-use presentation slides. Share your ideas in real-time and make changes on the fly by downloading our templates. So whether you are in the office, on the go, or in a remote location, you can stay in sync with your team and present your ideas with confidence. With Slidegeeks presentation got a whole lot easier. Grab these presentations today. This slide provides glimpse of the financial performance of content marketing platform. It provides information about annual revenue, revenue per employee, variance of revenue growth, and annual revenue growth since founding.
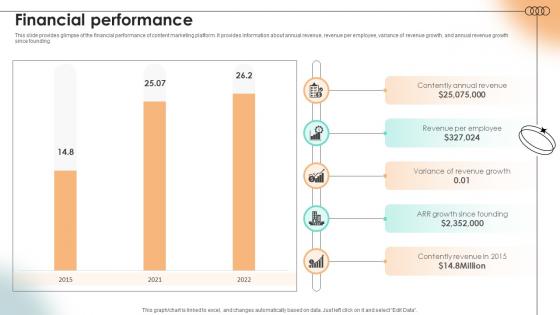
Financial Performance Content Marketing Platform Investor Funding Elevator Pitch Deck
This slide provides glimpse of the financial performance of content marketing platform. It provides information about annual revenue, revenue per employee, variance of revenue growth, and annual revenue growth since founding. Slidegeeks is here to make your presentations a breeze with Financial Performance Content Marketing Platform Investor Funding Elevator Pitch Deck With our easy-to-use and customizable templates, you can focus on delivering your ideas rather than worrying about formatting. With a variety of designs to choose from, you are sure to find one that suits your needs. And with animations and unique photos, illustrations, and fonts, you can make your presentation pop. So whether you are giving a sales pitch or presenting to the board, make sure to check out Slidegeeks first This slide provides glimpse of the financial performance of content marketing platform. It provides information about annual revenue, revenue per employee, variance of revenue growth, and annual revenue growth since founding.
Financial Projection Content Marketing Platform Investor Funding Elevator Pitch Deck
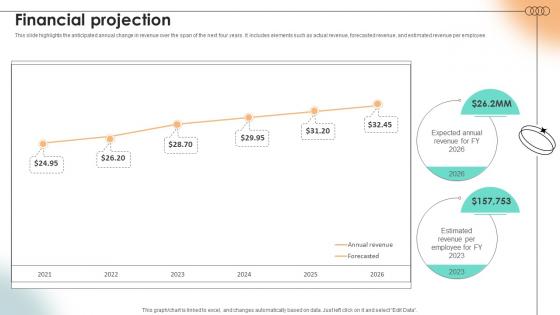
This slide highlights the anticipated annual change in revenue over the span of the next four years. It includes elements such as actual revenue, forecasted revenue, and estimated revenue per employee. Do you have an important presentation coming up Are you looking for something that will make your presentation stand out from the rest Look no further than Financial Projection Content Marketing Platform Investor Funding Elevator Pitch Deck. With our professional designs, you can trust that your presentation will pop and make delivering it a smooth process. And with Slidegeeks, you can trust that your presentation will be unique and memorable. So why wait Grab Financial Projection Content Marketing Platform Investor Funding Elevator Pitch Deck today and make your presentation stand out from the rest This slide highlights the anticipated annual change in revenue over the span of the next four years. It includes elements such as actual revenue, forecasted revenue, and estimated revenue per employee.
Financial Projection Content Management Platform Investor Funding Elevator Pitch Deck
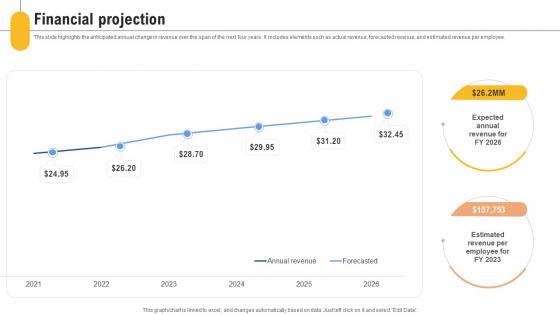
This slide highlights the anticipated annual change in revenue over the span of the next four years. It includes elements such as actual revenue, forecasted revenue, and estimated revenue per employee. Slidegeeks is here to make your presentations a breeze with Financial Projection Content Management Platform Investor Funding Elevator Pitch Deck With our easy-to-use and customizable templates, you can focus on delivering your ideas rather than worrying about formatting. With a variety of designs to choose from, you are sure to find one that suits your needs. And with animations and unique photos, illustrations, and fonts, you can make your presentation pop. So whether you are giving a sales pitch or presenting to the board, make sure to check out Slidegeeks first. This slide highlights the anticipated annual change in revenue over the span of the next four years. It includes elements such as actual revenue, forecasted revenue, and estimated revenue per employee.


 Continue with Email

 Home
Home


