Revenue Growth

Work Streams Current Problems And Financial Considerations Ppt Powerpoint Presentation Ideas Professional
This is a work streams current problems and financial considerations ppt powerpoint presentation ideas professional. This is a four stage process. The stages in this process are gantt chart, work streams, swimlanes.

Financial Analysis Vector Bar Graph With Magnifying Glass Ppt PowerPoint Presentation Gallery Design Ideas
This is a financial analysis vector bar graph with magnifying glass ppt powerpoint presentation gallery design ideas. This is a four stage process. The stages in this process are marketing analytics, marketing performance, marketing discovery.
Financial Charts Data Analysis Vector Icon Ppt PowerPoint Presentation Visual Aids Summary Cpb
This is a financial charts data analysis vector icon ppt powerpoint presentation visual aids summary cpb. This is a three stage process. The stages in this process are data analysis, analytics architecture, analytics framework.
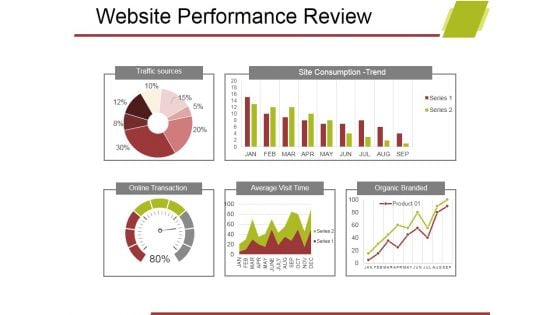
Website Performance Review Template 1 Ppt PowerPoint Presentation Portfolio Master Slide
This is a website performance review template 1 ppt powerpoint presentation portfolio master slide. This is a five stage process. The stages in this process are traffic sources, site consumption trend, online transaction, average visit time, organic branded.
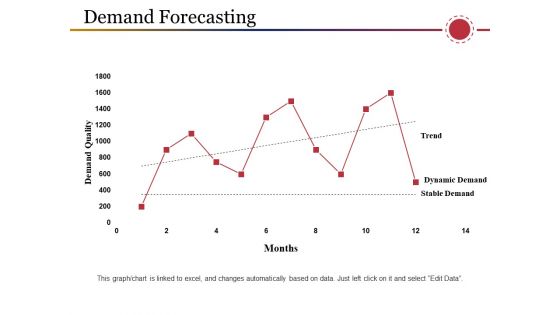
Demand Forecasting Ppt PowerPoint Presentation Outline Model
This is a demand forecasting ppt powerpoint presentation outline model. This is a one stage process. The stages in this process are demand quality, dynamic demand, stable demand, trend, finance.
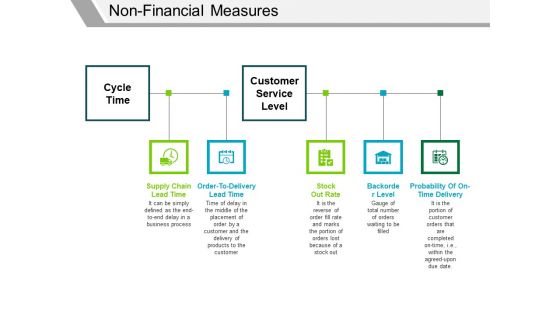
Non Financial Measures Template 1 Ppt PowerPoint Presentation Layouts Example Topics
This is a non financial measures template 1 ppt powerpoint presentation layouts example topics. This is a five stage process. The stages in this process are supply chain lead time, order to delivery lead time, stock out rate, backorder level, probability of on time delivery.
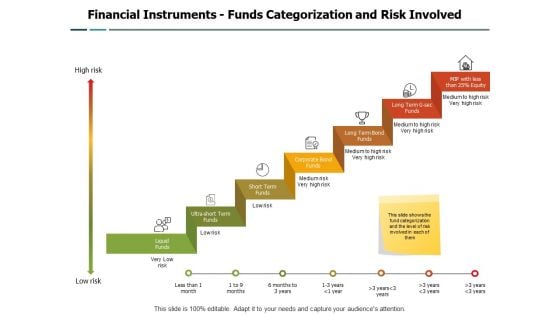
Financial Instruments Funds Categorization And Risk Involved Ppt PowerPoint Presentation Slides Slideshow
Presenting this set of slides with name financial instruments funds categorization and risk involved ppt powerpoint presentation slides slideshow. This is a seven stage process. The stages in this process are seven stages. This is a completely editable PowerPoint presentation and is available for immediate download. Download now and impress your audience.
Annual Cycle With Financial Planning Icon Ppt PowerPoint Presentation Professional Templates
Presenting this set of slides with name annual cycle with financial planning icon ppt powerpoint presentation professional templates. This is a twelve stage process. The stages in this process are year wheel, annual wheel, 12 months wheel. This is a completely editable PowerPoint presentation and is available for immediate download. Download now and impress your audience.
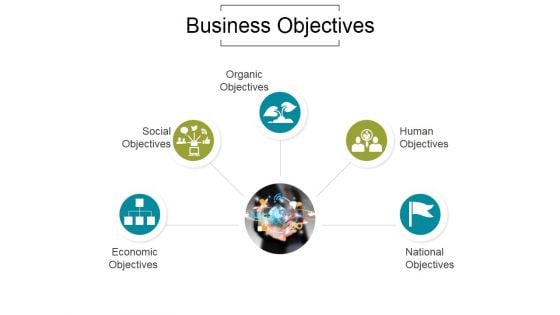
Business Objectives Ppt PowerPoint Presentation Layouts
This is a business objectives ppt powerpoint presentation layouts. This is a five stage process. The stages in this process are economic objectives, social objectives, organic objectives, human objectives, national objectives
Transportation Challenges Ppt PowerPoint Presentation Icon Picture
This is a transportation challenges ppt powerpoint presentation icon picture. This is a seven stage process. The stages in this process are varying fuel prices, globalization, improvised technologies, labor laws, economic uncertainty.
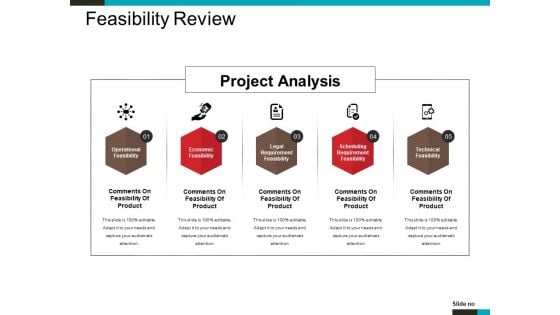
Feasibility Review Ppt PowerPoint Presentation Infographic Template Mockup
This is a feasibility review ppt powerpoint presentation infographic template mockup. This is a five stage process. The stages in this process are operational feasibility, economic feasibility, legal requirement feasibility, scheduling requirement feasibility, technical feasibility.
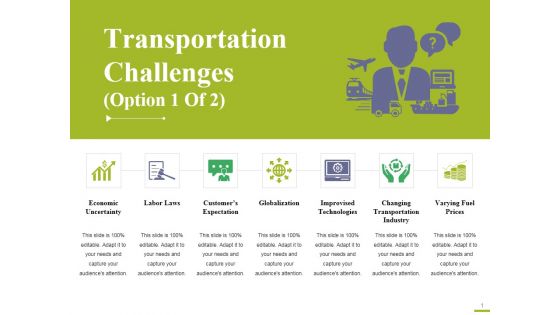
Transportation Challenges Template 1 Ppt PowerPoint Presentation Slides Graphic Tips
This is a transportation challenges template 1 ppt powerpoint presentation slides graphic tips. This is a seven stage process. The stages in this process are economic uncertainty, labor laws, customers expectation, globalization, improvised technologies.
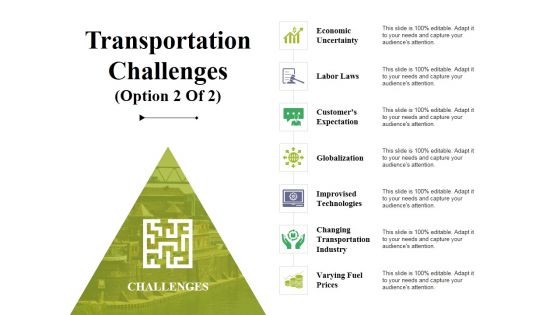
Transportation Challenges Template 2 Ppt PowerPoint Presentation Summary Example Topics
This is a transportation challenges template 2 ppt powerpoint presentation summary example topics. This is a seven stage process. The stages in this process are economic uncertainty, labor laws, customers expectation, globalization, improvised technologies.
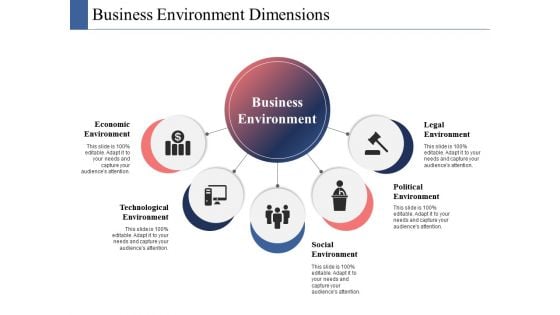
Business Environment Dimensions Ppt PowerPoint Presentation File Graphics
This is a business environment dimensions ppt powerpoint presentation file graphics. This is a five stage process. The stages in this process are economic environment, technological environment, social environment, political environment, legal environment.
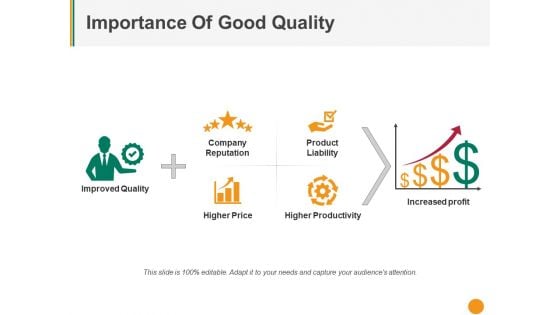
Importance Of Good Quality Ppt PowerPoint Presentation Example 2015
This is a importance of good quality ppt powerpoint presentation example 2015. This is a six stage process. The stages in this process are company reputation, product liability, higher productivity, higher price, improved quality.
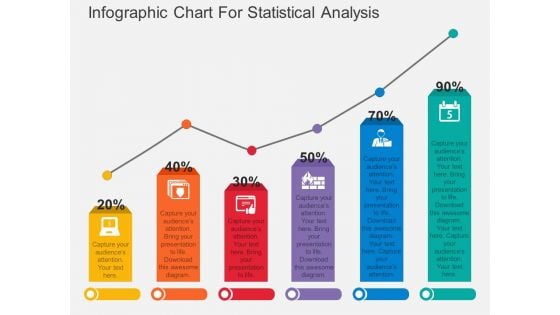
Infographic Chart For Statistical Analysis Powerpoint Template
Download this exclusive business diagram to display statistical analysis. This PowerPoint template contains bar chart with percentage values. This diagram is useful for business presentations.
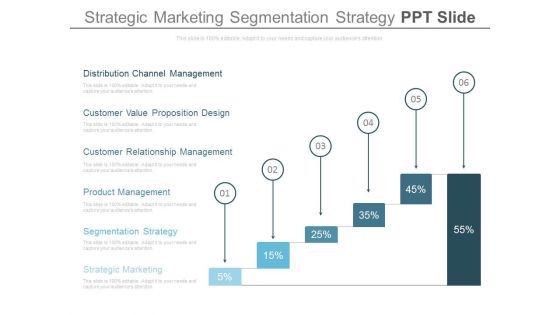
Strategic Marketing Segmentation Strategy Ppt Slide
This is a strategic marketing segmentation strategy ppt slide. This is a six stages process. The stage in this process are marketing, business, success, finance.\n
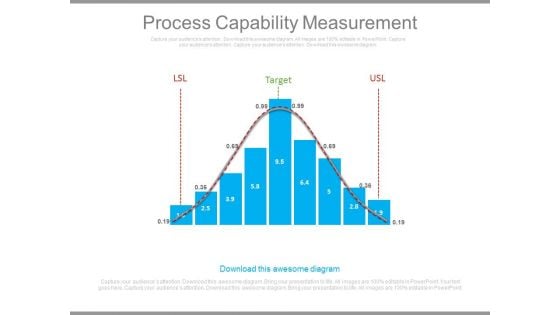
Process Capability Measurement Ppt Slides
This is a process capability measurement ppt slides. This is a nine stage process. The stages in this process are success, business.\n\n
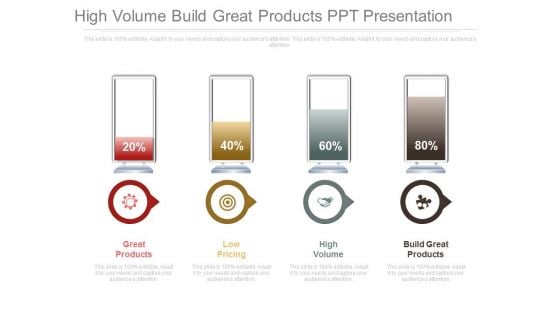
High Volume Build Great Products Ppt Presentation
This is a high volume build great products ppt presentation. This is a four stage process. The stages in this process are finance, business, marketing, success.
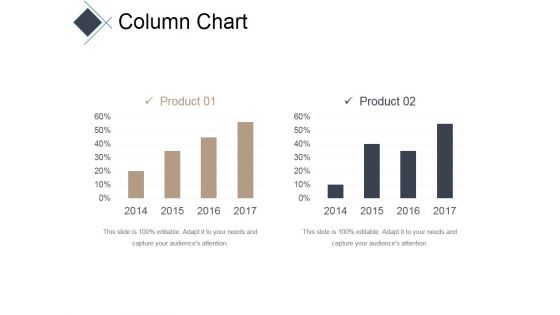
Column Chart Ppt PowerPoint Presentation Infographic Template Inspiration
This is a column chart ppt powerpoint presentation infographic template inspiration. This is a two stage process. The stages in this process are bar, years, business, marketing, success.
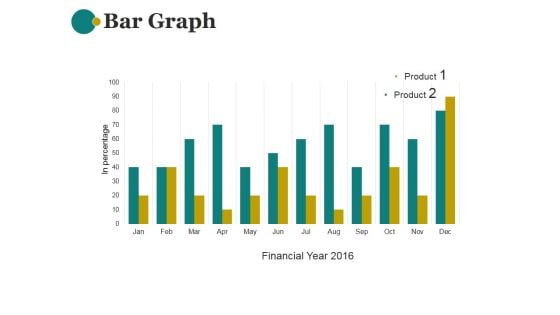
Bar Graph Ppt PowerPoint Presentation File Portfolio
This is a bar graph ppt powerpoint presentation file portfolio. This is a twelve stage process. The stages in this process are financial, marketing, management, business, strategy.
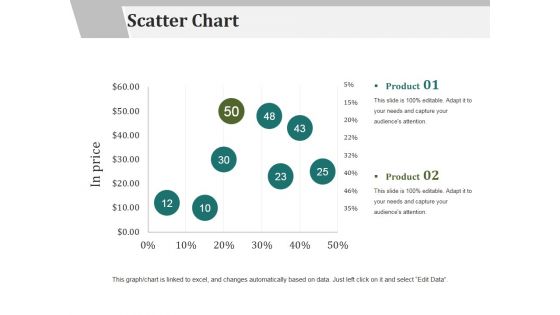
Scatter Chart Ppt PowerPoint Presentation Gallery Layout
This is a scatter chart ppt powerpoint presentation gallery layout. This is a two stage process. The stages in this process are financial, marketing, management, strategy, planning.

Portfolio Return And Performance Template Ppt PowerPoint Presentation Microsoft
This is a portfolio return and performance template ppt powerpoint presentation microsoft. This is a two stage process. The stages in this process are business, strategy, marketing, analysis, success, contributions only.
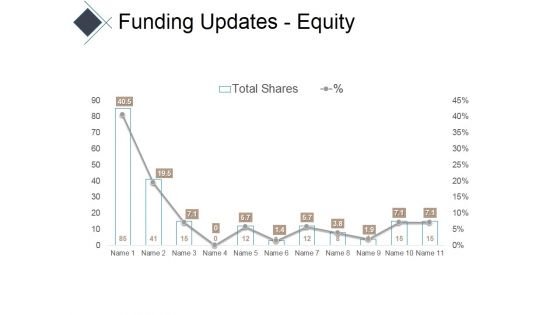
Funding Updates Equity Ppt PowerPoint Presentation Infographic Template Portfolio
This is a funding updates equity ppt powerpoint presentation infographic template portfolio. This is a eleven stage process. The stages in this process are charts, area, marketing, business, success.
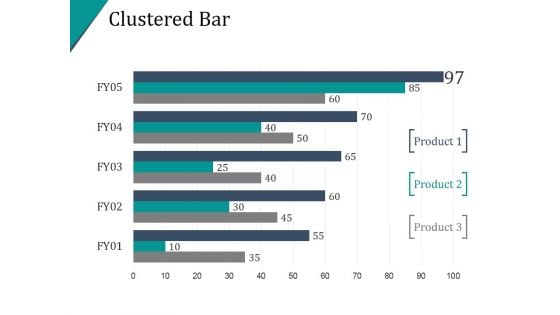
Clustered Bar Ppt PowerPoint Presentation Inspiration
This is a clustered bar ppt powerpoint presentation inspiration. This is a five stage process. The stages in this process are bar graph, business, marketing, finance, percentage.
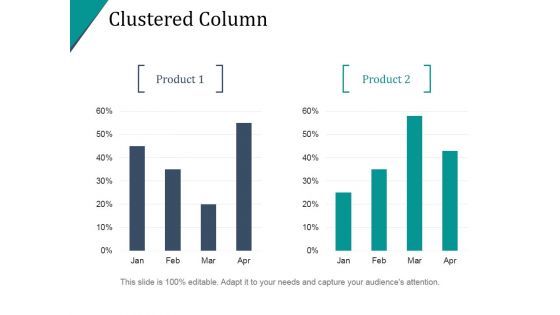
Clustered Column Ppt PowerPoint Presentation Infographic Template
This is a clustered column ppt powerpoint presentation infographic template. This is a two stage process. The stages in this process are finance, percentage, bar graph, business, marketing.
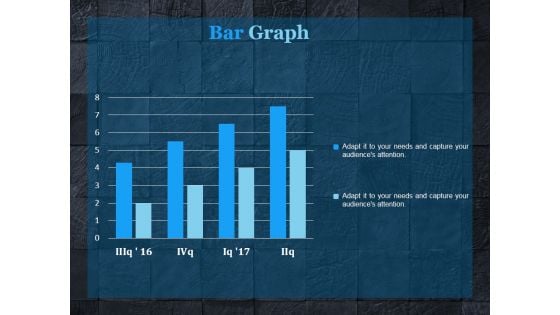
Bar Graph Ppt PowerPoint Presentation Sample
This is a bar graph ppt powerpoint presentation sample. This is a four stage process. The stages in this process are bar graph, finance, marketing, strategy, analysis, business.
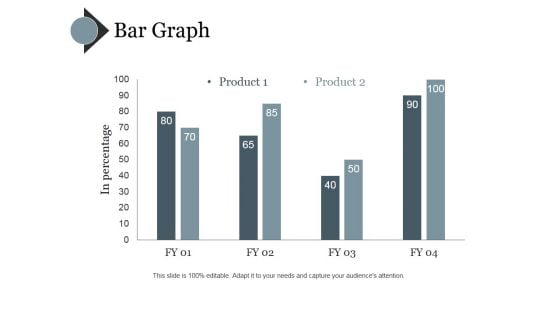
Bar Graph Ppt PowerPoint Presentation Styles Influencers
This is a bar graph ppt powerpoint presentation styles influencers. This is a four stage process. The stages in this process are bar, graph, business, marketing, finance.
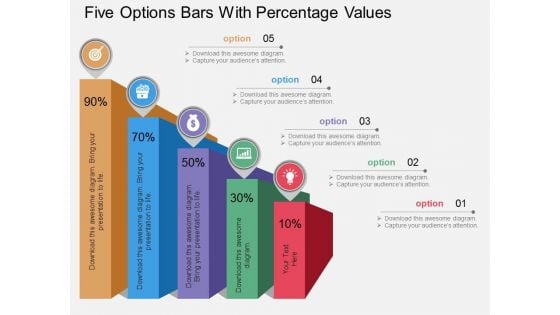
Five Options Bars With Percentage Values Powerpoint Template
Our professionally designed business diagram is as an effective tool for communicating ideas and planning. It contains five options bars with percentage values. Convey your views with this diagram slide. It will amplify the strength of your logic.
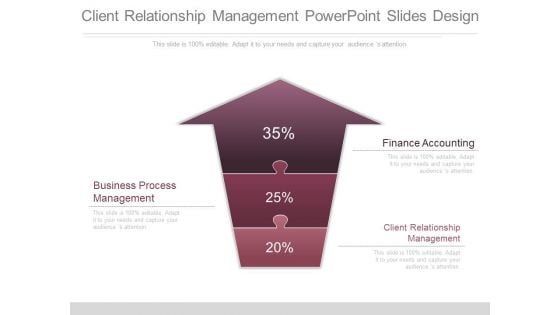
Client Relationship Management Powerpoint Slides Design
This is a client relationship management powerpoint slides design. This is a three stage process. The stages in this process are business process management, finance accounting, client relationship management.
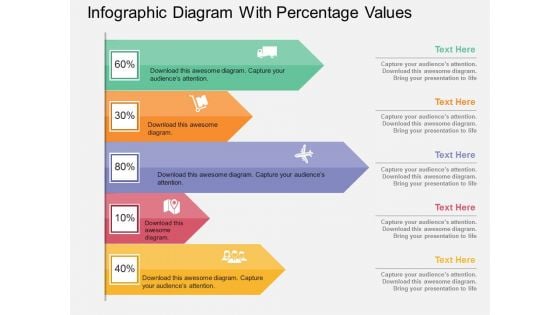
Infographic Diagram With Percentage Values Powerpoint Template
Visually support your presentation with our above template containing infographic diagram with percentage values. This diagram is excellent visual tools for explaining huge amounts of information where complex data needs to be explained immediately and clearly.
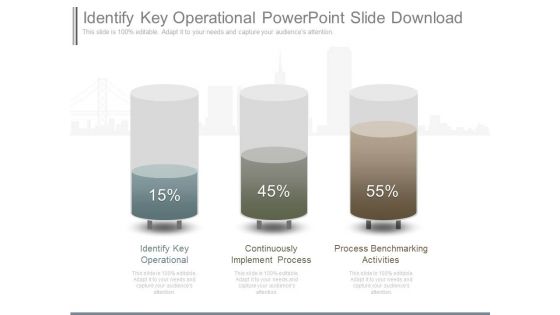
Identify Key Operational Powerpoint Slide Download
This is a identify key operational powerpoint slide download. This is a three stage process. The stages in this process are identify key operational, continuously implement process, process benchmarking activities.\n\n\n\n\n
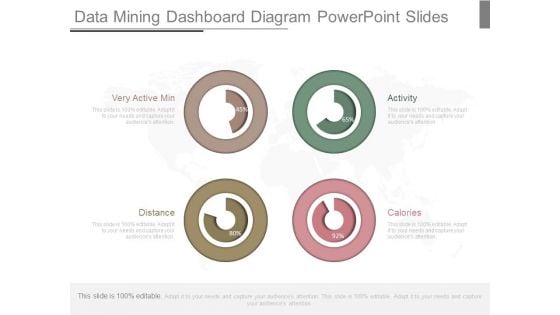
Data Mining Dashboard Diagram Powerpoint Slides
This is a data mining dashboard diagram powerpoint slides. This is a four stage process. The stages in this process are very active min, distance, calories, activity.
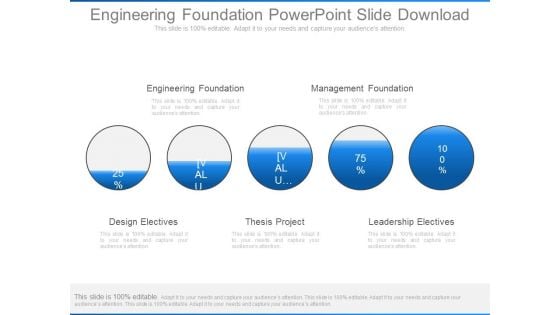
Engineering Foundation Powerpoint Slide Download
This is a engineering foundation powerpoint slide download. This is a five stage process. The stages in this process are engineering foundation, management foundation, design electives, thesis project, leadership electives.
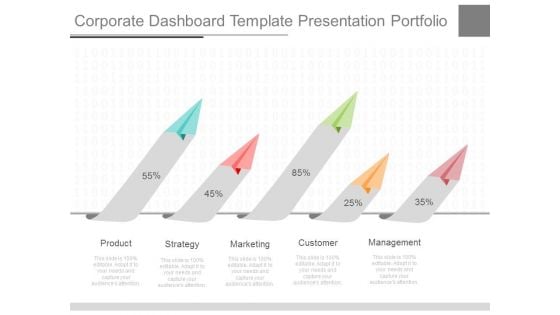
Corporate Dashboard Template Presentation Portfolio
This is a corporate dashboard template presentation portfolio. This is a five stage process. The stages in this process are product, strategy, marketing, customer, management.
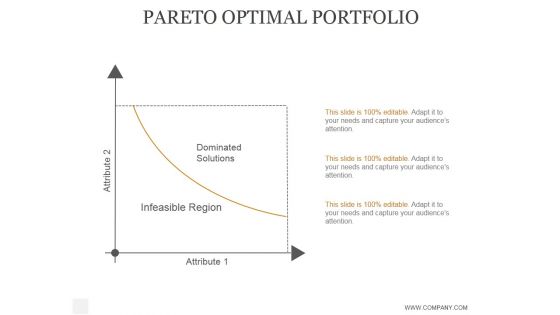
Pareto Optimal Portfolio Ppt PowerPoint Presentation Infographic Template
This is a pareto optimal portfolio ppt powerpoint presentation infographic template. This is a two stage process. The stages in this process are dominated solutions, infeasible region.
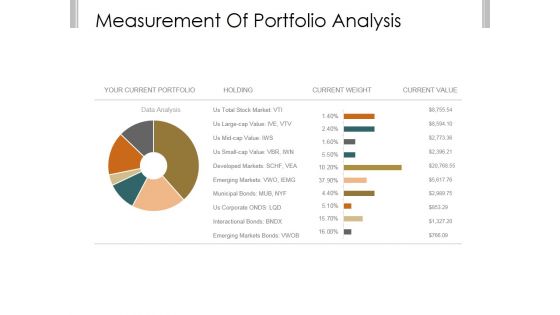
Measurement Of Portfolio Analysis Ppt PowerPoint Presentation Clipart
This is a measurement of portfolio analysis ppt powerpoint presentation clipart. This is a two stage process. The stages in this process are your current portfolio, holding, current weight, current value, data analysis.
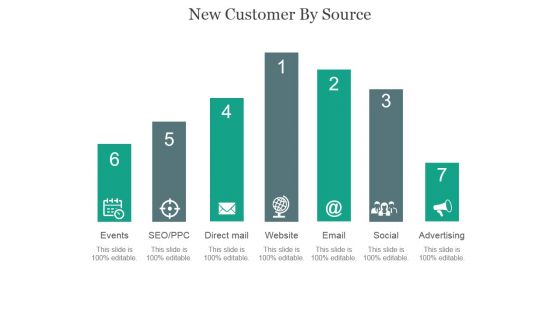
New Customer By Source Ppt PowerPoint Presentation Example 2015
This is a new customer by source ppt powerpoint presentation example 2015. This is a seven stage process. The stages in this process are events, seo ppc, direct mail, website, email, social, advertising.
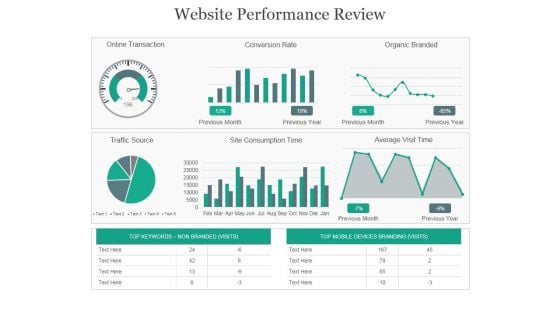
Website Performance Review Ppt PowerPoint Presentation Background Images
This is a website performance review ppt powerpoint presentation background images. This is a three stage process. The stages in this process are online transaction, conversion rate, organic branded, traffic source, site consumption time.
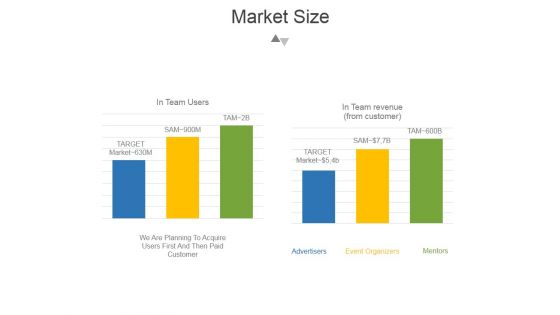
Market Size Template 2 Ppt PowerPoint Presentation Show
This is a market size template 2 ppt powerpoint presentation show. This is a three stage process. The stages in this process are advertisers, event organizers, mentors.
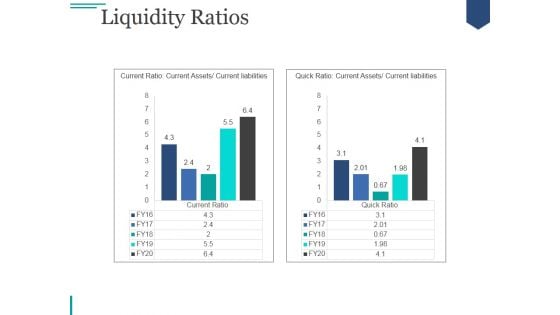
Liquidity Ratios Ppt PowerPoint Presentation Introduction
This is a liquidity ratios ppt powerpoint presentation introduction. This is a two stage process. The stages in this process are current ratio, current assets, current liabilities.

Cash Flow Statement Kpis Tabular Form Ppt PowerPoint Presentation Infographics File Formats
This is a cash flow statement kpis tabular form ppt powerpoint presentation infographics file formats. This is a four stage process. The stages in this process are operations, investing activities, financing activities, net increase in cash.
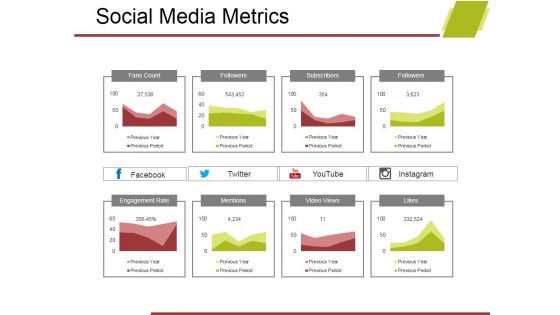
Social Media Metrics Ppt PowerPoint Presentation Styles Topics
This is a social media metrics ppt powerpoint presentation styles topics. This is a eight stage process. The stages in this process are fans count, followers, subscribers, engagement rate, mentions, video views, likes.
Liquidity Ratios Ppt PowerPoint Presentation Icon Graphic Images
This is a liquidity ratios ppt powerpoint presentation icon graphic images. This is a two stage process. The stages in this process are current ratio, quick ratio, current liabilities, current assetsc.
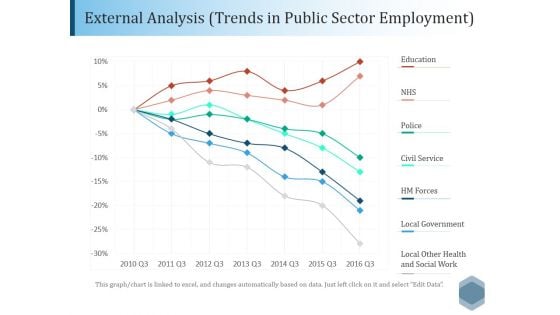
External Analysis Trends In Public Sector Employment Ppt PowerPoint Presentation File Outline
This is a external analysis trends in public sector employment ppt powerpoint presentation file outline. This is a seven stage process. The stages in this process are education, nhs, police, civil service, local government.
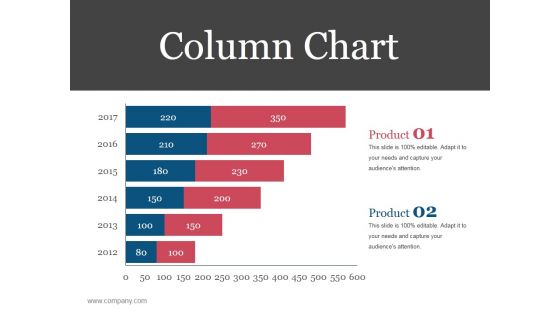
Column Chart Ppt PowerPoint Presentation Ideas Designs Download
This is a column chart ppt powerpoint presentation ideas designs download. This is a six stage process. The stages in this process are business, strategy, analysis, planning, column chart, financial.
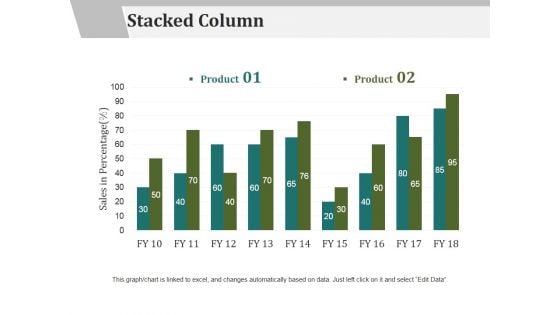
Stacked Column Ppt PowerPoint Presentation Infographic Template Example File
This is a stacked column ppt powerpoint presentation infographic template example file. This is a two stage process. The stages in this process are financial, marketing, management, strategy, planning.
Bar Graph Icon For Data Analysis Ppt PowerPoint Presentation Pictures Ideas
This is a bar graph icon for data analysis ppt powerpoint presentation pictures ideas. This is a four stage process. The stages in this process are financial analysis, quantitative, statistical modelling.
Rocket Diagram With Finance Icons Powerpoint Templates
The above template contains graphics of rocket with icons. This diagram may be used to display concept of finance and technology. Earn appreciation with our slide. Your listeners will surely laud your performance.
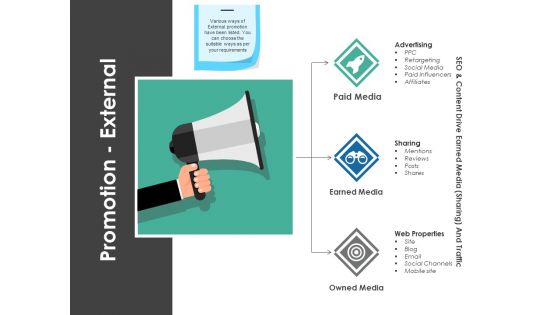
Promotion External Ppt PowerPoint Presentation Styles Background Images
This is a promotion external ppt powerpoint presentation styles background images. This is a three stage process. The stages in this process are paid media, advertising, sharing, web properties, earned media.
Promotion External Ppt PowerPoint Presentation Icon Guidelines
This is a promotion external ppt powerpoint presentation icon guidelines. This is a three stage process. The stages in this process are paid media, earned media, owned media, business, icons.
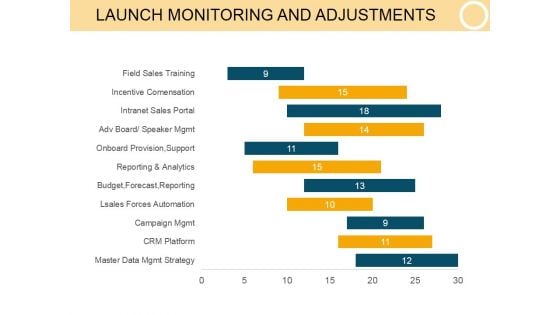
Launch Monitoring And Adjustments Template 1 Ppt PowerPoint Presentation Layout
This is a launch monitoring and adjustments template 1 ppt powerpoint presentation layout. This is a eleven stage process. The stages in this process are business, finance, marketing, strategy, analysis, success.
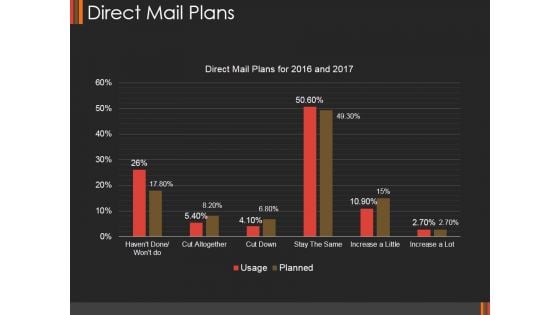
Direct Mail Plans Ppt PowerPoint Presentation Portfolio Show
This is a direct mail plans ppt powerpoint presentation portfolio show. This is a six stage process. The stages in this process are business, finance, marketing, strategy, planning, success.
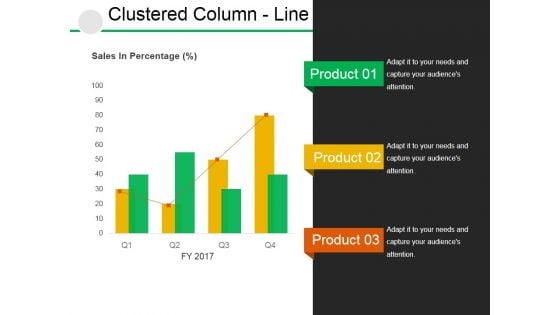
Clustered Column Line Ppt PowerPoint Presentation Slides Ideas
This is a clustered column line ppt powerpoint presentation slides ideas. This is a four stage process. The stages in this process are business, finance, marketing, strategy, analysis, success.
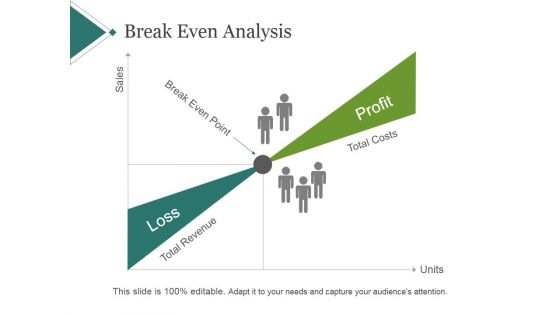
Break Even Analysis Ppt PowerPoint Presentation Clipart
This is a break even analysis ppt powerpoint presentation clipart. This is a two stage process. The stages in this process are profit, loss, sales, units, total costs.
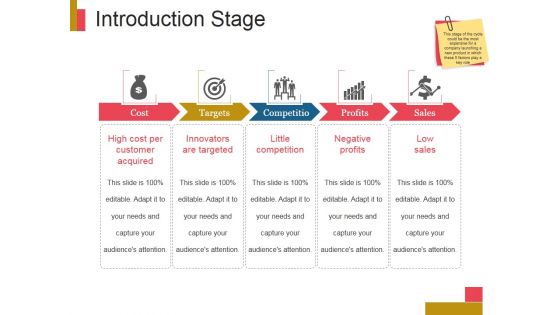
Introduction Stage Ppt PowerPoint Presentation Pictures
This is a introduction stage ppt powerpoint presentation pictures. This is a five stage process. The stages in this process are cost, targets, competition, profits, sales.
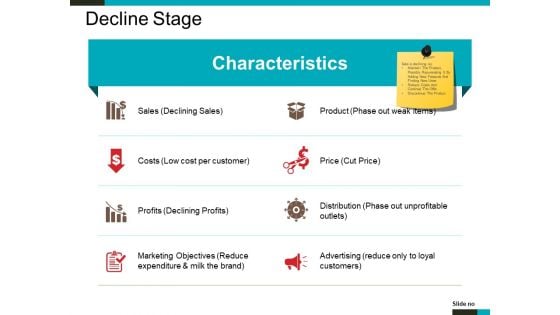
Decline Stage Ppt PowerPoint Presentation Inspiration Master Slide
This is a decline stage ppt powerpoint presentation inspiration master slide. This is a eight stage process. The stages in this process are sales, costs, profits, product, price.
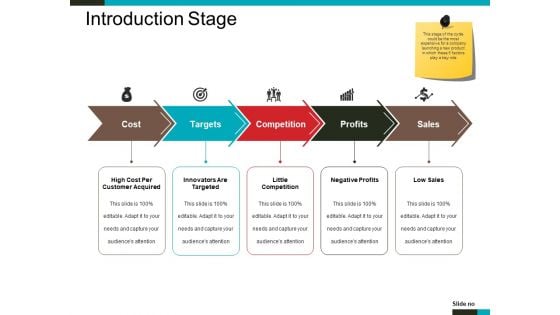
Introduction Stage Ppt PowerPoint Presentation Layouts Designs Download
This is a introduction stage ppt powerpoint presentation layouts designs download. This is a five stage process. The stages in this process are cost, targets, competition, profits, sales.
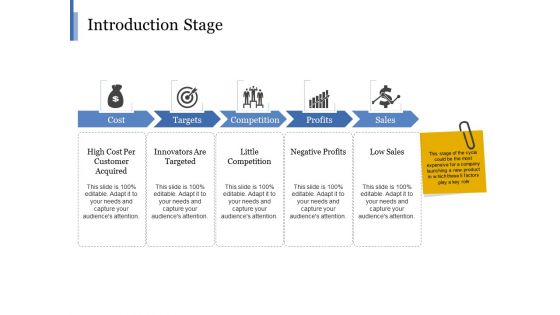
Introduction Stage Ppt PowerPoint Presentation Styles Portfolio
This is a introduction stage ppt powerpoint presentation styles portfolio. This is a five stage process. The stages in this process are cost, targets, competition, profits, sales.
Customer Lifetime Value Clv Ppt PowerPoint Presentation Icon Professional
This is a customer lifetime value clv ppt powerpoint presentation icon professional. This is a three stage process. The stages in this process are inactive nonprofit able, customer, active profitable customers, very active very profitable customers.


 Continue with Email

 Home
Home


