Revenue Slide
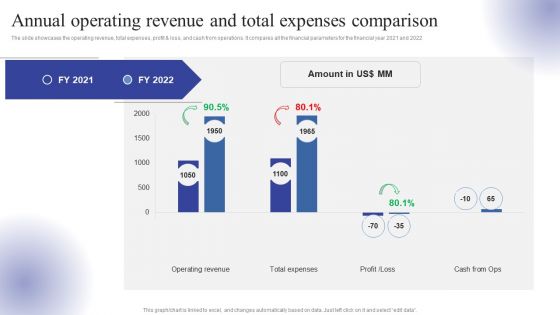
Annual Operating Revenue And Total Expenses Comparison Ppt Infographic Template Rules PDF
The slide showcases the operating revenue, total expenses, profit and loss, and cash from operations. It compares all the financial parameters for the financial year 2021 and 2022. Want to ace your presentation in front of a live audience Our Annual Operating Revenue And Total Expenses Comparison Ppt Infographic Template Rules PDF can help you do that by engaging all the users towards you.. Slidegeeks experts have put their efforts and expertise into creating these impeccable powerpoint presentations so that you can communicate your ideas clearly. Moreover, all the templates are customizable, and easy-to-edit and downloadable. Use these for both personal and commercial use.
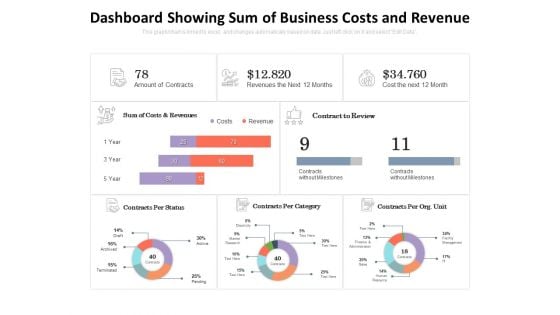
Dashboard Showing Sum Of Business Costs And Revenue Ppt PowerPoint Presentation Inspiration Gallery PDF
Presenting this set of slides with name dashboard showing sum of business costs and revenue ppt powerpoint presentation inspiration gallery pdf. The topics discussed in these slides are sum of costs and revenues, contract to review, contracts per org unit, contracts per category, contracts per status. This is a completely editable PowerPoint presentation and is available for immediate download. Download now and impress your audience.
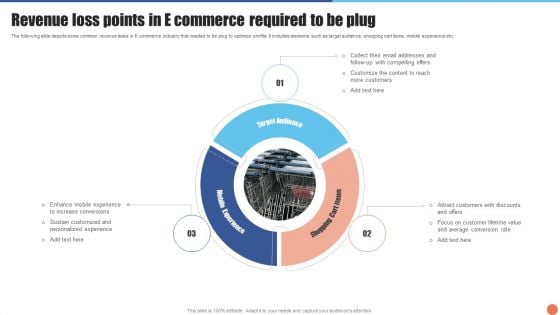
Revenue Loss Points In E Commerce Required To Be Plug Clipart PDF
The following slide depicts some common revenue leaks in E commerce industry that needed to be plug to optimize profits. It includes elements such as target audience, shopping cart items, mobile experience etc. Pitch your topic with ease and precision using this Revenue Loss Points In E Commerce Required To Be Plug Clipart PDF. This layout presents information on Target Audience, Mobile Experience, Shopping Cart Items. It is also available for immediate download and adjustment. So, changes can be made in the color, design, graphics or any other component to create a unique layout.
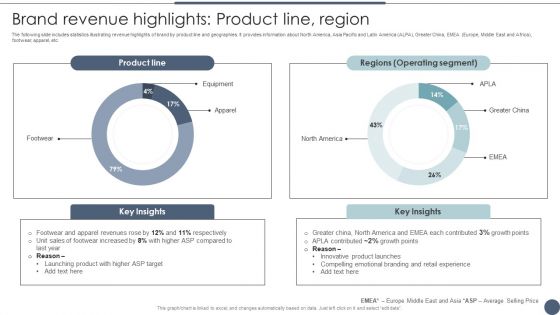
Brand Revenue Highlights Product Line Region Utilizing Emotional And Rational Branding For Improved Consumer Clipart PDF
The following slide includes statistics illustrating revenue highlights of brand by product line and geographies. It provides information about North America, Asia Pacific and Latin America ALPA, Greater China, EMEA Europe, Middle East and Africa, footwear, apparel, etc. There are so many reasons you need a Brand Revenue Highlights Product Line Region Utilizing Emotional And Rational Branding For Improved Consumer Clipart PDF. The first reason is you can not spend time making everything from scratch, Thus, Slidegeeks has made presentation templates for you too. You can easily download these templates from our website easily.
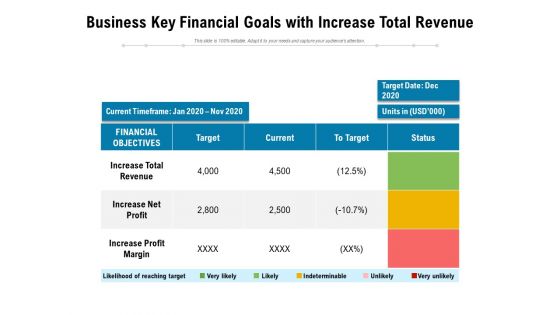
Business Key Financial Goals With Increase Total Revenue Ppt PowerPoint Presentation File Graphics Download PDF
Showcasing this set of slides titled business key financial goals with increase total revenue ppt powerpoint presentation file graphics download pdf. The topics addressed in these templates are target, revenue, financial. All the content presented in this PPT design is completely editable. Download it and make adjustments in color, background, font etc. as per your unique business setting.

Business Intelligence Report Table Of Content Revenue Ppt Pictures Graphic Tips PDF
Presenting this set of slides with name business intelligence report table of content revenue ppt pictures graphic tips pdf. This is a one stage process. The stages in this process are revenue model comparison, strategies adopted. This is a completely editable PowerPoint presentation and is available for immediate download. Download now and impress your audience.
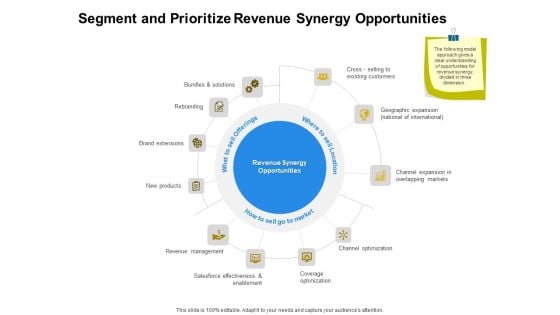
Firm Working Together Segment And Prioritize Revenue Synergy Opportunities Ppt Gallery Template PDF
Presenting this set of slides with name firm working together segment and prioritize revenue synergy opportunities ppt gallery template pdf. This is a eleven stage process. The stages in this process are revenue, management, optimization, effectiveness, rebranding. This is a completely editable PowerPoint presentation and is available for immediate download. Download now and impress your audience.
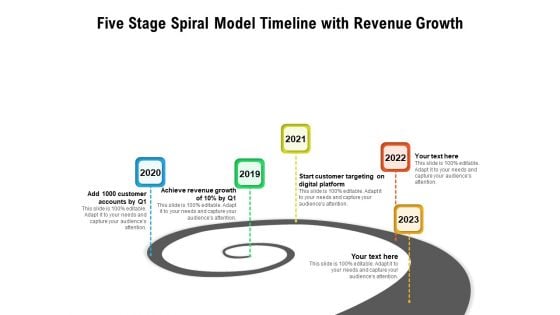
Five Stage Spiral Model Timeline With Revenue Growth Ppt PowerPoint Presentation Pictures Infographics PDF
Presenting this set of slides with name five stage spiral model timeline with revenue growth ppt powerpoint presentation pictures infographics pdf. This is a five stage process. The stages in this process are customer accounts, achieve revenue growth, start customer targeting on digital platform. This is a completely editable PowerPoint presentation and is available for immediate download. Download now and impress your audience.
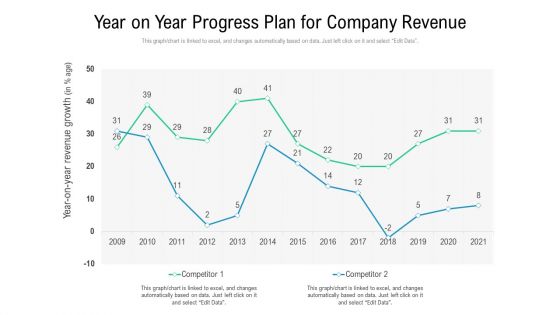
Year On Year Progress Plan For Company Revenue Ppt PowerPoint Presentation Gallery Background Image PDF
Showcasing this set of slides titled year on year progress plan for company revenue ppt powerpoint presentation gallery background image pdf. The topics addressed in these templates are year on year progress plan for company revenue. All the content presented in this PPT design is completely editable. Download it and make adjustments in color, background, font etc. as per your unique business setting.
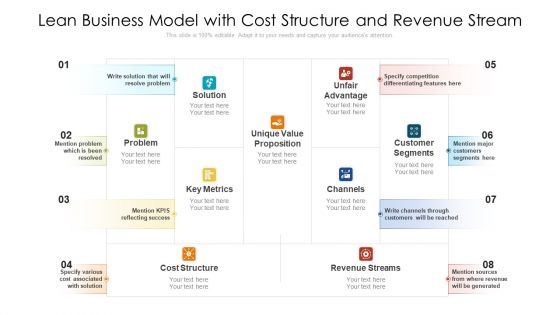
Lean Business Model With Cost Structure And Revenue Stream Ppt PowerPoint Presentation File Summary PDF
Showcasing this set of slides titled lean business model with cost structure and revenue stream ppt powerpoint presentation file summary pdf. The topics addressed in these templates are key metrics, cost structure, revenue streams, customer segments. All the content presented in this PPT design is completely editable. Download it and make adjustments in color, background, font etc. as per your unique business setting.

Trade Event Tactics To Boost Impact 1 Increase In Annual Sales Revenue SA SS V
This slide showcases an increase in business sales revenue compared to the previous year due to effective sales networking strategy implementation. Explore a selection of the finest Trade Event Tactics To Boost Impact 1 Increase In Annual Sales Revenue SA SS V here. With a plethora of professionally designed and pre-made slide templates, you can quickly and easily find the right one for your upcoming presentation. You can use our Trade Event Tactics To Boost Impact 1 Increase In Annual Sales Revenue SA SS V to effectively convey your message to a wider audience. Slidegeeks has done a lot of research before preparing these presentation templates. The content can be personalized and the slides are highly editable. Grab templates today from Slidegeeks. This slide showcases an increase in business sales revenue compared to the previous year due to effective sales networking strategy implementation.
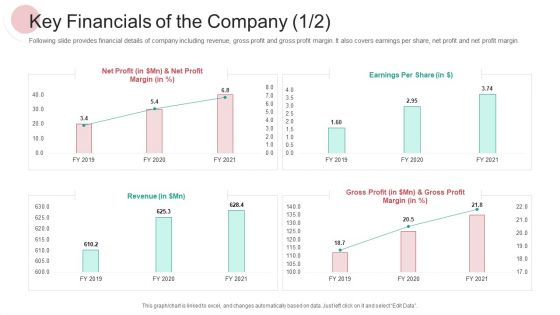
Real Capital Market Bid Assessment Key Financials Of The Company Revenue Designs PDF
Following slide provides financial details of company including revenue, gross profit and gross profit margin. It also covers earnings per share, net profit and net profit margin.Deliver an awe-inspiring pitch with this creative real capital market bid assessment key financials of the company revenue designs pdf. bundle. Topics like revenue, gross profit, earnings per share, net profit can be discussed with this completely editable template. It is available for immediate download depending on the needs and requirements of the user.
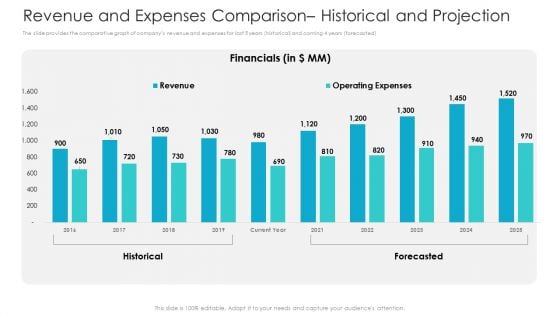
Private Equity Fundraising Pitch Deck Revenue And Expenses Comparison Historical And Projection Clipart PDF
The slide provides the comparative graph of companys revenue and expenses for last 5 years historical and coming 4 years forecasted. Deliver and pitch your topic in the best possible manner with this private equity fundraising pitch deck revenue and expenses comparison historical and projection clipart pdf. Use them to share invaluable insights on financials, revenue, operating expenses, 2016 to 2025 and impress your audience. This template can be altered and modified as per your expectations. So, grab it now.
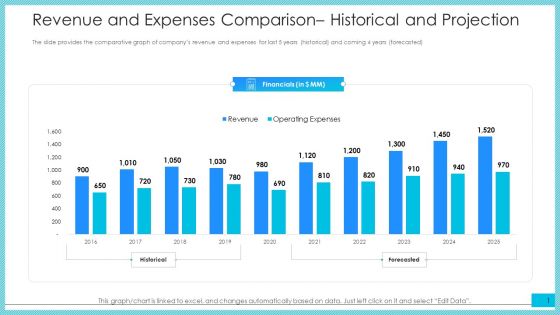
Revenue And Expenses Comparison Historical And Projection Ppt Summary Example Introduction PDF
The slide provides the comparative graph of companys revenue and expenses for last 5 years historical and coming 4 years forecasted.Deliver and pitch your topic in the best possible manner with this revenue and expenses comparison historical and projection ppt summary example introduction pdf. Use them to share invaluable insights on financials, 2016 to 2025, revenue, operating expenses and impress your audience. This template can be altered and modified as per your expectations. So, grab it now.
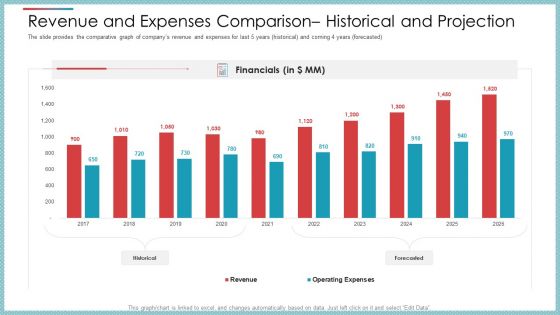
Revenue And Expenses Comparison Historical And Projection Ppt Styles Graphics Design PDF
The slide provides the comparative graph of companys revenue and expenses for last 5 years historical and coming 4 years forecasted.Deliver an awe-inspiring pitch with this creative revenue and expenses comparison historical and projection ppt styles graphics design pdf. bundle. Topics like financials, 2016 to 2025, revenue, operating expenses can be discussed with this completely editable template. It is available for immediate download depending on the needs and requirements of the user.
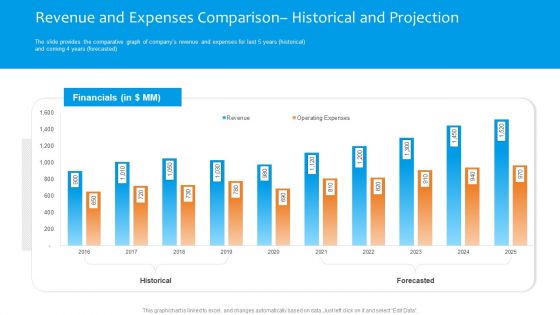
Funding Pitch To Raise Funds From PE Revenue And Expenses Comparison Historical And Projection Summary PDF
The slide provides the comparative graph of companys revenue and expenses for last 5 years historical and coming 4 years forecasted. Deliver an awe inspiring pitch with this creative funding pitch to raise funds from pe revenue and expenses comparison historical and projection summary pdf bundle. Topics like financials, historical, forecasted, revenue, expenses can be discussed with this completely editable template. It is available for immediate download depending on the needs and requirements of the user.
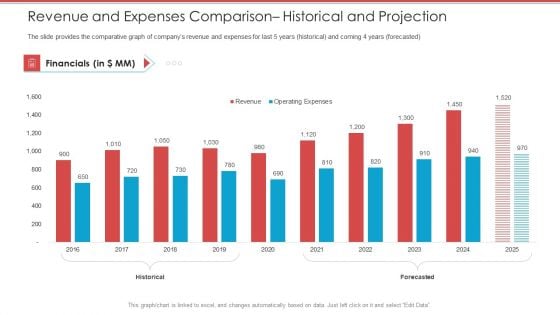
Cash Market Investor Deck Revenue And Expenses Comparison Historical And Projection Ppt Professional Information PDF
The slide provides the comparative graph of companys revenue and expenses for last 5 years historical and coming 4 years forecasted. Deliver and pitch your topic in the best possible manner with this cash market investor deck revenue and expenses comparison historical and projection ppt professional information pdf. Use them to share invaluable insights on financials, revenue, operating expenses, 2016 to 2025 and impress your audience. This template can be altered and modified as per your expectations. So, grab it now.
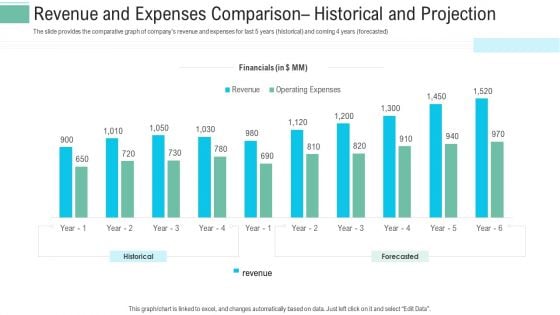
Revenue And Expenses Comparison Historical And Projection Ppt Layouts Grid PDF
The slide provides the comparative graph of companys revenue and expenses for last 5 years historical and coming 4 years forecasted. Deliver and pitch your topic in the best possible manner with this revenue and expenses comparison historical and projection ppt layouts grid pdf. Use them to share invaluable insights on financials, operating expenses, revenue and impress your audience. This template can be altered and modified as per your expectations. So, grab it now.
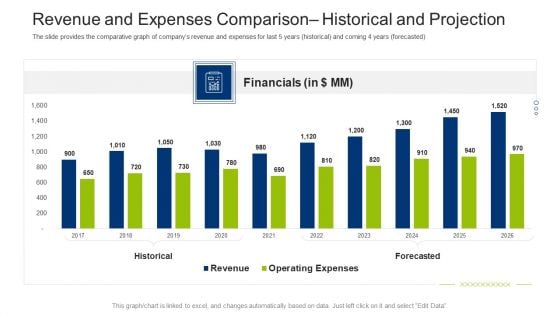
Investment Fundraising Pitch Deck From Stock Market Revenue And Expenses Comparison Historical And Projection Infographics PDF
The slide provides the comparative graph of companys revenue and expenses for last 5 years historical and coming 4 years forecasted. Deliver an awe inspiring pitch with this creative investment fundraising pitch deck from stock market revenue and expenses comparison historical and projection infographics pdf bundle. Topics like financials, historical, forecasted, revenue, expenses can be discussed with this completely editable template. It is available for immediate download depending on the needs and requirements of the user.
Revenue And Expenses Comparison Historical And Projection Ppt Icon Files PDF
The slide provides the comparative graph of companys revenue and expenses for last 5 years historical and coming 4 years forecasted.Deliver and pitch your topic in the best possible manner with this revenue and expenses comparison historical and projection ppt icon files pdf. Use them to share invaluable insights on financials, 2016 to 2025, revenue, operating expenses and impress your audience. This template can be altered and modified as per your expectations. So, grab it now.
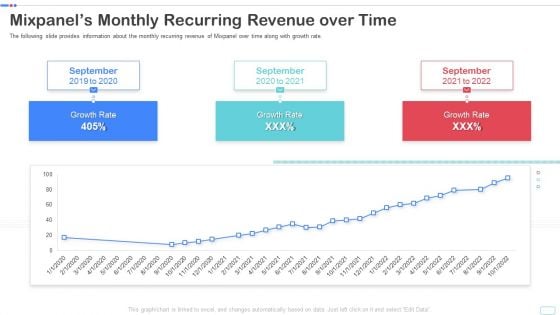
Mixpanel Capital Raising Pitch Deck Mixpanels Monthly Recurring Revenue Over Time Guidelines PDF
The following slide provides information about the monthly recurring revenue of Mixpanel over time along with growth rate. Deliver an awe inspiring pitch with this creative mixpanel capital raising pitch deck mixpanels monthly recurring revenue over time guidelines pdf bundle. Topics like mixpanels monthly recurring revenue over time can be discussed with this completely editable template. It is available for immediate download depending on the needs and requirements of the user.
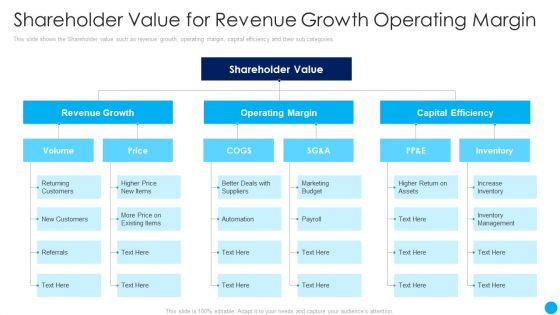
Shareholder Value For Revenue Growth Operating Margin Techniques Increase Stakeholder Value Ideas PDF
This slide shows the Shareholder value such as revenue growth, operating margin, capital efficiency and their sub categories. Deliver and pitch your topic in the best possible manner with this shareholder value for revenue growth operating margin techniques increase stakeholder value ideas pdf. Use them to share invaluable insights on revenue growth, operating margin, capital efficiency and impress your audience. This template can be altered and modified as per your expectations. So, grab it now.

Checklist For Indirect Sales Revenue Internet Based Trade Structure Ppt Powerpoint
This slide shows a detailed review list for indirect sales revenue model in ecommerce business for generating online income. It include points such as identify partners and communicate with partners, etc. Do you have an important presentation coming up Are you looking for something that will make your presentation stand out from the rest Look no further than Checklist For Indirect Sales Revenue Internet Based Trade Structure Ppt Powerpoint. With our professional designs, you can trust that your presentation will pop and make delivering it a smooth process. And with Slidegeeks, you can trust that your presentation will be unique and memorable. So why wait Grab Checklist For Indirect Sales Revenue Internet Based Trade Structure Ppt Powerpoint today and make your presentation stand out from the rest This slide shows a detailed review list for indirect sales revenue model in ecommerce business for generating online income. It include points such as identify partners and communicate with partners, etc.
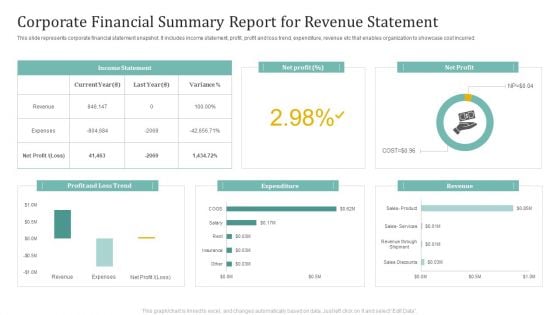
Corporate Financial Summary Report For Revenue Statement Ppt Ideas Graphic Images
This slide represents corporate financial statement snapshot. It includes income statement, profit, profit and loss trend, expenditure, revenue etc that enables organization to showcase cost incurred. Showcasing this set of slides titled Corporate Financial Summary Report For Revenue Statement Ppt Ideas Graphic Images. The topics addressed in these templates are Income Statement, Net Profit, Expenditure. All the content presented in this PPT design is completely editable. Download it and make adjustments in color, background, font etc. as per your unique business setting.
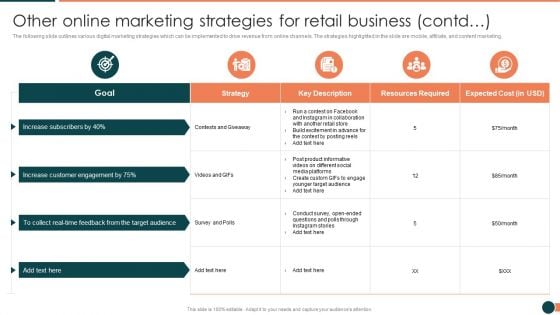
Developing Retail Marketing Strategies To Increase Revenue Other Online Marketing Elements PDF
The following slide outlines various digital marketing strategies which can be implemented to drive revenue from online channels. The strategies highlighted in the slide are mobile, affiliate, and content marketing.Deliver an awe inspiring pitch with this creative Developing Retail Marketing Strategies To Increase Revenue Other Online Marketing Elements PDF bundle. Topics like Resources Required, Expected Cost, Instagram In Collaboration can be discussed with this completely editable template. It is available for immediate download depending on the needs and requirements of the user.

Impact Of Brand Communication Techniques On Equity And Revenue Microsoft PDF
The following slide showcases impact of branding effecively on revenue generation of business. It presents information related to brand strategy, equity, communication channels, etc. Showcasing this set of slides titled Impact Of Brand Communication Techniques On Equity And Revenue Microsoft PDF. The topics addressed in these templates are Brand Equity, Brand Communication, Brand Strategy. All the content presented in this PPT design is completely editable. Download it and make adjustments in color, background, font etc. as per your unique business setting.
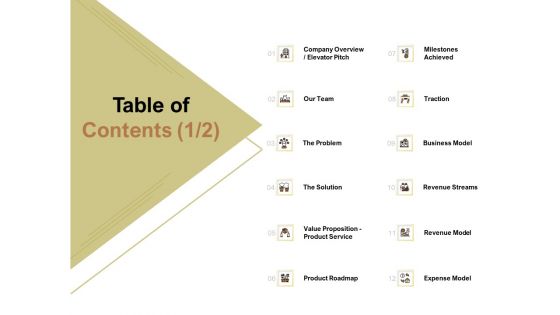
Raise Capital For Business Table Of Contents Revenue Ppt File Design Inspiration PDF
Presenting this set of slides with name raise capital for business table of contents revenue ppt file design inspiration pdf. The topics discussed in these slides are strategy, growth, financing, analysis, marketing. This is a completely editable PowerPoint presentation and is available for immediate download. Download now and impress your audience.
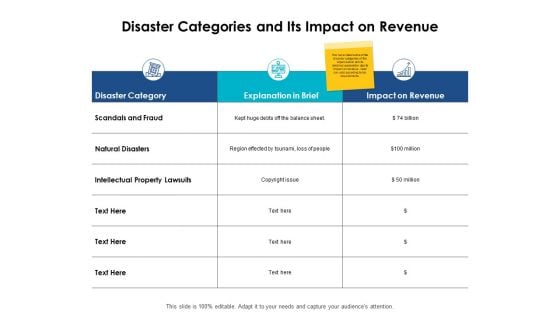
Disaster Categories And Its Impact On Revenue Ppt PowerPoint Presentation Infographic Template Diagrams
Presenting this set of slides with name disaster categories and its impact on revenue ppt powerpoint presentation infographic template diagrams. The topics discussed in these slides are strength, marketing, business, management, planning. This is a completely editable PowerPoint presentation and is available for immediate download. Download now and impress your audience.
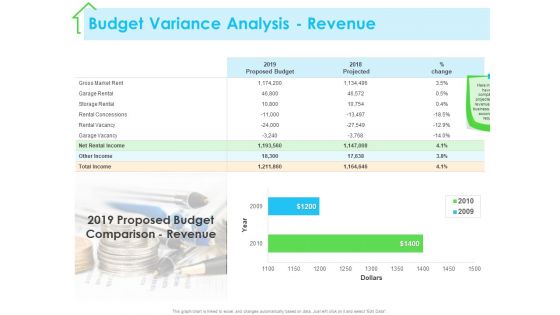
Real Estate Development Budget Variance Analysis Revenue Ppt PowerPoint Presentation Design Templates PDF
Presenting this set of slides with name real estate development budget variance analysis revenue ppt powerpoint presentation design templates pdf. The topics discussed in these slides are gross market rent, garage rental, storage rental, rental concessions, rental vacancy. This is a completely editable PowerPoint presentation and is available for immediate download. Download now and impress your audience.
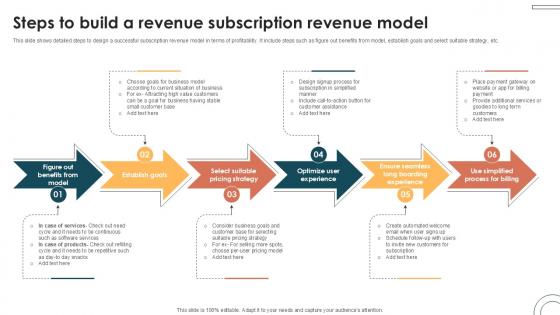
Steps To Build A Revenue Subscription Internet Based Trade Structure Ppt Template
This slide shows detailed steps to design a successful subscription revenue model in terms of profitability. It include steps such as figure out benefits from model, establish goals and select suitable strategy, etc. This modern and well-arranged Steps To Build A Revenue Subscription Internet Based Trade Structure Ppt Template provides lots of creative possibilities. It is very simple to customize and edit with the Powerpoint Software. Just drag and drop your pictures into the shapes. All facets of this template can be edited with Powerpoint, no extra software is necessary. Add your own material, put your images in the places assigned for them, adjust the colors, and then you can show your slides to the world, with an animated slide included. This slide shows detailed steps to design a successful subscription revenue model in terms of profitability. It include steps such as figure out benefits from model, establish goals and select suitable strategy, etc.
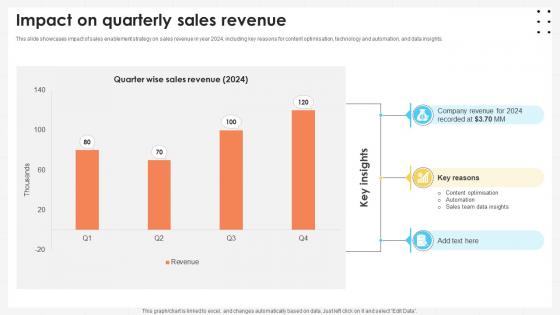
Business Development Team Impact On Quarterly Sales Revenue SA SS V
This slide showcases impact of sales enablement strategy on sales revenue in year 2024, including key reasons for content optimisation, technology and automation, and data insights. The best PPT templates are a great way to save time, energy, and resources. Slidegeeks have 100 percent editable powerpoint slides making them incredibly versatile. With these quality presentation templates, you can create a captivating and memorable presentation by combining visually appealing slides and effectively communicating your message. Download Business Development Team Impact On Quarterly Sales Revenue SA SS V from Slidegeeks and deliver a wonderful presentation. This slide showcases impact of sales enablement strategy on sales revenue in year 2024, including key reasons for content optimisation, technology and automation, and data insights.
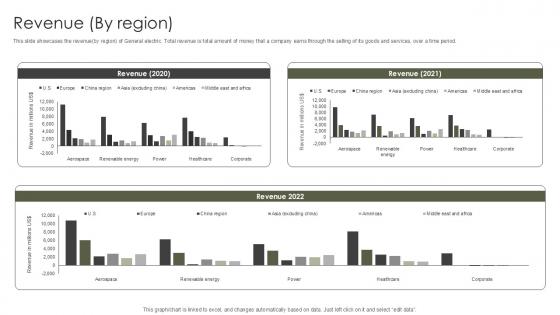
Revenue By Region Military Aircraft Engine Manufacturing PPT Example CP SS V
This slide showcases the revenueby region of General electric. Total revenue is total amount of money that a company earns through the selling of its goods and services, over a time period. Create an editable Revenue By Region Military Aircraft Engine Manufacturing PPT Example CP SS V that communicates your idea and engages your audience. Whether you are presenting a business or an educational presentation, pre-designed presentation templates help save time. Revenue By Region Military Aircraft Engine Manufacturing PPT Example CP SS V is highly customizable and very easy to edit, covering many different styles from creative to business presentations. Slidegeeks has creative team members who have crafted amazing templates. So, go and get them without any delay. This slide showcases the revenueby region of General electric. Total revenue is total amount of money that a company earns through the selling of its goods and services, over a time period.
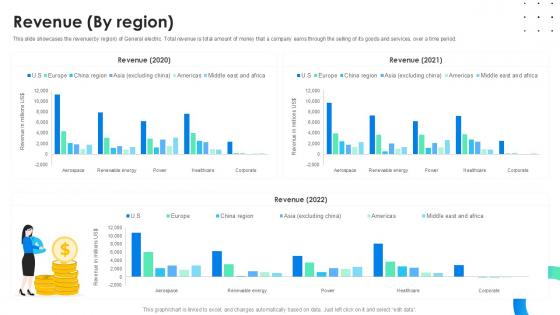
Revenue By Region Global Energy Company Profile PPT Sample CP SS V
This slide showcases the revenueby region of General electric. Total revenue is total amount of money that a company earns through the selling of its goods and services, over a time period. Create an editable Revenue By Region Global Energy Company Profile PPT Sample CP SS V that communicates your idea and engages your audience. Whether you are presenting a business or an educational presentation, pre-designed presentation templates help save time. Revenue By Region Global Energy Company Profile PPT Sample CP SS V is highly customizable and very easy to edit, covering many different styles from creative to business presentations. Slidegeeks has creative team members who have crafted amazing templates. So, go and get them without any delay. This slide showcases the revenueby region of General electric. Total revenue is total amount of money that a company earns through the selling of its goods and services, over a time period.
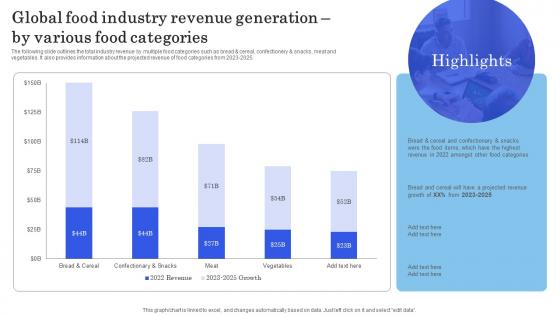
Launching New Commodity Global Food Industry Revenue Generation By Various Food Themes Pdf
The following slide outlines the total industry revenue by multiple food categories such as bread and cereal, confectionery and snacks, meat and vegetables. It also provides information about the projected revenue of food categories from 2023-2025. If you are looking for a format to display your unique thoughts, then the professionally designed Launching New Commodity Global Food Industry Revenue Generation By Various Food Themes Pdf is the one for you. You can use it as a Google Slides template or a PowerPoint template. Incorporate impressive visuals, symbols, images, and other charts. Modify or reorganize the text boxes as you desire. Experiment with shade schemes and font pairings. Alter, share or cooperate with other people on your work. Download Launching New Commodity Global Food Industry Revenue Generation By Various Food Themes Pdf and find out how to give a successful presentation. Present a perfect display to your team and make your presentation unforgettable. The following slide outlines the total industry revenue by multiple food categories such as bread and cereal, confectionery and snacks, meat and vegetables. It also provides information about the projected revenue of food categories from 2023-2025.

Increasing Business Awareness Positive Impact On Business Revenue And Policy Sales Strategy SS V
This slide represents graphs showcasing policy sales growth and revenue. It showcases a positive impact and increase in overall business. Do you have an important presentation coming up Are you looking for something that will make your presentation stand out from the rest Look no further than Increasing Business Awareness Positive Impact On Business Revenue And Policy Sales Strategy SS V. With our professional designs, you can trust that your presentation will pop and make delivering it a smooth process. And with Slidegeeks, you can trust that your presentation will be unique and memorable. So why wait Grab Increasing Business Awareness Positive Impact On Business Revenue And Policy Sales Strategy SS V today and make your presentation stand out from the rest This slide represents graphs showcasing policy sales growth and revenue. It showcases a positive impact and increase in overall business.
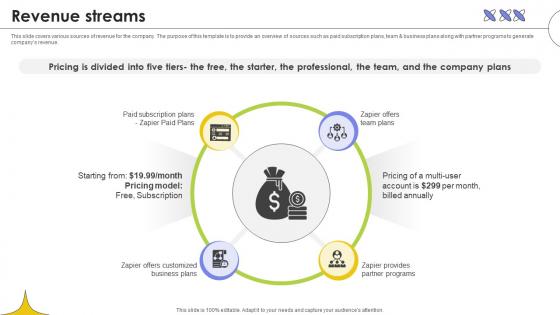
Revenue Streams Web Based Automated Tool Platform Pitch Deck Ppt Sample
This slide covers various sources of revenue for the company. The purpose of this template is to provide an overview of sources such as paid subscription plans, team and business plans along with partner programs to generate companys revenue. Coming up with a presentation necessitates that the majority of the effort goes into the content and the message you intend to convey. The visuals of a PowerPoint presentation can only be effective if it supplements and supports the story that is being told. Keeping this in mind our experts created Revenue Streams Web Based Automated Tool Platform Pitch Deck Ppt Sample to reduce the time that goes into designing the presentation. This way, you can concentrate on the message while our designers take care of providing you with the right template for the situation. This slide covers various sources of revenue for the company. The purpose of this template is to provide an overview of sources such as paid subscription plans, team and business plans along with partner programs to generate companys revenue.
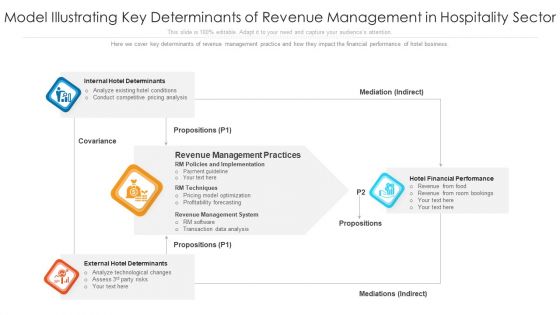
Model Illustrating Key Determinants Of Revenue Management In Hospitality Sector Portrait PDF
Here we cover key determinants of revenue management practice and how they impact the financial performance of hotel business. Showcasing this set of slides titled model illustrating key determinants of revenue management in hospitality sector portrait pdf. The topics addressed in these templates are revenue management practices, internal hotel determinants, external hotel determinants. All the content presented in this PPT design is completely editable. Download it and make adjustments in color, background, font etc. as per your unique business setting.
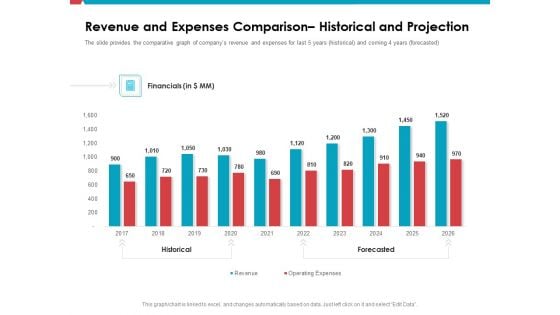
Revenue And Expenses Comparison Historical And Projection Ppt Show Format PDF
The slide provides the comparative graph of companys revenue and expenses for last 5 years historical and coming 4 years forecasted. Deliver an awe-inspiring pitch with this creative revenue and expenses comparison historical and projection ppt show format pdf bundle. Topics like historical, forecasted, financials can be discussed with this completely editable template. It is available for immediate download depending on the needs and requirements of the user.
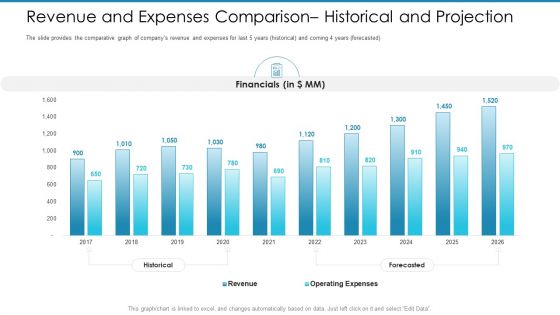
Post Initial Pubic Offering Market Pitch Deck Revenue And Expenses Comparison Historical And Projection Sample PDF
The slide provides the comparative graph of companys revenue and expenses for last 5 years historical and coming 4 years forecasted.Deliver an awe-inspiring pitch with this creative post initial pubic offering market pitch deck revenue and expenses comparison historical and projection sample pdf. bundle. Topics like financials, 2017 to 2026 can be discussed with this completely editable template. It is available for immediate download depending on the needs and requirements of the user.
Retail Channel Report With Sales Revenue And Customers Ppt PowerPoint Presentation Icon Ideas PDF
Showcasing this set of slides titled retail channel report with sales revenue and customers ppt powerpoint presentation icon ideas pdf. The topics addressed in these templates are sale revenue, customers sale by division, articles by sold items, collection by revenue. All the content presented in this PPT design is completely editable. Download it and make adjustments in color, background, font etc. as per your unique business setting.

Elevating Sales Networks Impact 1 Increase In Annual Sales Revenue SA SS V
This slide showcases an increase in business sales revenue compared to the previous year due to effective sales networking strategy implementation. Welcome to our selection of the Elevating Sales Networks Impact 1 Increase In Annual Sales Revenue SA SS V. These are designed to help you showcase your creativity and bring your sphere to life. Planning and Innovation are essential for any business that is just starting out. This collection contains the designs that you need for your everyday presentations. All of our PowerPoints are 100Percent editable, so you can customize them to suit your needs. This multi-purpose template can be used in various situations. Grab these presentation templates today. This slide showcases an increase in business sales revenue compared to the previous year due to effective sales networking strategy implementation.

Annual Revenue And Net Income Global Innovation And Business Solutions Company Profile CP SS V
This slide represents on financial highlights of Accenture which represents revenue and net income for last five years from 2018 to 2022.Boost your pitch with our creative Annual Revenue And Net Income Global Innovation And Business Solutions Company Profile CP SS V. Deliver an awe-inspiring pitch that will mesmerize everyone. Using these presentation templates you will surely catch everyones attention. You can browse the ppts collection on our website. We have researchers who are experts at creating the right content for the templates. So you do not have to invest time in any additional work. Just grab the template now and use them. This slide represents on financial highlights of Accenture which represents revenue and net income for last five years from 2018 to 2022.

Annual Revenue And Net Income Global Consulting And Technology Services Company Profile CP SS V
This slide represents on financial highlights of Accenture which represents revenue and net income for last five years from 2018 to 2022.Boost your pitch with our creative Annual Revenue And Net Income Global Consulting And Technology Services Company Profile CP SS V. Deliver an awe-inspiring pitch that will mesmerize everyone. Using these presentation templates you will surely catch everyones attention. You can browse the ppts collection on our website. We have researchers who are experts at creating the right content for the templates. So you do not have to invest time in any additional work. Just grab the template now and use them. This slide represents on financial highlights of Accenture which represents revenue and net income for last five years from 2018 to 2022.
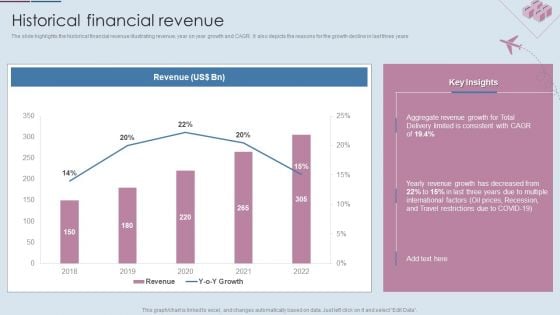
Logistics Shipment Company Profile Historical Financial Revenue Ppt Gallery Templates PDF
The slide highlights the historical financial revenue illustrating revenue, year on year growth and CAGR. It also depicts the reasons for the growth decline in last three years. Deliver and pitch your topic in the best possible manner with this Logistics Shipment Company Profile Historical Financial Revenue Ppt Gallery Templates PDF. Use them to share invaluable insights on Revenue, 2018 To 2022, Aggregate Revenue Growth and impress your audience. This template can be altered and modified as per your expectations. So, grab it now.
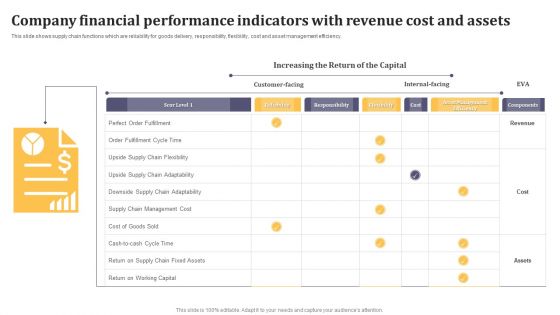
Company Financial Performance Indicators With Revenue Cost And Assets Background PDF
This slide shows supply chain functions which are reliability for goods delivery, responsibility, flexibility, cost and asset management efficiency. Showcasing this set of slides titled Company Financial Performance Indicators With Revenue Cost And Assets Background PDF. The topics addressed in these templates are Perfect Order Fulfillment, Cycle Time, Supply Chain, Management Cost. All the content presented in this PPT design is completely editable. Download it and make adjustments in color, background, font etc. as per your unique business setting.
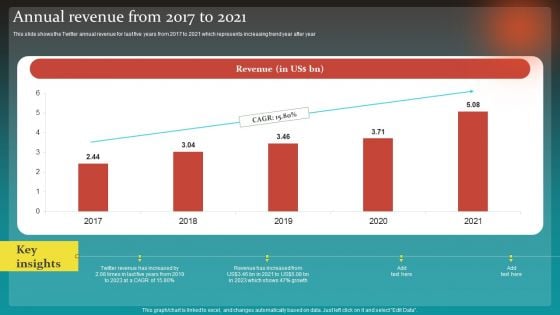
Social Network Business Summary Annual Revenue From 2017 To 2021 Download PDF
This slide shows the Twitter annual revenue for last five years from 2017 to 2021 which represents increasing trend year after year The Social Network Business Summary Annual Revenue From 2017 To 2021 Download PDF is a compilation of the most recent design trends as a series of slides. It is suitable for any subject or industry presentation, containing attractive visuals and photo spots for businesses to clearly express their messages. This template contains a variety of slides for the user to input data, such as structures to contrast two elements, bullet points, and slides for written information. Slidegeeks is prepared to create an impression.
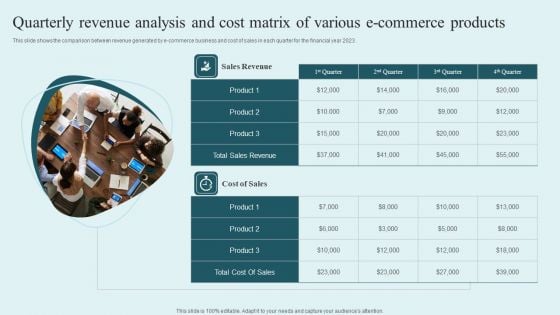
Quarterly Revenue Analysis And Cost Matrix Of Various E Commerce Products Template PDF
This slide shows the comparison between revenue generated by e-commerce business and cost of sales in each quarter for the financial year 2023. Presenting Quarterly Revenue Analysis And Cost Matrix Of Various E Commerce Products Template PDF to dispense important information. This template comprises two stages. It also presents valuable insights into the topics including Sales Revenue, Cost Sales, Total Sales Revenue. This is a completely customizable PowerPoint theme that can be put to use immediately. So, download it and address the topic impactfully.
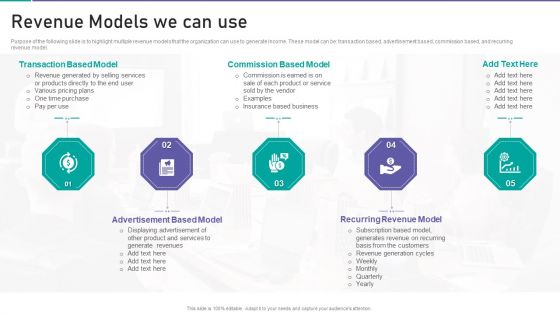
Corporate Organization Playbook Revenue Models We Can Use Ppt File Pictures PDF
Purpose of the following slide is to highlight multiple revenue models that the organization can use to generate income. These model can be transaction based, advertisement based, commission based, and recurring revenue model. This is a corporate organization playbook revenue models we can use ppt file pictures pdf template with various stages. Focus and dispense information on five stages using this creative set, that comes with editable features. It contains large content boxes to add your information on topics like transaction based model, commission based model, advertisement based model, recurring revenue model. You can also showcase facts, figures, and other relevant content using this PPT layout. Grab it now.
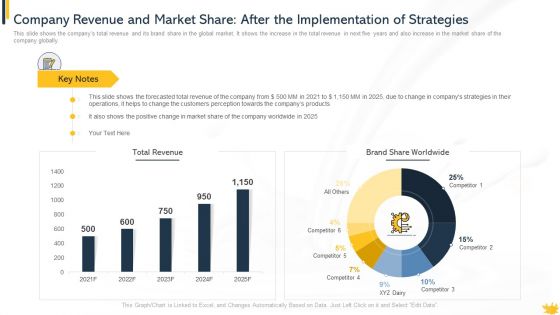
Company Revenue And Market Share After The Implementation Of Strategies Mockup PDF
This slide shows the companys total revenue and its brand share in the global market. It shows the increase in the total revenue in next five years and also increase in the market share of the company globally.Deliver an awe inspiring pitch with this creative company revenue and market share after the implementation of strategies mockup pdf bundle. Topics like company revenue and market share after the implementation of strategies can be discussed with this completely editable template. It is available for immediate download depending on the needs and requirements of the user.
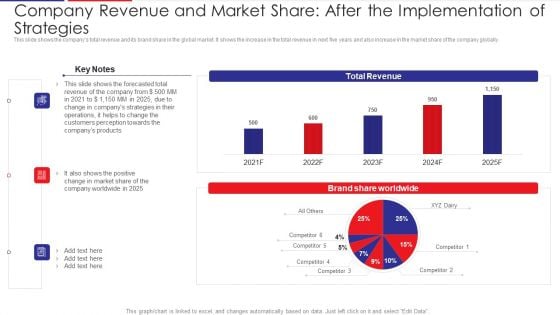
Company Revenue And Market Share After The Implementation Of Strategies Download PDF
This slide shows the companys total revenue and its brand share in the global market. It shows the increase in the total revenue in next five years and also increase in the market share of the company globally. Deliver an awe inspiring pitch with this creative company revenue and market share after the implementation of strategies download pdf bundle. Topics like revenue, strategies, market share can be discussed with this completely editable template. It is available for immediate download depending on the needs and requirements of the user.
Factor Influencing User Experience Dairy Industry Company Revenue And Market Share Icons PDF
This slide shows the companys total revenue and its brand share in the global market. It shows the increase in the total revenue in next five years and also increase in the market share of the company globally. Deliver and pitch your topic in the best possible manner with this factor influencing user experience dairy industry company revenue and market share icons pdf . Use them to share invaluable insights on company revenue and market share after the implementation of strategies and impress your audience. This template can be altered and modified as per your expectations. So, grab it now.
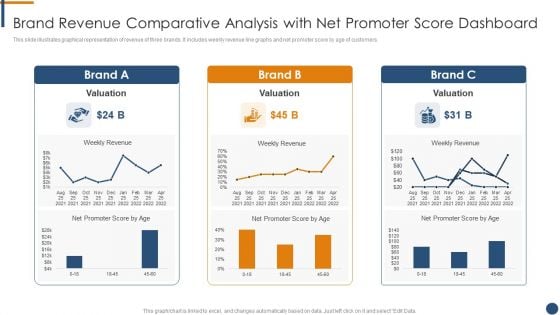
Brand Revenue Comparative Analysis With Net Promoter Score Dashboard Mockup PDF
This slide illustrates graphical representation of revenue of three brands. It includes weekly revenue line graphs and net promoter score by age of customers.Pitch your topic with ease and precision using this Brand Revenue Comparative Analysis With Net Promoter Score Dashboard Mockup PDF. This layout presents information on Brand Revenue Comparative Analysis With Net Promoter Score Dashboard. It is also available for immediate download and adjustment. So, changes can be made in the color, design, graphics or any other component to create a unique layout.
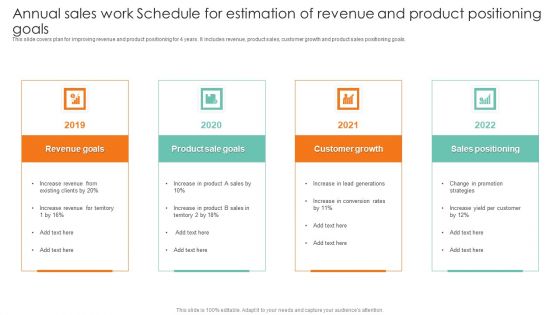
Annual Sales Work Schedule For Estimation Of Revenue And Product Positioning Goals Demonstration PDF
This slide covers plan for improving revenue and product positioning for 4 years. It includes revenue, product sales, customer growth and product sales positioning goals.Presenting Annual Sales Work Schedule For Estimation Of Revenue And Product Positioning Goals Demonstration PDF to dispense important information. This template comprises four stages. It also presents valuable insights into the topics including Revenue Goals, Customer Growth, Sales Positioning. This is a completely customizable PowerPoint theme that can be put to use immediately. So, download it and address the topic impactfully.
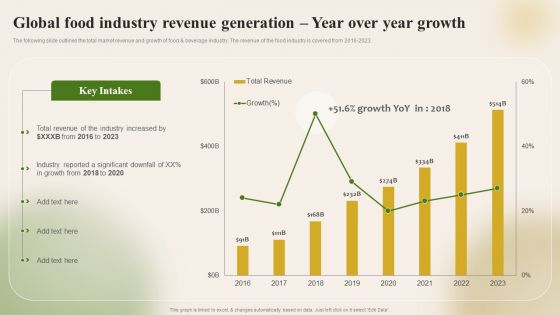
Introducing New Food Commodity Global Food Industry Revenue Generation Year Over Download PDF
The following slide outlines the total market revenue and growth of food and beverage industry. The revenue of the food industry is covered from 2016-2023. From laying roadmaps to briefing everything in detail, our templates are perfect for you. You can set the stage with your presentation slides. All you have to do is download these easy-to-edit and customizable templates. Introducing New Food Commodity Global Food Industry Revenue Generation Year Over Download PDF will help you deliver an outstanding performance that everyone would remember and praise you for. Do download this presentation today.
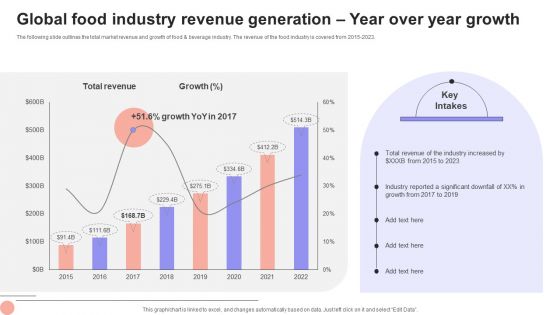
Overview Of The Food Global Food Industry Revenue Generation Year Over Year Growth Designs PDF
The following slide outlines the total market revenue and growth of food and beverage industry. The revenue of the food industry is covered from 2015-2023. Slidegeeks is one of the best resources for PowerPoint templates. You can download easily and regulate Overview Of The Food Global Food Industry Revenue Generation Year Over Year Growth Designs PDF for your personal presentations from our wonderful collection. A few clicks is all it takes to discover and get the most relevant and appropriate templates. Use our Templates to add a unique zing and appeal to your presentation and meetings. All the slides are easy to edit and you can use them even for advertisement purposes.

New Project Management Increase In Project Revenue And Productivity Information PDF
This slide shows the graphical presentation of increase in revenue and productivity of the project from Q1 2021 to Q4 2021, after shifting the PMO priorities. Deliver and pitch your topic in the best possible manner with this New Project Management Increase In Project Revenue And Productivity Information PDF. Use them to share invaluable insights on Project Revenue And Productivity, Project Revenue, Project Productivity and impress your audience. This template can be altered and modified as per your expectations. So, grab it now.
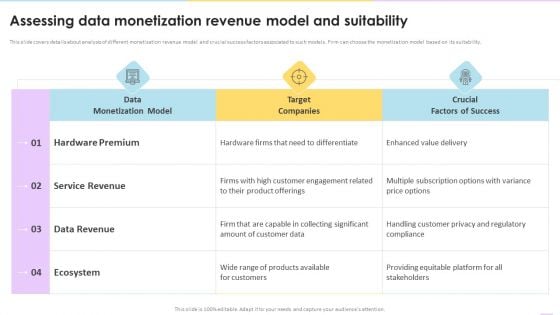
Data Valuation And Monetization Assessing Data Monetization Revenue Model And Suitability Graphics PDF
This slide covers details about analysis of different monetization revenue model and crucial success factors associated to such models. Firm can choose the monetization model based on its suitability. Deliver an awe inspiring pitch with this creative Data Valuation And Monetization Assessing Data Monetization Revenue Model And Suitability Graphics PDF bundle. Topics like Hardware Premium, Service Revenue, Data Revenue can be discussed with this completely editable template. It is available for immediate download depending on the needs and requirements of the user.
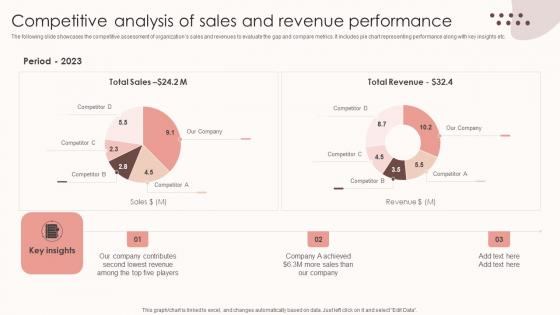
Assessing Sales Risks Competitive Analysis Of Sales And Revenue Performance Clipart PDF
The following slide showcases the competitive assessment of organizations sales and revenues to evaluate the gap and compare metrics. It includes pie chart representing performance along with key insights etc. Present like a pro with Assessing Sales Risks Competitive Analysis Of Sales And Revenue Performance Clipart PDF Create beautiful presentations together with your team, using our easy-to-use presentation slides. Share your ideas in real-time and make changes on the fly by downloading our templates. So whether you are in the office, on the go, or in a remote location, you can stay in sync with your team and present your ideas with confidence. With Slidegeeks presentation got a whole lot easier. Grab these presentations today. The following slide showcases the competitive assessment of organizations sales and revenues to evaluate the gap and compare metrics. It includes pie chart representing performance along with key insights etc.
B2B Marketing Budget Percentage Revenue Ppt PowerPoint Presentation Professional Portrait Cpb Pdf
Presenting this set of slides with name b2b marketing budget percentage revenue ppt powerpoint presentation professional portrait cpb pdf. This is an editable Powerpoint four stages graphic that deals with topics like b2b marketing budget percentage revenue to help convey your message better graphically. This product is a premium product available for immediate download and is 100 percent editable in Powerpoint. Download this now and use it in your presentations to impress your audience.
Supply Chain Costs Percent Revenue Ppt PowerPoint Presentation Outline Shapes Cpb Pdf
Presenting this set of slides with name supply chain costs percent revenue ppt powerpoint presentation outline shapes cpb pdf. This is an editable Powerpoint five stages graphic that deals with topics like supply chain costs percent revenue to help convey your message better graphically. This product is a premium product available for immediate download and is 100 percent editable in Powerpoint. Download this now and use it in your presentations to impress your audience.


 Continue with Email

 Home
Home


