Revenue Table
Financial Crisis Icons Ppt 5
Financial Crisis Icons PPT 5-These high quality powerpoint pre-designed slides and powerpoint templates have been carefully created by our professional team to help you impress your audience. All slides have been created and are 100% editable in powerpoint. Each and every property of any graphic - color, size, orientation, shading, outline etc. can be modified to help you build an effective powerpoint presentation. Any text can be entered at any point in the powerpoint template or slide. Simply DOWNLOAD, TYPE and PRESENT! No end is too far for our Financial Crisis Icons Ppt 5. They ensure your thoughts always arrive.
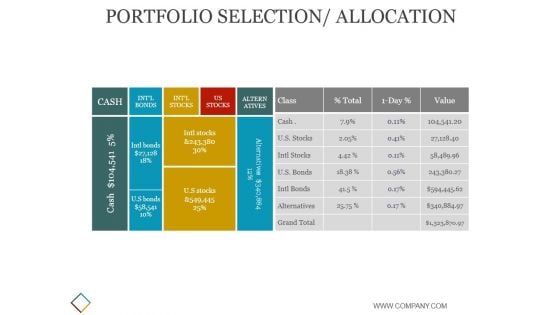
Portfolio Selection Allocation Ppt PowerPoint Presentation Summary
This is a portfolio selection allocation ppt powerpoint presentation summary. This is a four stage process. The stages in this process are business, strategy, marketing, analysis, finance, table.
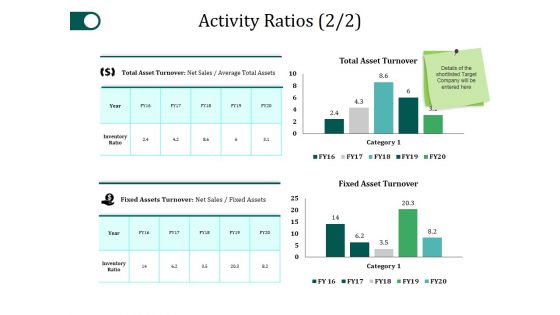
Activity Ratios Template 2 Ppt PowerPoint Presentation File Example File
This is a activity ratios template 2 ppt powerpoint presentation file example file. This is a two stage process. The stages in this process are total asset turnover, fixed asset turnover, category, table, business.
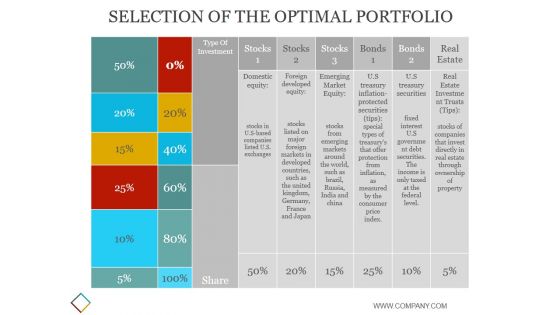
Selection Of The Optimal Portfolio Template Ppt PowerPoint Presentation Outline
This is a selection of the optimal portfolio template ppt powerpoint presentation outline. This is a seven stage process. The stages in this process are business, strategy, marketing, analysis, finance, table.
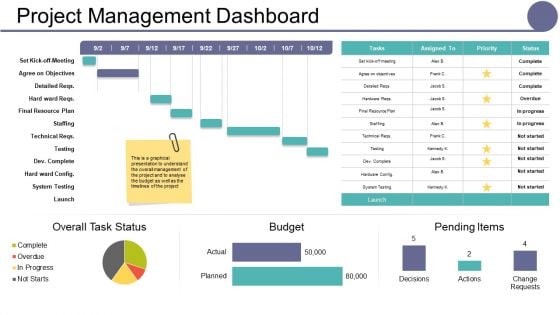
Project Management Dashboard Ppt PowerPoint Presentation Summary Structure
This is a project management dashboard ppt powerpoint presentation summary structure. This is a five stage process. The stages in this process are overall task status, budget, pending items.
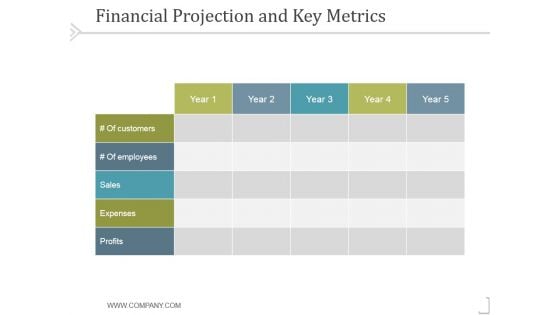
Financial Projection And Key Metrics Ppt PowerPoint Presentation Images
This is a financial projection and key metrics ppt powerpoint presentation images. This is a five stage process. The stages in this process are business, strategy, marketing, success, analysis, table.
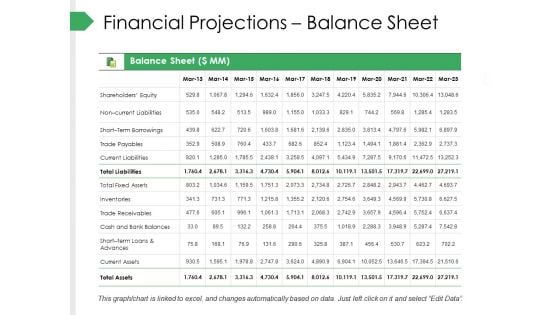
Financial Projections Balance Sheet Ppt PowerPoint Presentation Gallery Clipart Images
This is a financial projections balance sheet ppt powerpoint presentation gallery clipart images. This is a one stage process. The stages in this process are business, marketing, total liabilities, planning, table.

Financial Projections Balance Sheet Ppt PowerPoint Presentation Model Tips
This is a financial projections balance sheet ppt powerpoint presentation model tips. This is a two stage process. The stages in this process are balance sheet, business, marketing, table, shareholders equity.
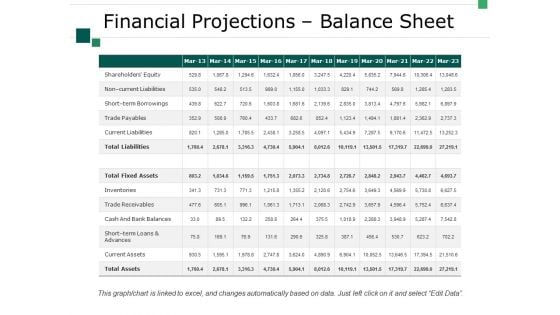
Financial Projections Balance Sheet Ppt PowerPoint Presentation Show Microsoft
This is a financial projections balance sheet ppt powerpoint presentation show microsoft. This is a one stage process. The stages in this process are business, total liabilities, marketing, planning, table.
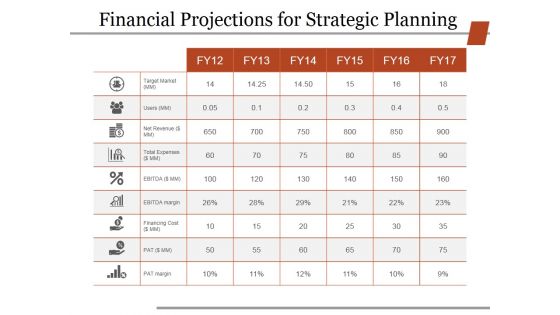
Financial Projections For Strategic Planning Ppt PowerPoint Presentation Infographic Template Deck
This is a financial projections for strategic planning ppt powerpoint presentation infographic template deck. This is a six stage process. The stages in this process are business, strategy, marketing, finance, analysis, table.
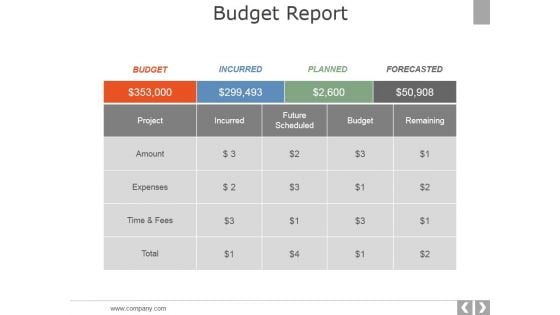
Budget Report Ppt PowerPoint Presentation Outline Examples
This is a budget report ppt powerpoint presentation outline examples. This is a five stage process. The stages in this process are project, amount, expenses, future scheduled, remaining.
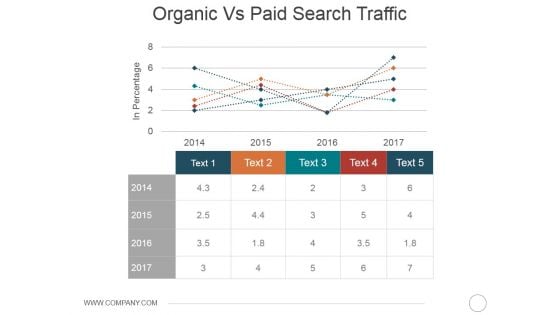
Organic Vs Paid Search Traffic Ppt PowerPoint Presentation Professional Structure
This is a organic vs paid search traffic ppt powerpoint presentation professional structure. This is a two stage process. The stages in this process are business, marketing, strategy, analysis, table.
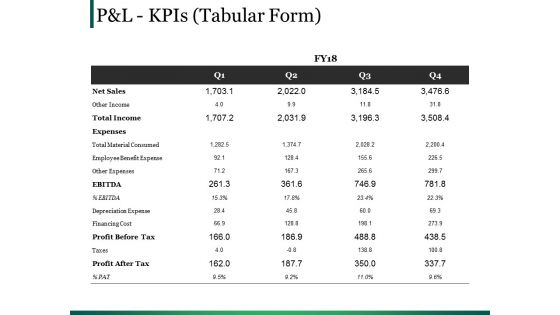
Pandl Kpis Template 1 Ppt PowerPoint Presentation Infographics Tips
This is a pandl kpis template 1 ppt powerpoint presentation infographics tips. This is a four stage process. The stages in this process are ebitda, total income, table, cost, management.
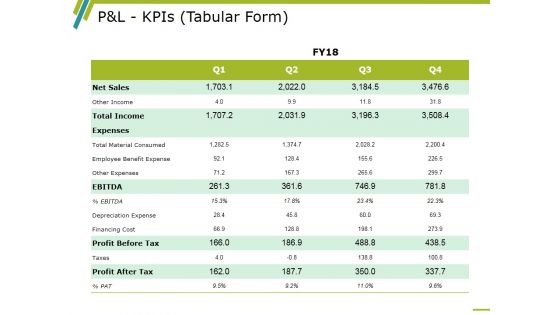
P And L Kpis Template 1 Ppt PowerPoint Presentation Infographics Professional
This is a p and l kpis template 1 ppt powerpoint presentation infographics professional. This is a four stage process. The stages in this process are Other Income, Total Income, Ebitda, Profit Before Tax, Profit After Tax.
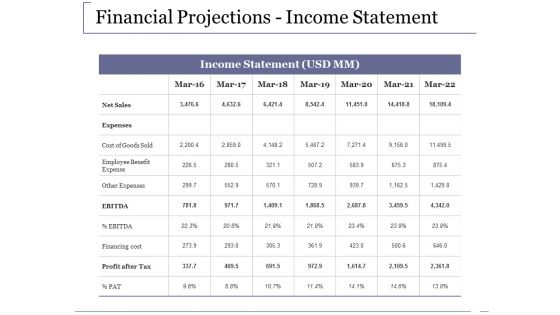
Financial Projections Income Statement Ppt PowerPoint Presentation Inspiration Design Templates
This is a financial projections income statement ppt powerpoint presentation inspiration design templates. This is a seven stage process. The stages in this process are net sales, expenses, cost of goods sold, employee benefit expense, other expenses.
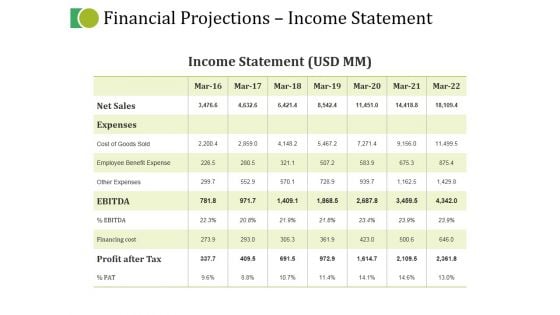
Financial Projections Income Statement Ppt PowerPoint Presentation Portfolio Infographic Template
This is a financial projections income statement ppt powerpoint presentation portfolio infographic template. This is a seven stage process. The stages in this process are trade payables, current liabilities, total liabilities, total fixed assets, inventories.
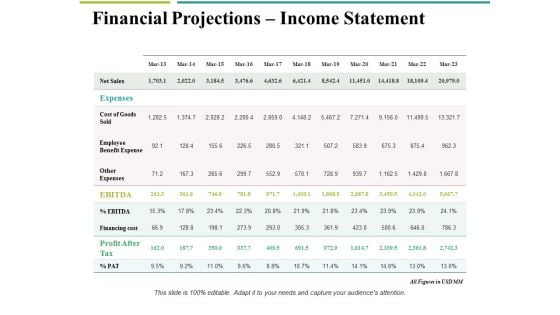
Financial Projections Income Statement Ppt PowerPoint Presentation Outline Designs Download
This is a financial projections income statement ppt powerpoint presentation outline designs download. This is a one stage process. The stages in this process are net sales, expenses, cost of goods sold, employee benefit expense, other expenses.

Financial Projections Income Statement Ppt PowerPoint Presentation Pictures Design Inspiration
This is a financial projections income statement ppt powerpoint presentation pictures design inspiration. This is a one stage process. The stages in this process are business, net sales, expenses, cost of goods sold, employee benefit expense, other expenses, financing cost.
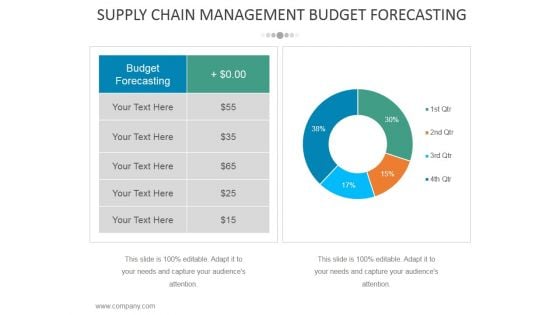
Supply Chain Management Budget Forecasting Ppt PowerPoint Presentation Inspiration Skills
This is a supply chain management budget forecasting ppt powerpoint presentation inspiration skills. This is a two stage process. The stages in this process are business, strategy, marketing, analysis, budget forecasting.

Budgeting Planned Actual Comparison Ppt PowerPoint Presentation Portfolio Information
This is a budgeting planned actual comparison ppt powerpoint presentation portfolio information. This is a three stage process. The stages in this process are planned cost, actual cost, deviation.
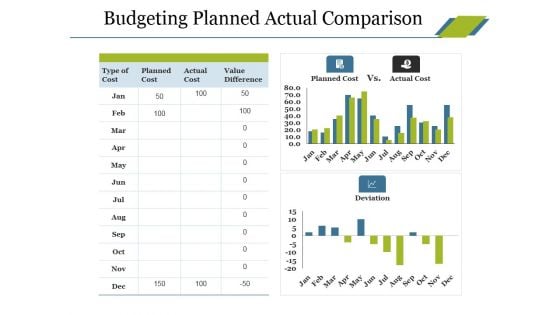
Budgeting Planned Actual Comparison Ppt PowerPoint Presentation Portfolio Display
This is a budgeting planned actual comparison ppt powerpoint presentation portfolio display. This is a three stage process. The stages in this process are type of cost, planned cost, actual cost, deviation, value difference.

Overhead Cost Budget Analysis Ppt PowerPoint Presentation Portfolio Elements
This is a overhead cost budget analysis ppt powerpoint presentation portfolio elements. This is a three stage process. The stages in this process are manufacturing overhead costs, forecast, actual, variance.
Pandl Kpis Tabular Form Ppt PowerPoint Presentation Icon
This is a pandl kpis tabular form ppt powerpoint presentation icon. This is a four stage process. The stages in this process are business, net sales, total income, expenses, profit before tax, profit after tax.
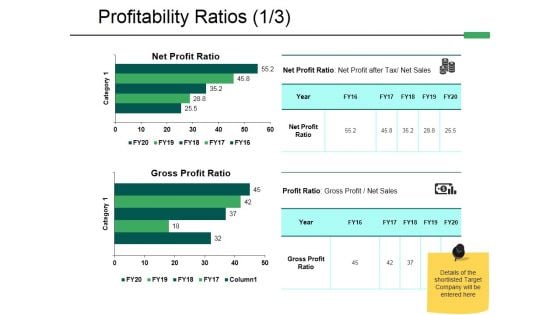
Profitability Ratios Template 1 Ppt PowerPoint Presentation Infographic Template Images
This is a profitability ratios template 1 ppt powerpoint presentation infographic template images. This is a two stage process. The stages in this process are finance, analysis, compere, strategy, business.
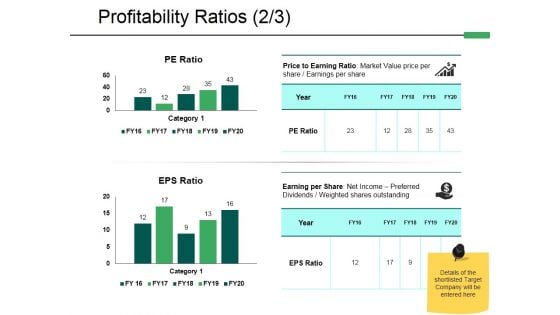
Profitability Ratios Template 2 Ppt PowerPoint Presentation File Graphics
This is a profitability ratios template 2 ppt powerpoint presentation file graphics. This is a two stage process. The stages in this process are finance, analysis, compere, strategy, business.
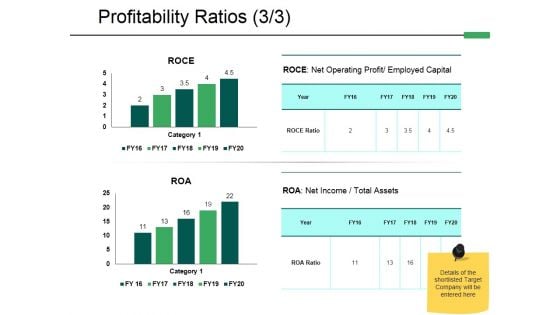
Profitability Ratios Template 3 Ppt PowerPoint Presentation Styles Introduction
This is a profitability ratios template 3 ppt powerpoint presentation styles introduction. This is a two stage process. The stages in this process are finance, analysis, compere, strategy, business.
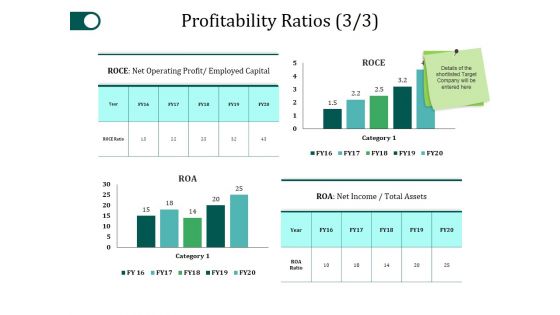
Profitability Ratios Template 3 Ppt PowerPoint Presentation Gallery Slide Portrait
This is a profitability ratios template 3 ppt powerpoint presentation gallery slide portrait. This is a four stage process. The stages in this process are category, roce, net income, business, bar graph.
Financial Summary Ppt PowerPoint Presentation Icon Pictures
This is a financial summary ppt powerpoint presentation icon pictures. This is a seven stage process. The stages in this process are net sales, expenses, ebitda, profit after tax.

Financial Ppt PowerPoint Presentation Infographic Template Graphics
This is a financial ppt powerpoint presentation infographic template graphics. This is a four stage process. The stages in this process are tables, marketing, planning, strategy, finance.
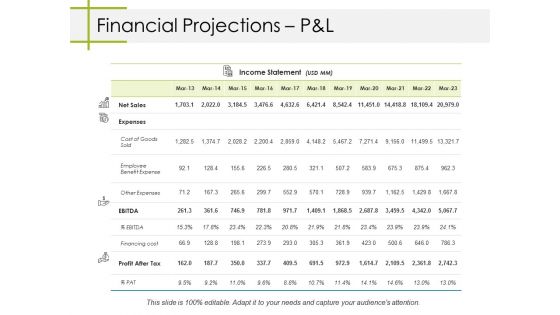
Financial Projections Pandl Ppt PowerPoint Presentation File Example File
This is a financial projections pandl ppt powerpoint presentation file example file. This is a four stage process. The stages in this process are net sales, expenses, ebitda, profit after tax, business.
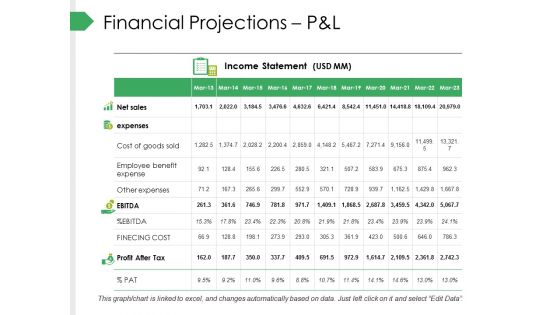
Financial Projections Pandl Ppt PowerPoint Presentation Visual Aids Professional
This is a financial projections pandl ppt powerpoint presentation visual aids professional. This is a four stage process. The stages in this process are net sales, expenses, ebitda, profit after tax, business.
Inflation Rate Template 2 Ppt PowerPoint Presentation Icon Designs
This is a inflation rate template 2 ppt powerpoint presentation icon designs. This is a two stage process. The stages in this process are net sales, other income, taxes, management, business.
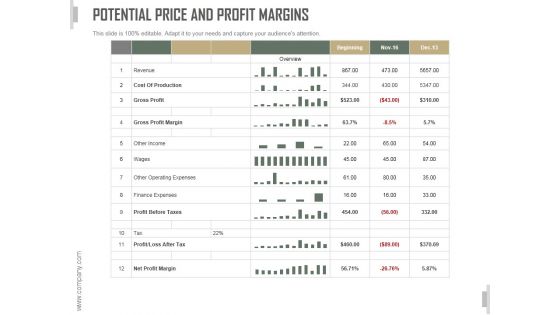
Potential Price And Profit Margins Ppt PowerPoint Presentation Visual Aids
This is a potential price and profit margins ppt powerpoint presentation visual aids. This is a twelve stage process. The stages in this process are gross profit, cost of production, gross profit margin, other income, finance expenses.
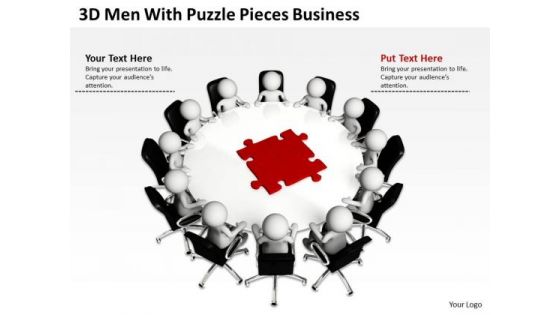
Diagram Business Process Puzzle Pieces PowerPoint Templates Download Slides
We present our diagram business process puzzle pieces powerpoint templates download Slides.Download and present our People PowerPoint Templates because Our PowerPoint Templates and Slides have the Brilliant backdrops. Guaranteed to illuminate the minds of your audience. Download our Business PowerPoint Templates because You can Stir your ideas in the cauldron of our PowerPoint Templates and Slides. Cast a magic spell on your audience. Present our Tables PowerPoint Templates because you should Experience excellence with our PowerPoint Templates and Slides. They will take your breath away. Present our Shapes PowerPoint Templates because You can Channelise the thoughts of your team with our PowerPoint Templates and Slides. Urge them to focus on the goals you have set. Download our Puzzles or Jigsaws PowerPoint Templates because Our PowerPoint Templates and Slides come in all colours, shades and hues. They help highlight every nuance of your views.Use these PowerPoint slides for presentations relating to 3d, alone, answer, business, choice, company, concept, corporate, decision, different, distinctive, element, employee, exception, find, first, game, ground, happy, holding, illustration, important, individuality, jigsaw, leadership, man, manager, many, one, part, partnership, personality, piece, puzzle, render, single, solution, special, strategy, success, team, unique, win. The prominent colors used in the PowerPoint template are Red, White, Black. PowerPoint presentation experts tell us our diagram business process puzzle pieces powerpoint templates download Slides look good visually. Professionals tell us our company PowerPoint templates and PPT Slides are visually appealing. People tell us our diagram business process puzzle pieces powerpoint templates download Slides will generate and maintain the level of interest you desire. They will create the impression you want to imprint on your audience. Presenters tell us our corporate PowerPoint templates and PPT Slides will get their audience's attention. Professionals tell us our diagram business process puzzle pieces powerpoint templates download Slides provide great value for your money. Be assured of finding the best projection to highlight your words. We assure you our decision PowerPoint templates and PPT Slides are visually appealing. Take control of your fate. Determine your destiny with our Diagram Business Process Puzzle Pieces PowerPoint Templates Download Slides.
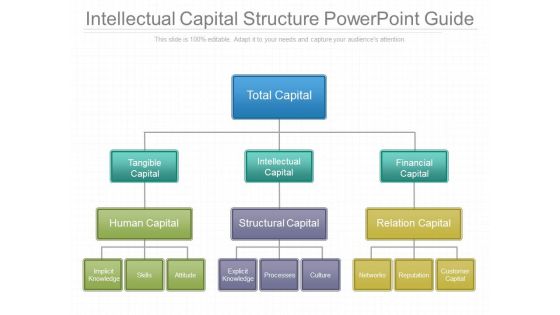
Intellectual Capital Structure Powerpoint Guide
This is a intellectual capital structure powerpoint guide. This is a one stage process. The stages in this process are total capital, tangible capital, intellectual capital, financial capital, human capital, structural capital, relation capital.
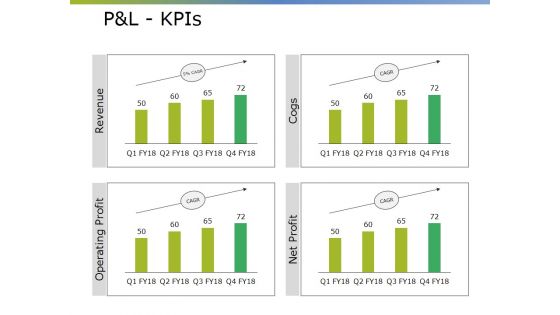
Pandl Kpis Ppt PowerPoint Presentation Gallery Display
This is a pandl kpis ppt powerpoint presentation gallery display. This is a four stage process. The stages in this process are net sales, total income, expenses, ebitda, profit after tax.
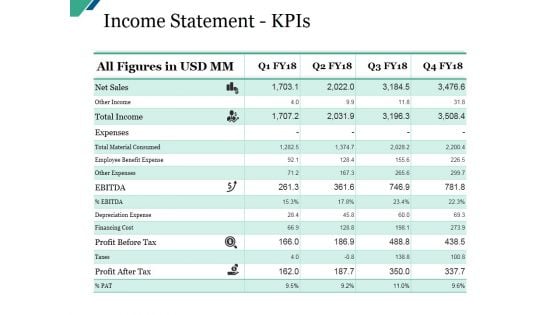
Income Statement Kpis Ppt PowerPoint Presentation Styles Clipart Images
This is a income statement kpis ppt powerpoint presentation styles clipart images. This is a four stage process. The stages in this process are net sales, other income, total income, expenses, total material consumed.
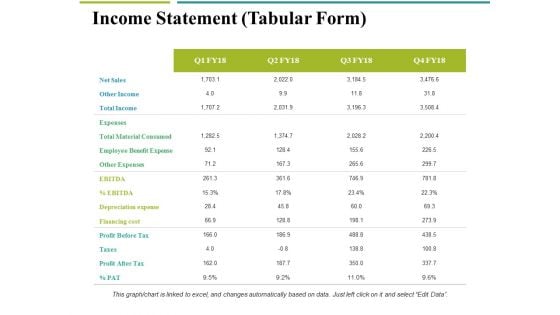
Income Statement Tabular Form Ppt PowerPoint Presentation Inspiration Examples
This is a income statement tabular form ppt powerpoint presentation inspiration examples. This is a four stage process. The stages in this process are net sales, other income, total income, expenses, total material consumed.
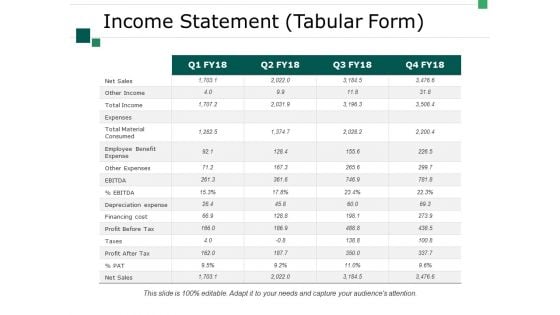
Income Statement Tabular Form Ppt PowerPoint Presentation Model Show
This is a income statement tabular form ppt powerpoint presentation model show. This is a four stage process. The stages in this process are business, marketing, net sales, other income, total income.
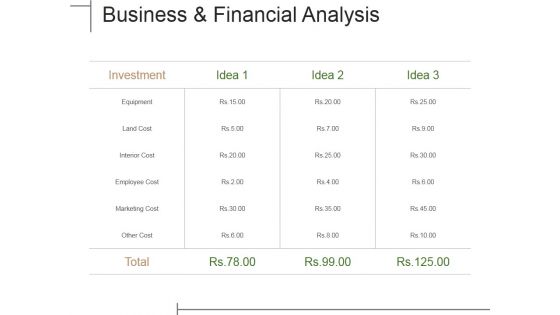
Business And Financial Analysis Ppt PowerPoint Presentation Portfolio Templates
This is a business and financial analysis ppt powerpoint presentation portfolio templates. This is a four stage process. The stages in this process are investment, tables, data analysis, marketing, equipment.
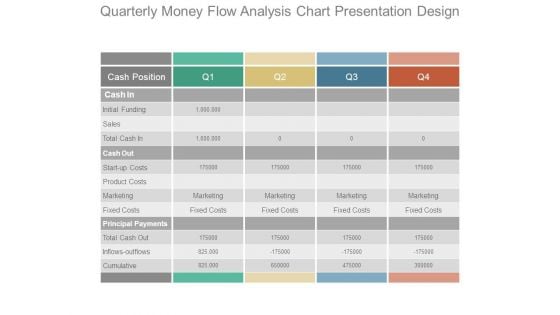
Quarterly Money Flow Analysis Chart Presentation Design
This is a quarterly money flow analysis chart presentation design. This is a four stage process. The stages in this process are cash position, cash in, initial funding, sales, total cash in, cash out, start up costs, product costs, marketing, fixed costs, principal payments, total cash out, inflows outflows, cumulative.
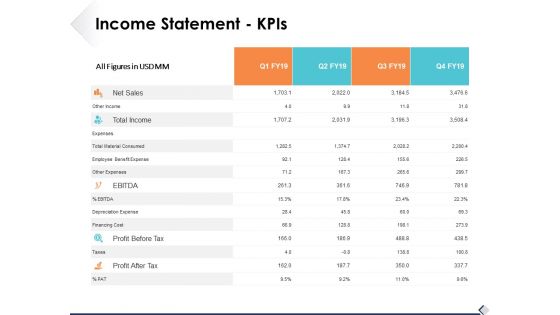
Income Statement Kpis Ppt PowerPoint Presentation Professional Template
This is a income statement kpis ppt powerpoint presentation professional template. This is a four stage process. The stages in this process are business, management, strategy, analysis, icons.
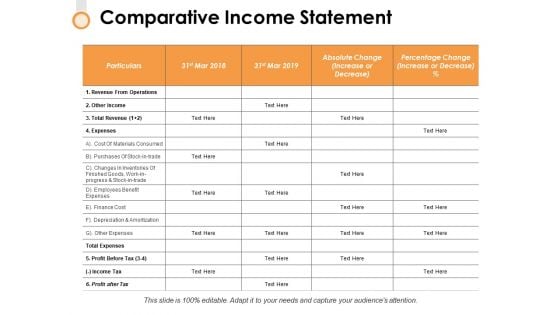
Comparative Income Statement Ppt PowerPoint Presentation Pictures Background Images
This is a comparative income statement ppt powerpoint presentation pictures background images. This is a four stage process. The stages in this process are analysis, strategy, marketing, compare, business.
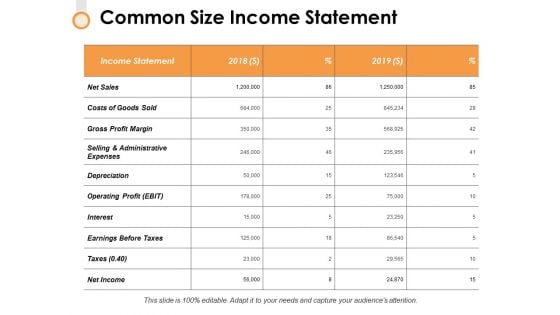
Common Size Income Statement Ppt PowerPoint Presentation File Mockup
This is a common size income statement ppt powerpoint presentation file mockup. This is a two stage process. The stages in this process are business, management, analysis, strategy, marketing.
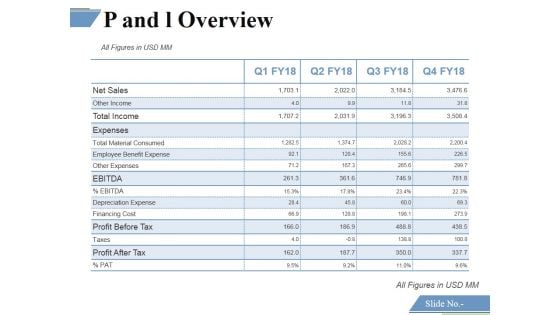
P And L Overview Template 2 Ppt PowerPoint Presentation Model Elements
This is a p and l overview template 2 ppt powerpoint presentation model elements. This is a four stage process. The stages in this process are financing cost, net sales, profit before tax, profit after tax.
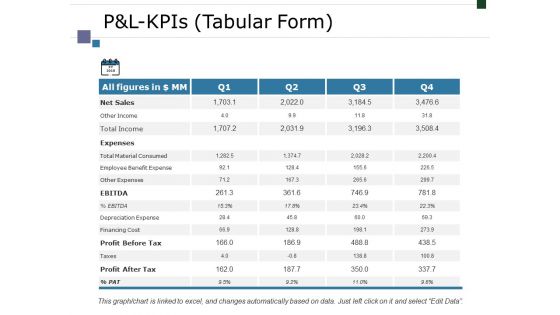
Pandl Kpis Tabular Form Ppt PowerPoint Presentation Outline Background
This is a pandl kpis tabular form ppt powerpoint presentation outline background. This is a four stage process. The stages in this process are net sales, expenses, ebitda, profit before tax, profit after tax.
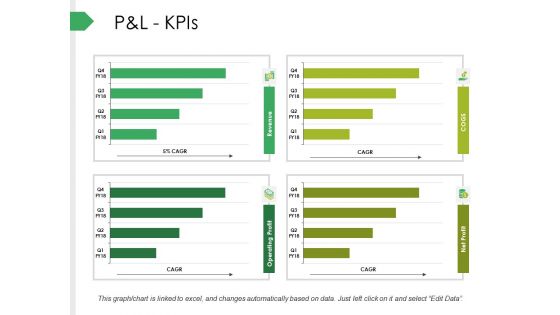
P And L Kpis Ppt PowerPoint Presentation Infographics Background
This is a p and l kpis ppt powerpoint presentation infographics background. This is a four stage process. The stages in this process are net sales, expenses, ebitda, profit before tax, profit after tax.
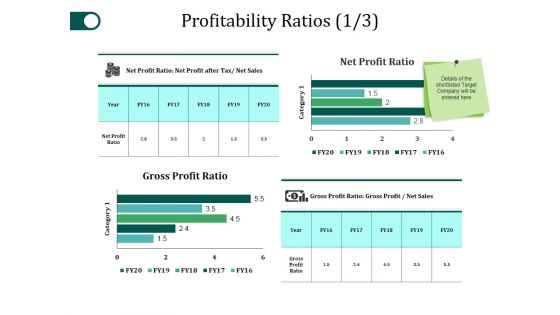
Profitability Ratios Template 1 Ppt PowerPoint Presentation Slides Download
This is a profitability ratios template 1 ppt powerpoint presentation slides download. This is a four stage process. The stages in this process are gross profit ratio, net profit ratio, category, business, marketing.
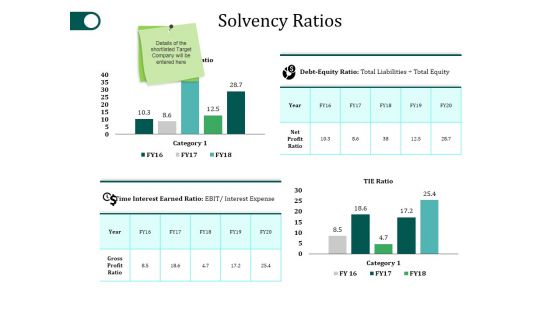
Solvency Ratios Ppt PowerPoint Presentation Layouts Introduction
This is a solvency ratios ppt powerpoint presentation layouts introduction. This is a four stage process. The stages in this process are tie ratio, debt equity ratio, category, time interest earned ratio.
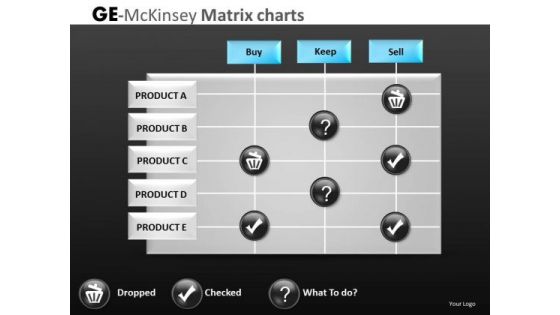
Compare Products Success Profitability PowerPoint Slides
Compare Products Success Profitability PowerPoint Slides-These high quality, editable pre-designed powerpoint slides have been carefully created by our professional team to help you impress your audience. Each graphic in every slide is vector based and is 100% editable in powerpoint. Each and every property of any slide - color, size, shading etc can be modified to build an effective powerpoint presentation. Use these slides to convey complex business concepts in a simplified manner. Any text can be entered at any point in the powerpoint slide. Simply DOWNLOAD, TYPE and PRESENT! Load your gun with our Compare Products Success Profitability PowerPoint Slides. You will come out on top.
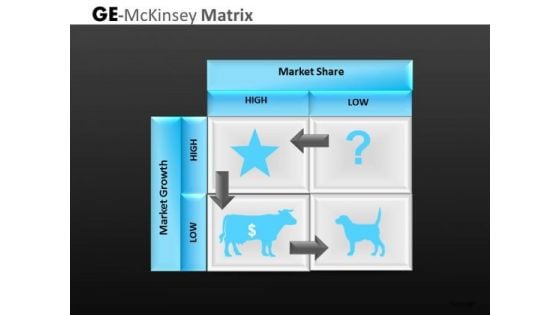
Company Profitability Ge Mckinsey Matrix PowerPoint Templates
Company Profitability GE McKinsey Matrix PowerPoint templates-These high quality, editable pre-designed powerpoint slides have been carefully created by our professional team to help you impress your audience. Each graphic in every slide is vector based and is 100% editable in powerpoint. Each and every property of any slide - color, size, shading etc can be modified to build an effective powerpoint presentation. Use these slides to convey complex business concepts in a simplified manner. Any text can be entered at any point in the powerpoint slide. Simply DOWNLOAD, TYPE and PRESENT! Subscribe to our Company Profitability Ge Mckinsey Matrix PowerPoint Templates and receive success. Be assured of finding the best projection to highlight your words.
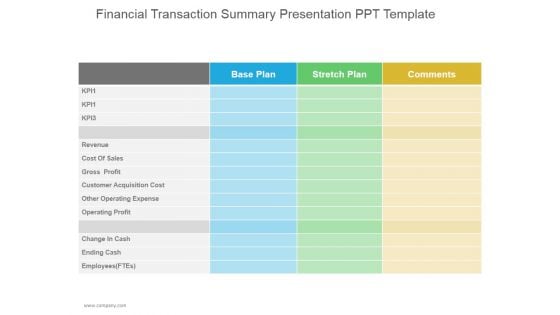
Financial Transaction Summary Ppt PowerPoint Presentation Show
This is a financial transaction summary ppt powerpoint presentation show. This is a three stage process. The stages in this process are cost of sales, gross profit, customer acquisition cost, operating profit, change in cash.
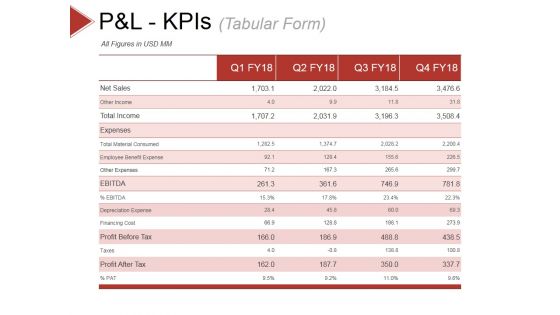
P And L Kpis Template 1 Ppt PowerPoint Presentation Slides Show
This is a p and l kpis template 1 ppt powerpoint presentation slides show. This is a four stage process. The stages in this process are other income, total income, expenses, other expenses, depreciation expense.
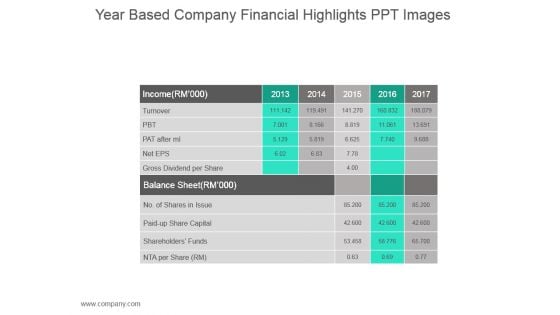
Year Based Company Financial Highlights Ppt Images
This is a year based company financial highlights ppt images. This is a two stage process. The stages in this process are turnover, gross dividend per share, shareholders funds, paid up share capital.
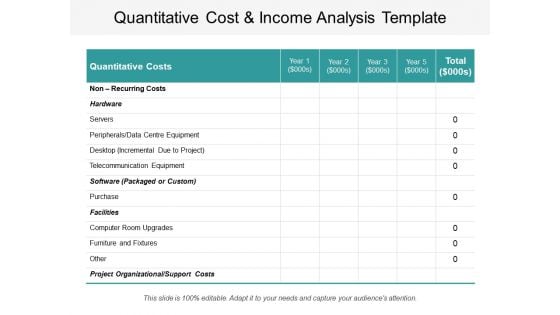
Quantitative Cost And Income Analysis Template Ppt Powerpoint Presentation Professional Demonstration
This is a balance scale with cost and benefits ppt powerpoint presentation show. This is a six stage process. The stages in this process are business, finance, marketing, strategy, compare, management.
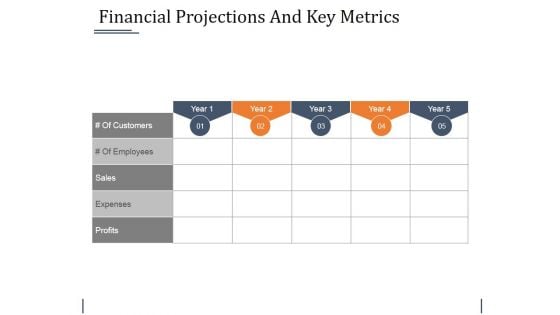
Financial Projections And Key Metrics Ppt PowerPoint Presentation Layouts Objects
This is a financial projections and key metrics ppt powerpoint presentation layouts objects. This is a five stage process. The stages in this process are sales, expenses, profits.
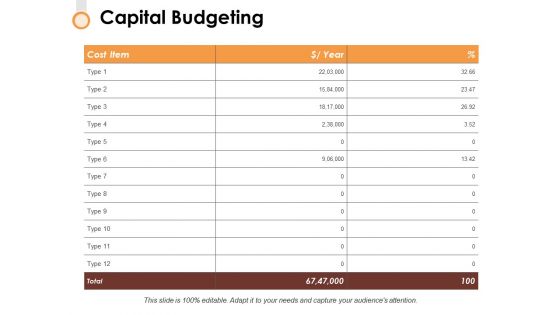
Capital Budgeting Ppt PowerPoint Presentationmodel Brochure
This is a capital budgeting ppt powerpoint presentationmodel brochure. This is a twelve stage process. The stages in this process are analysis, strategy, marketing, compare, business.
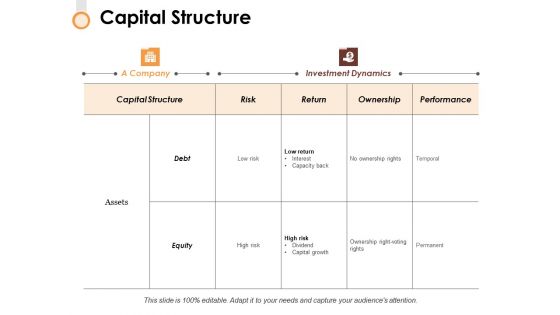
Capital Structure Ppt PowerPoint Presentation Gallery Gridlines
This is a capital structure ppt powerpoint presentation gallery gridlines. This is a two stage process. The stages in this process are compare, icons, analysis, strategy, marketing.
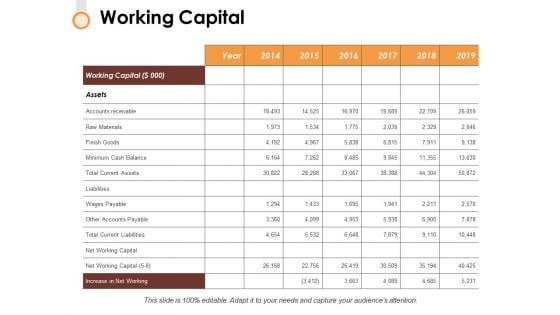
Working Capital Ppt PowerPoint Presentation Inspiration Slides
This is a working capital ppt powerpoint presentation inspiration slides. This is a two stage process. The stages in this process are business, management, analysis, strategy, marketing.
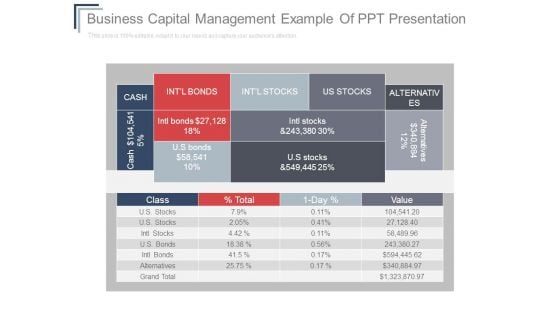
Business Capital Management Example Of Ppt Presentation
This is a business capital management example of ppt presentation. This is a four stage process. The stages in this process are u s stocks, cash, intl stocks, intl bonds, u s bonds, alternatives, class, percentage total, 1 day percentage, value, grand total.


 Continue with Email

 Home
Home


