Revenue
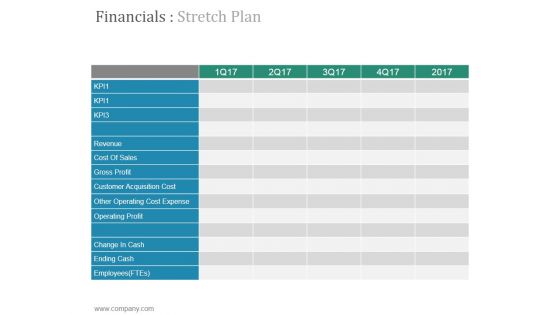
Financials Stretch Plan Ppt PowerPoint Presentation Designs
This is a financials stretch plan ppt powerpoint presentation designs. This is a five stage process. The stages in this process are revenue, cost of sales, gross profit, customer acquisition cost, other operating cost expense.
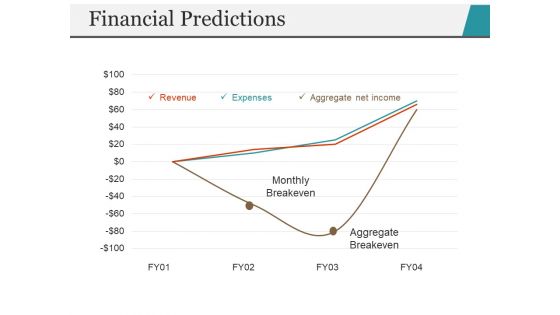
Financial Predictions Template 2 Ppt PowerPoint Presentation Inspiration
This is a financial predictions template 2 ppt powerpoint presentation inspiration. This is a four stage process. The stages in this process are revenue, expenses, aggregate net income, aggregate breakeven, monthly breakeven.
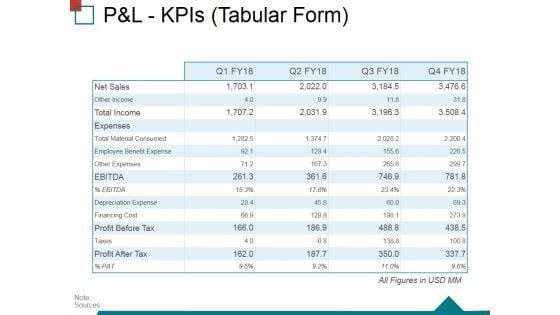
Pandl Kpis Tabular Form Ppt PowerPoint Presentation Ideas Structure
This is a pandl kpis tabular form ppt powerpoint presentation ideas structure. This is a four stage process. The stages in this process are operating profit, revenue, cogs, net profit.
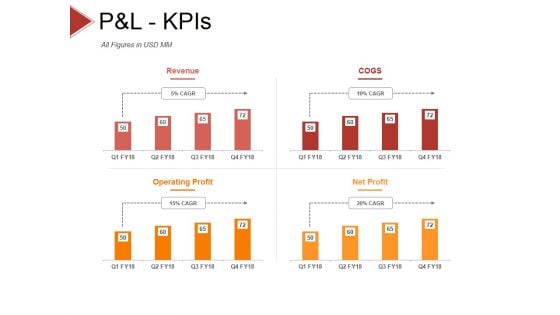
P And L Kpis Template 2 Ppt PowerPoint Presentation Styles Objects
This is a p and l kpis template 2 ppt powerpoint presentation styles objects. This is a four stage process. The stages in this process are revenue, cogs, operating profit, net profit.

P And L Kpis Template 1 Ppt PowerPoint Presentation Model Inspiration
This is a p and l kpis template 1 ppt powerpoint presentation model inspiration. This is a four stage process. The stages in this process are revenue, cogs, operating profit, net profit.
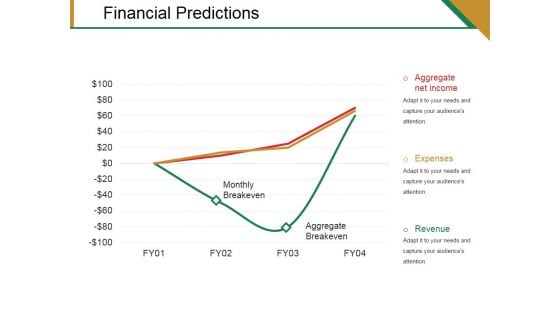
Financial Predictions Template 2 Ppt PowerPoint Presentation Templates
This is a financial predictions template 2 ppt powerpoint presentation templates. This is a three stage process. The stages in this process are monthly breakeven, aggregate breakeven, aggregate net income, expenses, revenue.
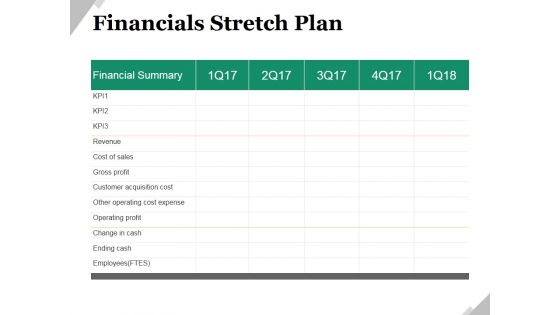
Financials Stretch Plan Ppt PowerPoint Presentation Ideas Shapes
This is a financials stretch plan ppt powerpoint presentation ideas shapes. This is a five stage process. The stages in this process are revenue, cost of sales, gross profit, customer acquisition cost, other operating cost expense, operating profit.
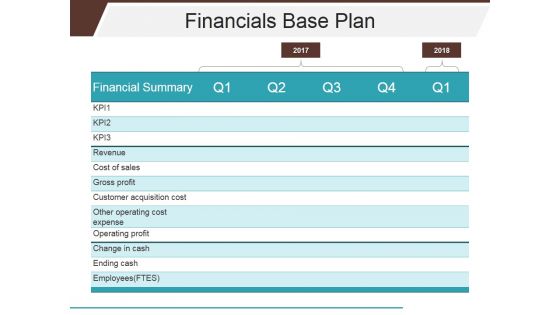
Financials Base Plan Ppt PowerPoint Presentation Styles Clipart Images
This is a financials base plan ppt powerpoint presentation styles clipart images. This is a five stage process. The stages in this process are revenue, cost of sales, gross profit, customer acquisition cost, other operating cost expense, operating profit.
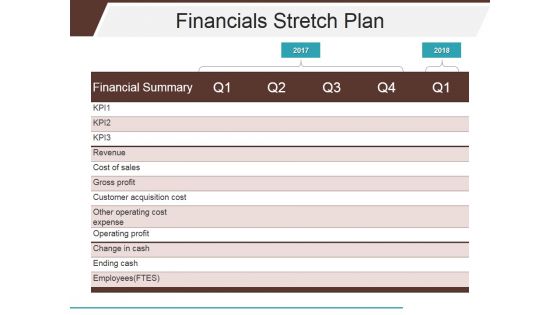
Financials Stretch Plan Ppt PowerPoint Presentation Slides Background Images
This is a financials stretch plan ppt powerpoint presentation slides background images. This is a five stage process. The stages in this process are revenue, cost of sales, gross profit, customer acquisition cost, other operating cost expense, operating profit.
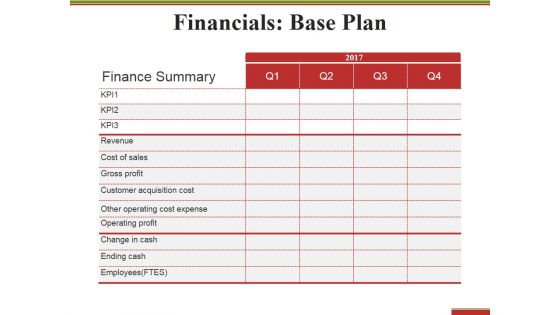
Financials Base Plan Ppt PowerPoint Presentation Styles Graphic Tips
This is a financials base plan ppt powerpoint presentation styles graphic tips. This is a four stage process. The stages in this process are finance summary, revenue, gross profit, operating profit, ending cash.
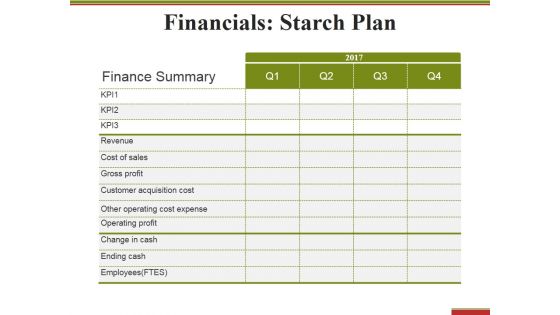
Financials Starch Plan Ppt PowerPoint Presentation Summary Professional
This is a financials starch plan ppt powerpoint presentation summary professional. This is a four stage process. The stages in this process are finance summary, revenue, gross profit, operating profit, ending cash.
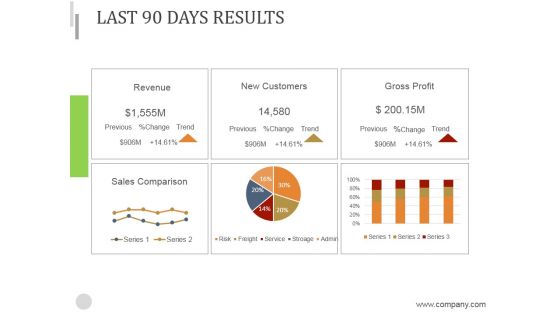
Last 90 Days Results Ppt PowerPoint Presentation Introduction
This is a last 90 days results ppt powerpoint presentation introduction. This is a six stage process. The stages in this process are revenue, new customers, gross profit, sales comparison.
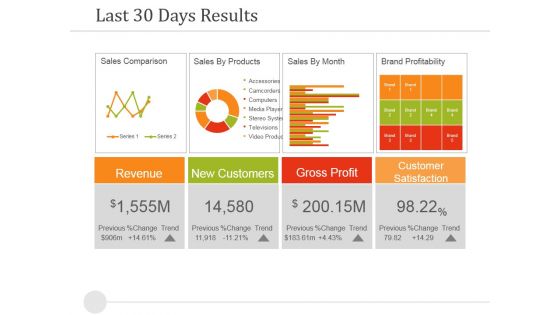
Last 30 Days Results Ppt PowerPoint Presentation Summary Brochure
This is a last 30 days results ppt powerpoint presentation summary brochure. This is a four stage process. The stages in this process are revenue, new customers, gross profit, customer satisfaction.
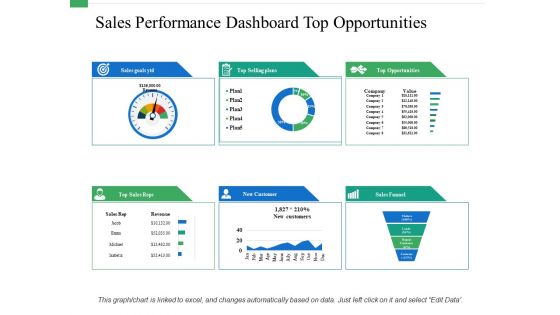
Sales Performance Dashboard Top Opportunities Ppt PowerPoint Presentation Layouts Template
This is a sales performance dashboard top opportunities ppt powerpoint presentation layouts template. This is a eight stage process. The stages in this process are revenue, new customer, gross profit, customer satisfaction, brand profitability.
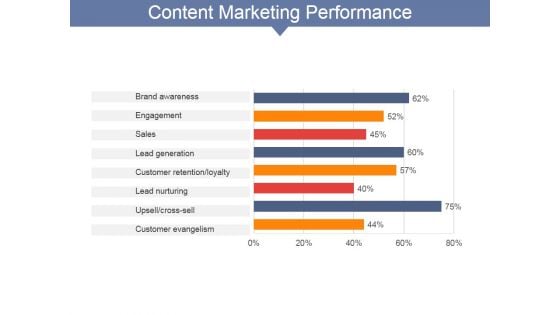
Content Marketing Performance Ppt PowerPoint Presentation Slides Model
This is a content marketing performance ppt powerpoint presentation slides model. This is a eight stage process. The stages in this process are conversion rate, quality of leads, number of leads, sales revenue, website traffic.
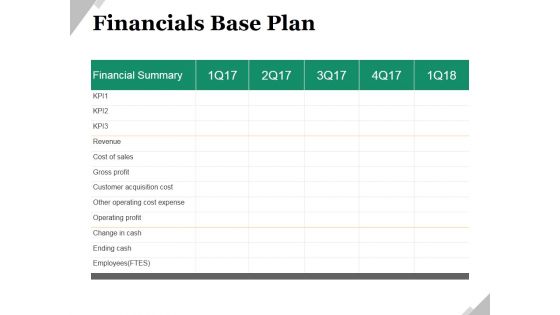
Financials Base Plan Ppt PowerPoint Presentation Model Shapes
This is a financials base plan ppt powerpoint presentation model shapes. This is a five stage process. The stages in this process are financial summary, business, marketing, revenue, cost of sales, gross profit.
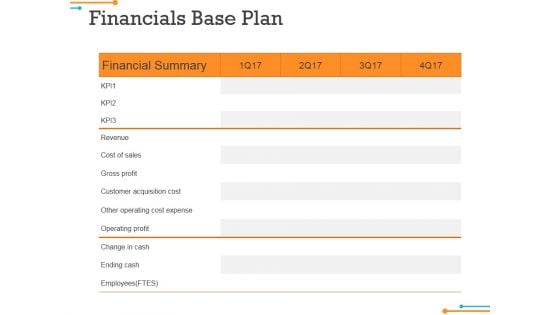
Financials Base Plan Ppt Powerpoint Presentation Slides Design Inspiration
This is a financials base plan ppt powerpoint presentation slides design inspiration. This is a four stage process. The stages in this process are financial summary, revenue, cost of sales, gross profit.
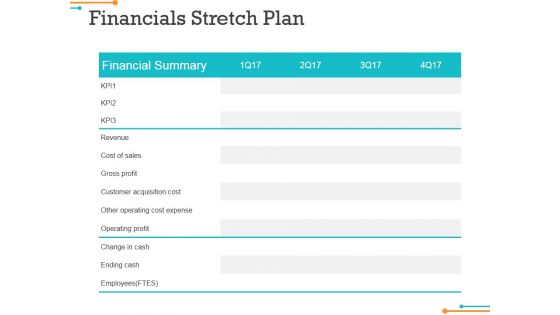
Financials Stretch Plan Ppt Powerpoint Presentation Infographics Background Image
This is a financials stretch plan ppt powerpoint presentation infographics background image. This is a four stage process. The stages in this process are financial summary, revenue, cost of sales, gross profit.
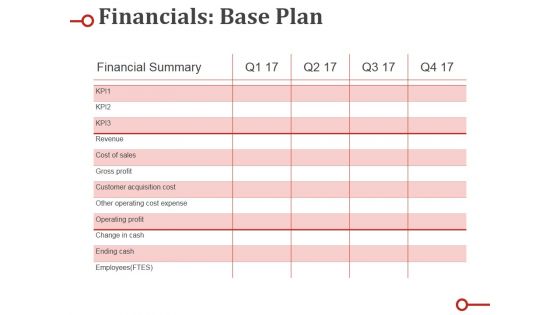
Financials Base Plan Ppt PowerPoint Presentation Portfolio Background Designs
This is a financials base plan ppt powerpoint presentation portfolio background designs. This is a four stage process. The stages in this process are revenue, cost of sales, gross profit, customer acquisition cost, other operating cost expense.
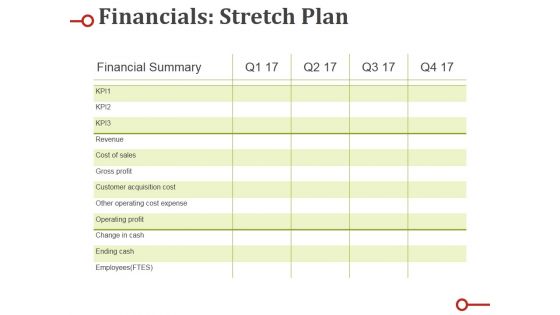
Financials Stretch Plan Ppt PowerPoint Presentation Show Designs Download
This is a financials stretch plan ppt powerpoint presentation show designs download. This is a four stage process. The stages in this process are revenue, cost of sales, gross profit, customer acquisition cost, other operating cost expense.
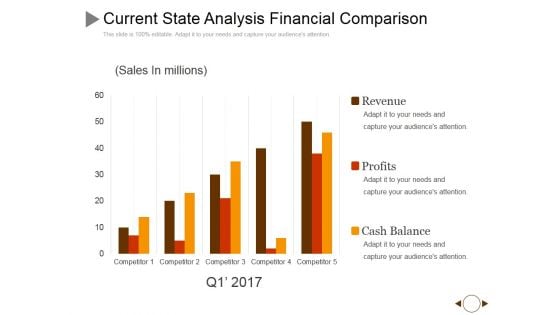
Current State Analysis Financial Comparison Ppt PowerPoint Presentation Inspiration Good
This is a current state analysis financial comparison ppt powerpoint presentation inspiration good. This is a five stage process. The stages in this process are revenue, profits, cash balance, competitor.
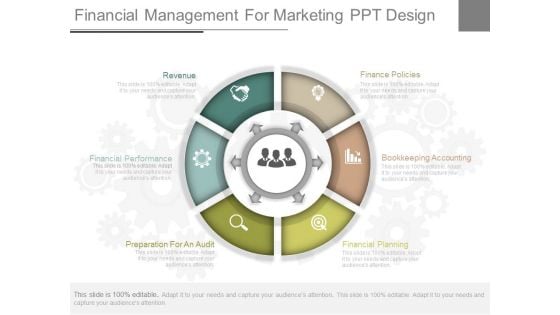
Financial Management For Marketing Ppt Design
This is a financial management for marketing ppt design. This is a six stage process. The stages in this process are finance policies, bookkeeping accounting, financial planning, preparation for an audit, financial performance, revenue.
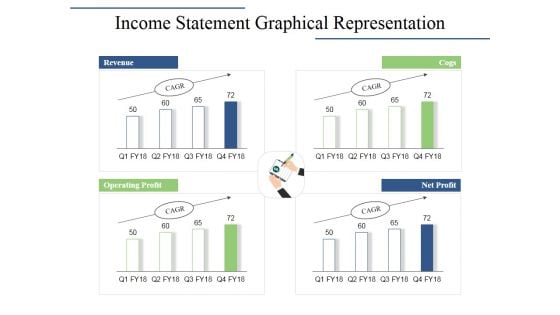
Income Statement Graphical Representation Ppt PowerPoint Presentation Infographics Layouts
This is a income statement graphical representation ppt powerpoint presentation infographics layouts. This is a four stage process. The stages in this process are revenue, cogs, operating profit, net profit.
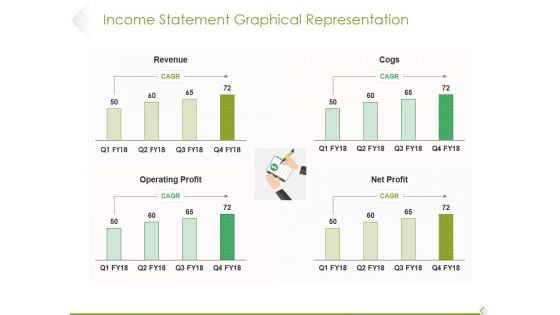
Income Statement Graphical Representation Ppt PowerPoint Presentation Infographic Template Influencers
This is a income statement graphical representation ppt powerpoint presentation infographic template influencers. This is a four stage process. The stages in this process are revenue, cogs, operating profit, profit.
Income Statement Overview Ppt PowerPoint Presentation Infographic Template Icon
This is a income statement overview ppt powerpoint presentation infographic template icon. This is a five stage process. The stages in this process are revenue, profit margin, operating profit margin.
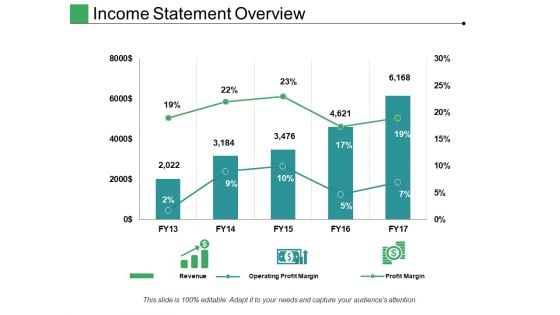
Income Statement Overview Ppt PowerPoint Presentation File Structure
This is a income statement overview ppt powerpoint presentation file structure. This is a five stage process. The stages in this process are revenue, operating profit margin, profit margin.
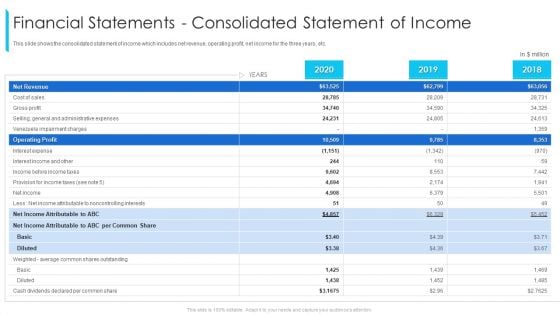
Financial Statements Consolidated Statement Of Income Ppt Infographics Inspiration PDF
This slide shows the consolidated statement of income which includes net revenue, operating profit, net income for the three years, etc. Deliver and pitch your topic in the best possible manner with this financial statements consolidated statement of income ppt infographics inspiration pdf. Use them to share invaluable insights on net revenue, operating profit, gross profit, cost of sales, interest expense and impress your audience. This template can be altered and modified as per your expectations. So, grab it now.
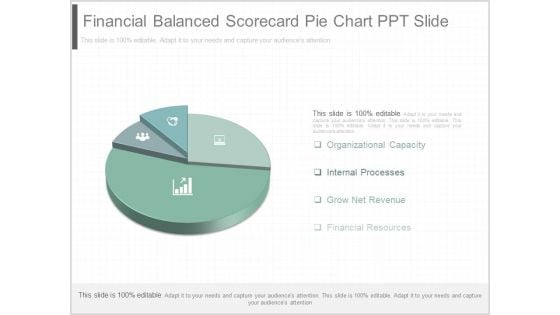
Financial Balanced Scorecard Pie Chart Ppt Slide
This is a financial balanced scorecard pie chart ppt slide. This is a four stage process. The stages in this process are organizational capacity, internal processes, grow net revenue, financial resources.
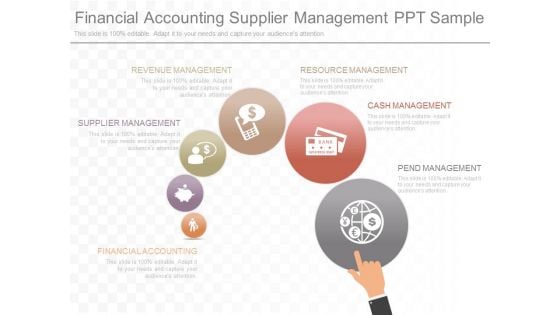
Financial Accounting Supplier Management Ppt Sample
This is a financial accounting supplier management ppt sample. This is a six stage process. The stages in this process are financial accounting, supplier management, revenue, management, resource management, cash management, pend management.
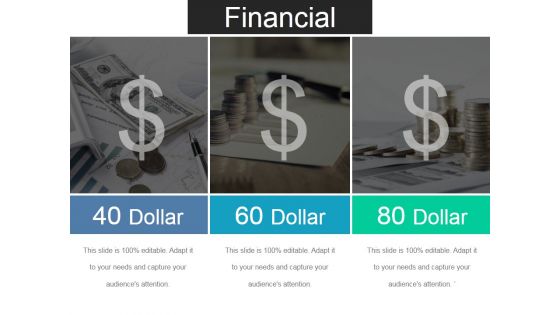
Financial Ppt PowerPoint Presentation Show Graphic Tips
This is a financial ppt powerpoint presentation show graphic tips. This is a six stage process. The stages in this process are target market, users, net revenue, total expenses.
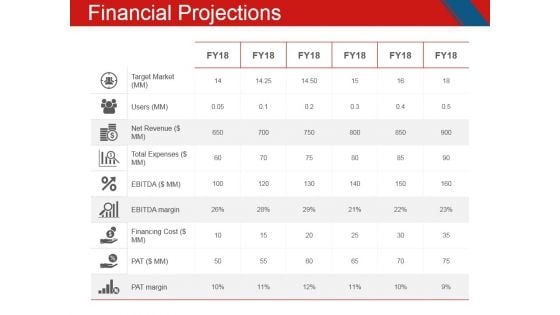
Financial Projections Ppt PowerPoint Presentation Inspiration Deck
This is a financial projections ppt powerpoint presentation inspiration deck. This is a six stage process. The stages in this process are target market, users, net revenue, total expenses, financing cost.
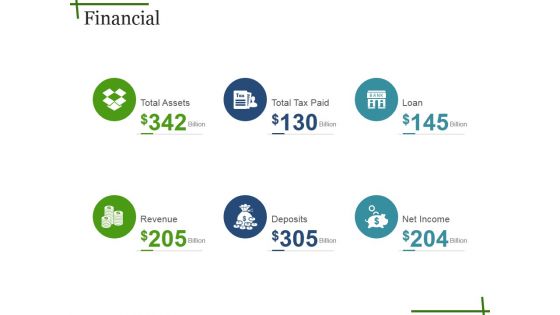
Financial Ppt PowerPoint Presentation Summary Graphics Tutorials
This is a financial ppt powerpoint presentation summary graphics tutorials. This is a six stage process. The stages in this process are target market, users, net revenue, total expenses, ebitda.
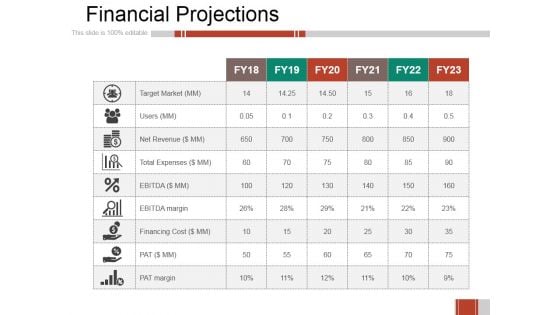
Financial Projections Ppt PowerPoint Presentation Styles Microsoft
This is a financial projections ppt powerpoint presentation styles microsoft. This is a six stage process. The stages in this process are target market, users, net revenue, total expenses, financing cost.
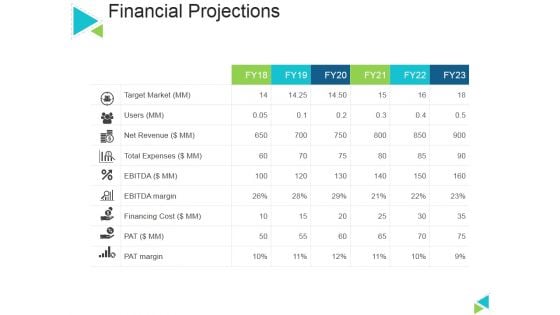
Financial Projections Ppt PowerPoint Presentation Model Diagrams
This is a financial projections ppt powerpoint presentation model diagrams. This is a six stage process. The stages in this process are target market, net revenue, ebitda margin, financing cost, pat margin.
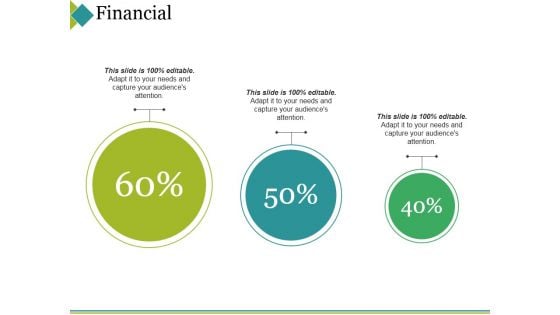
Financial Ppt PowerPoint Presentation Layouts Portrait
This is a financial ppt powerpoint presentation layouts portrait. This is a seven stage process. The stages in this process are target market, users, net revenue, financing cost, total expenses.

Financial Ppt PowerPoint Presentation Pictures Inspiration
This is a financial ppt powerpoint presentation pictures inspiration. This is a six stage process. The stages in this process are target market, users, net revenue, total expenses, pat margin.
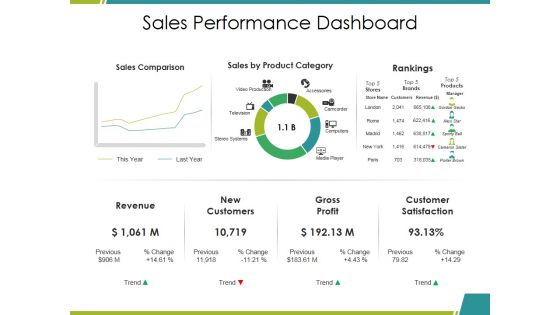
Sales Performance Dashboard Ppt PowerPoint Presentation Infographics Mockup
This is a sales performance dashboard ppt powerpoint presentation infographics mockup. This is a three stage process. The stages in this process are sales comparison, sales by product category, rankings, revenue, gross profit.
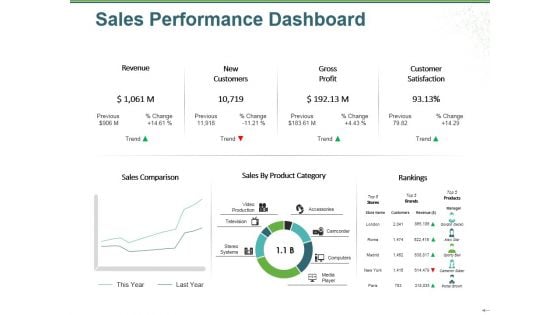
Sales Performance Dashboard Ppt PowerPoint Presentation Outline File Formats
This is a sales performance dashboard ppt powerpoint presentation outline file formats. This is a three stage process. The stages in this process are revenue, new customers, gross profit, customer satisfaction, rankings.
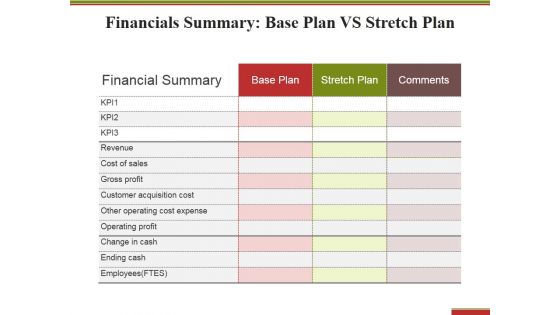
Financials Summary Base Plan Vs Stretch Plan Ppt PowerPoint Presentation File Shapes
This is a financials summary base plan vs stretch plan ppt powerpoint presentation file shapes. This is a three stage process. The stages in this process are finance summary, revenue, gross profit, operating profit, ending cash.
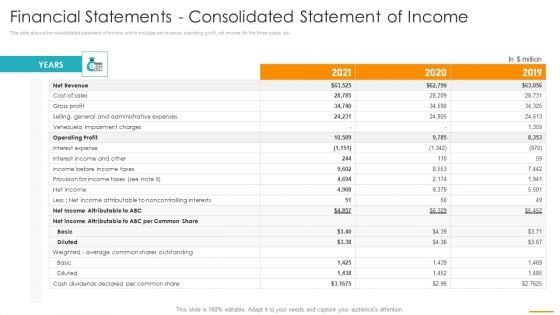
Financial Statements Consolidated Statement Of Income Ppt Portfolio Picture PDF
This slide shows the consolidated statement of income which includes net revenue, operating profit, net income for the three years, etc. Deliver and pitch your topic in the best possible manner with this financial statements consolidated statement of income ppt portfolio picture pdf. Use them to share invaluable insights on net revenue, cost of sales, gross profit and impress your audience. This template can be altered and modified as per your expectations. So, grab it now.
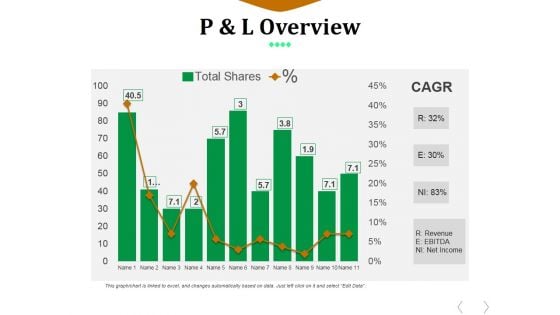
P And L Overview Ppt PowerPoint Presentation Styles Summary
This is a p and l overview ppt powerpoint presentation styles summary. This is a eleven stage process. The stages in this process are revenue, ebitda, net income, total shares.
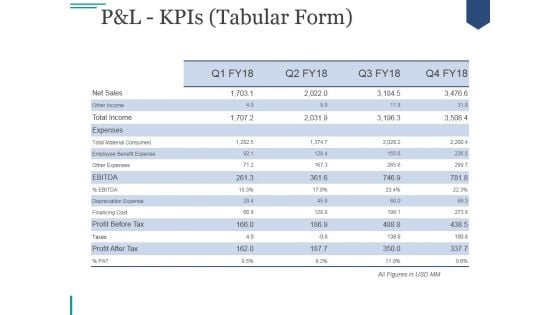
Pandl Kpis Tabular Form Ppt PowerPoint Presentation Visual Aids
This is a pandl kpis tabular form ppt powerpoint presentation visual aids. This is a four stage process. The stages in this process are revenue, cogs, operating profit, net profit.
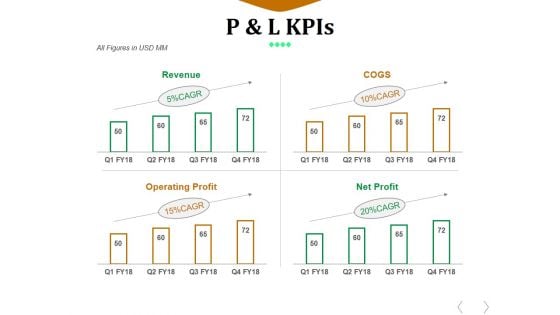
P And L Kpis Template 1 Ppt PowerPoint Presentation Design Ideas
This is a p and l kpis template 1 ppt powerpoint presentation design ideas. This is a four stage process. The stages in this process are revenue, cogs, operating profit, net profit.
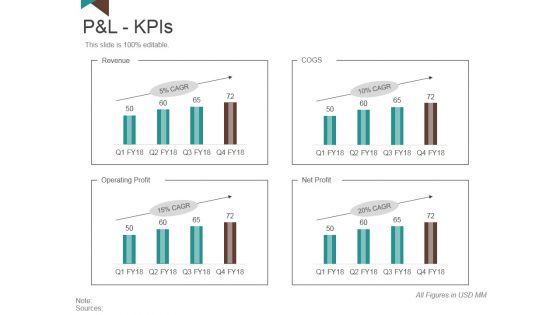
P And L Kpis Template 1 Ppt PowerPoint Presentation Slides Model
This is a p and l kpis template 1 ppt powerpoint presentation slides model. This is a four stage process. The stages in this process are revenue, operating profit, net profit, cogs.
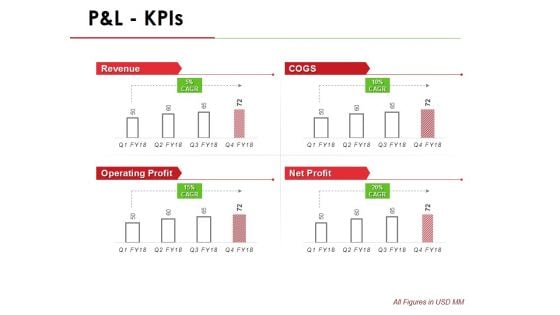
P And L Kpis Template 1 Ppt PowerPoint Presentation Infographic Template Outline
This is a p and l kpis template 1 ppt powerpoint presentation infographic template outline. This is a four stage process. The stages in this process are revenue, operating profit, cogs, net profit.
Pandl Kpis Tabular Form Ppt PowerPoint Presentation Gallery Icon
This is a pandl kpis tabular form ppt powerpoint presentation gallery icon. This is a four stage process. The stages in this process are revenue, cogs, operating profit, net profit.
P And L Kpis Template 2 Ppt PowerPoint Presentation Summary Icon
This is a p and l kpis template 2 ppt powerpoint presentation summary icon. This is a four stage process. The stages in this process are revenue, cogs, operating profit, net profit.
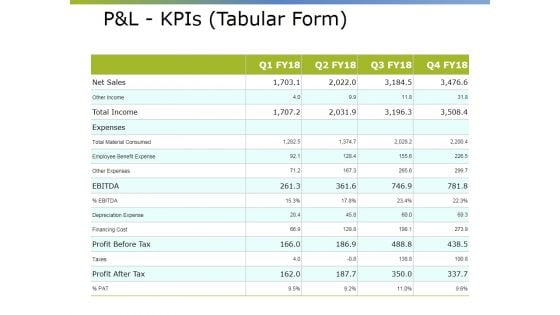
Pandl Kpis Tabular Form Ppt PowerPoint Presentation Pictures Visual Aids
This is a pandl kpis tabular form ppt powerpoint presentation pictures visual aids. This is a four stage process. The stages in this process are revenue, operating profit, cogs, net profit.
Pandl Kpis Template Ppt PowerPoint Presentation Model Icon
This is a pandl kpis template ppt powerpoint presentation model icon. This is a four stage process. The stages in this process are revenue, cogs, operating profit, net profit.
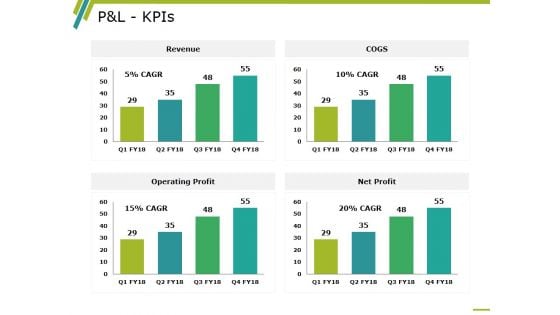
P And L Kpis Template 2 Ppt PowerPoint Presentation Professional Information
This is a p and l kpis template 2 ppt powerpoint presentation professional information. This is a four stage process. The stages in this process are revenue, operating profit, cogs, net profit, business.
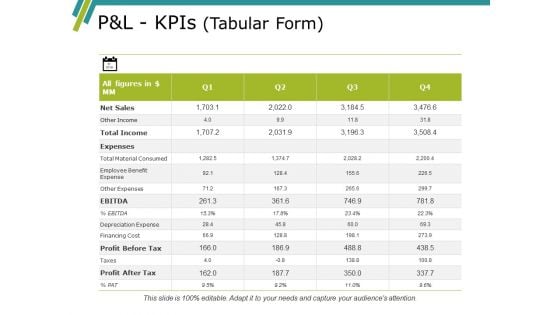
Pandl Kpis Template Ppt PowerPoint Presentation Gallery Summary
This is a pandl kpis template ppt powerpoint presentation gallery summary. This is a four stage process. The stages in this process are revenue, cogs, operating profit, net profit.
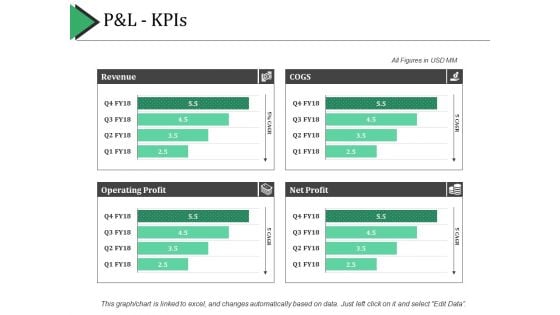
P And L Kpis Ppt PowerPoint Presentation Show Example Introduction
This is a p and l kpis ppt powerpoint presentation show example introduction. This is a four stage process. The stages in this process are revenue, cogs, net profit, operating profit.
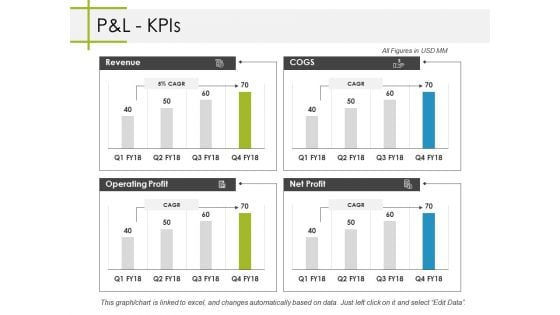
Pandl Kpis Ppt PowerPoint Presentation Professional Backgrounds
This is a pandl kpis ppt powerpoint presentation professional backgrounds. This is a four stage process. The stages in this process are business, revenue, operating profit, cogs, net profit.
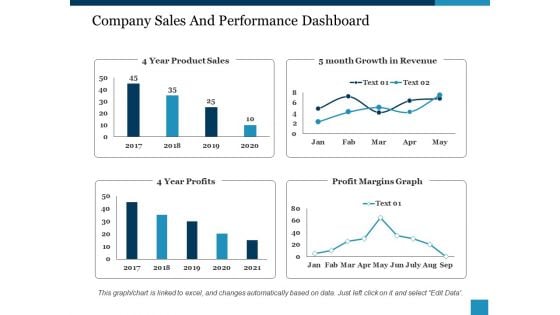
Company Sales And Performance Dashboard Ppt PowerPoint Presentation Show Structure
This is a company sales and performance dashboard ppt powerpoint presentation show structure. This is a four stage process. The stages in this process are year product sales, month growth in revenue, profit margins graph, year profits.
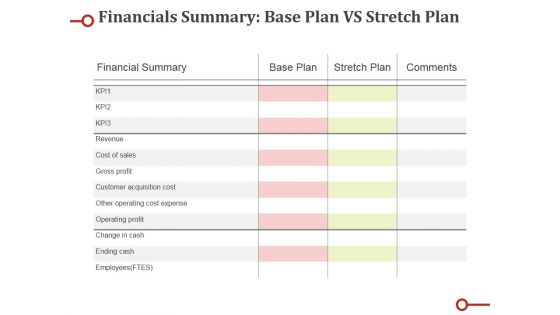
Financials Summary Base Plan Vs Stretch Plan Ppt PowerPoint Presentation Microsoft
This is a financials summary base plan vs stretch plan ppt powerpoint presentation microsoft. This is a three stage process. The stages in this process are revenue, cost of sales, gross profit, customer acquisition cost, other operating cost expense.

Current State Analysis Financial Comparison Ppt Powerpoint Presentation File Graphic Tips
This is a current state analysis financial comparison ppt powerpoint presentation file graphic tips. This is a five stage process. The stages in this process are revenue, profits, cash balance.
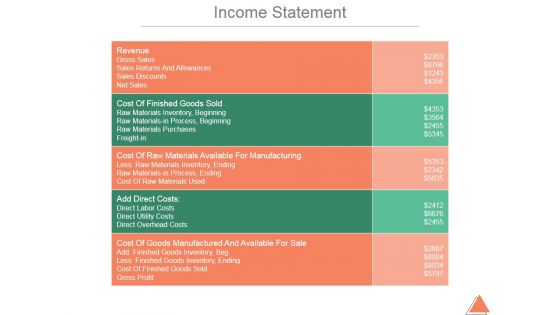
Income Statement Ppt PowerPoint Presentation Background Images
This is a income statement ppt powerpoint presentation background images. This is a five stage process. The stages in this process are revenue, gross sales, sales returns and allowances, sales discounts, net sales.
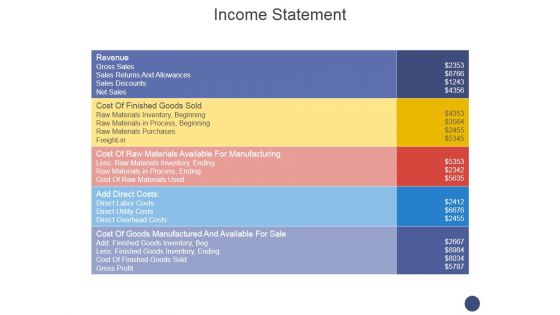
Income Statement Ppt PowerPoint Presentation Model Background
This is a income statement ppt powerpoint presentation model background. This is a five stage process. The stages in this process are revenue, gross sales, net sales, sales discounts, freight in.
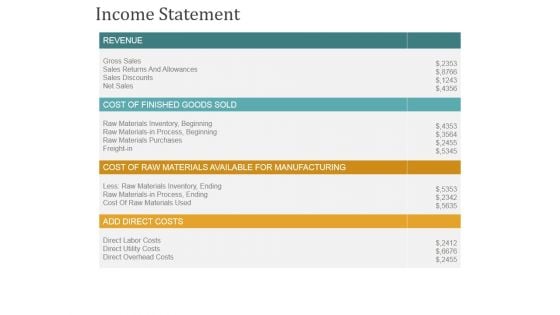
Income Statement Ppt PowerPoint Presentation Model Slide
This is a income statement ppt powerpoint presentation model slide. This is a four stage process. The stages in this process are revenue, cost of finished goods sold, add direct costs.
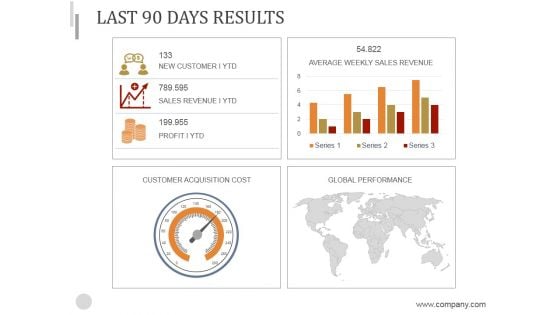
Last 90 Days Results Ppt PowerPoint Presentation Background Image
This is a last 90 days results ppt powerpoint presentation background image. This is a four stage process. The stages in this process are customer acquisition cost, global performance, average weekly sales revenue.


 Continue with Email

 Home
Home


