Revenue
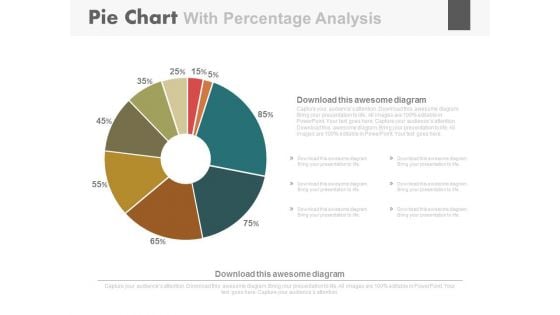
Pie Chart For Strategic Sales Plan Powerpoint Slides
This PowerPoint template has been designed with diagram of pie chart. This PPT slide can be used to prepare presentations on strategic sales plan. You can download finance PowerPoint template to prepare awesome presentations.
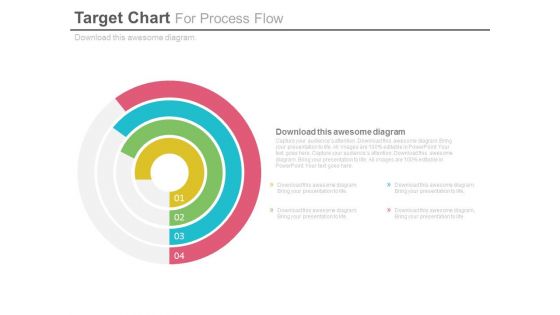
Target Chart For Strategic Management Process Powerpoint Slides
This PowerPoint template has been designed with four steps target chart. The PowerPoint template may be used to display strategic management process. You can download this PowerPoint slide for corporate presentations or annual meeting and business plans.
Tree Diagram For Green Environment Powerpoint Slides
This PowerPoint template has been designed with tree diagram. This PPT slide can be used to prepare presentations on green environment related topics. You can download unique PowerPoint template to prepare awesome presentations.
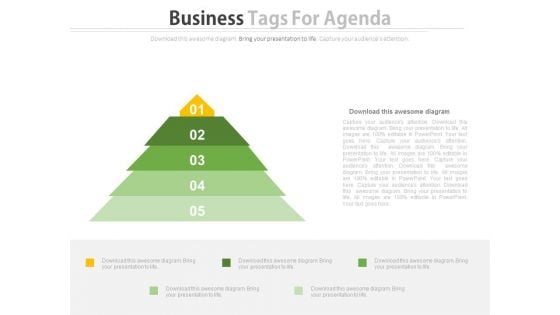
Triangle Of Five Business Steps Powerpoint Slides
This PowerPoint template has been designed with five steps triangle diagram. This PPT slide can be used to display five points of marketing agenda. You can download finance PowerPoint template to prepare awesome presentations.
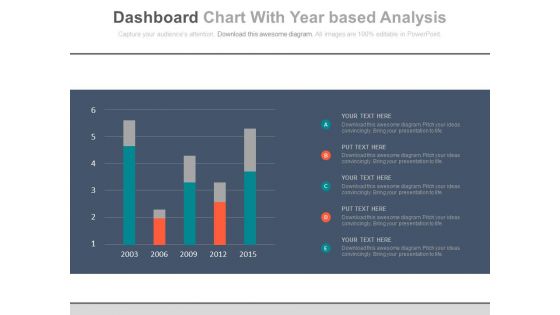
Bar Graph For Year Based Analysis Powerpoint Slides
This PowerPoint template has been designed with year based bar graph. This diagram may be used to display yearly statistical analysis. Use this PPT slide design to make impressive presentations.
Business Steps Diagram With Icons Powerpoint Slides
Visually support your presentation with our above template containing graphics of stairs diagram. It helps to portray directions of business actions. Etch your views in the brains of your audience with this diagram slide.
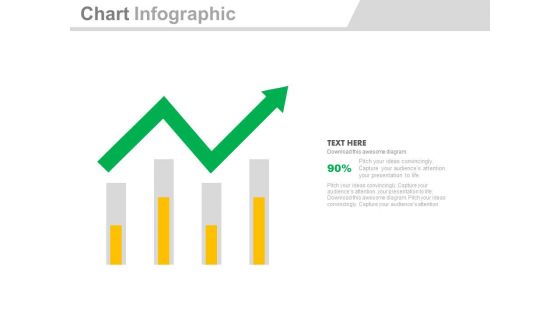
Four Bars With Green Growth Arrow Powerpoint Slides
Four bars with green arrow have been displayed in this business slide. This business diagram helps to exhibit process of business planning. Use this diagram to build an exclusive presentation.

Four Circles With Percentage Data Display Powerpoint Slides
This PowerPoint template has been designed with graphics of four circles. Download this PPT slide to display percentage data display. Use this professional template to build an exclusive presentation.
Four Colored Text Boxes With Icons Powerpoint Slides
This PowerPoint template has been designed with graphics of four text boxes. Download this PPT slide to display percentage data display. Use this professional template to build an exclusive presentation.
Four Linear Steps And Icons Powerpoint Slides
This PPT slide has been designed with four linear text boxes with icons. This PowerPoint template helps to exhibit process of business planning. Use this diagram slide to build an exclusive presentation.
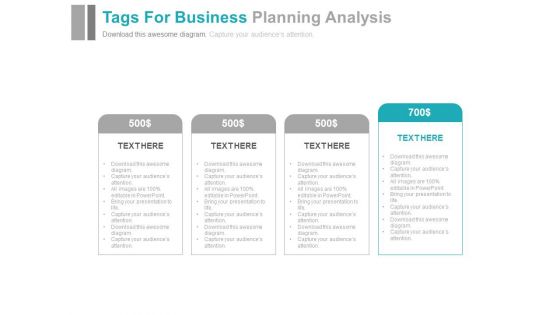
Four Steps For Organizational Learning Methods Powerpoint Slides
Four text boxes have been displayed in this business slide. This PowerPoint template helps to exhibit organizational learning methods. Use this diagram slide to build an exclusive presentation.
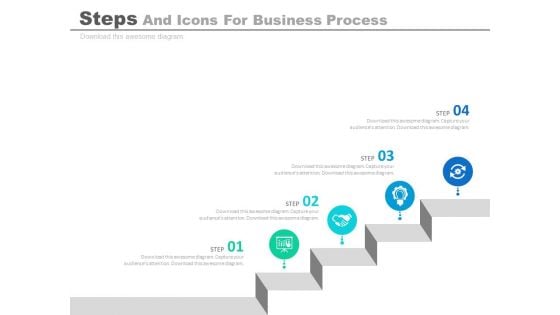
Infographic Diagram For Business Process Analysis Powerpoint Slides
This PowerPoint slide contains business infographic diagram. This professional slide may be used to display business process analysis. Use this business template to make impressive presentations.
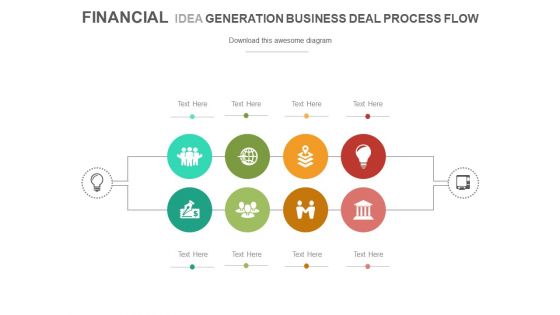
Process Flow Diagram With Business Icons Powerpoint Slides
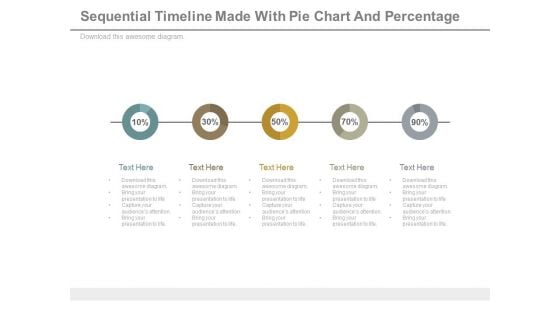
Sequential Timeline Diagram With Percentage Values Powerpoint Slides
This diagram contains graphics of linear circles timeline diagram. Download this diagram slide to display business planning and management. This diagram is editable you can edit text, color, shade and style as per you need.
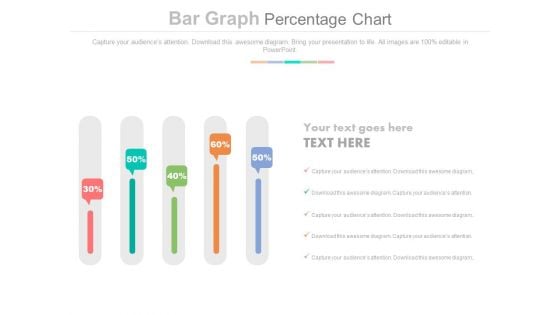
Sliders Percentage Data Chart Powerpoint Slides
This PowerPoint slide has been designed with slider chart and percentage data. This PPT diagram may be used to display business trends. This diagram slide can be used to make impressive presentations.
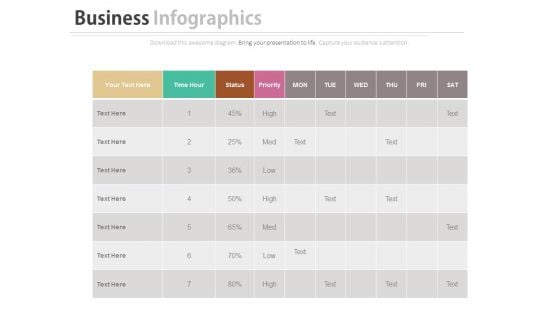
Work Sheet For Daily Activity Plan Schedule Powerpoint Slides
Our above business slide contains graphics of daily worksheet. This PowerPoint slide may be used to exhibit activity plan and schedule. Capture the attention of your audience with this slide.
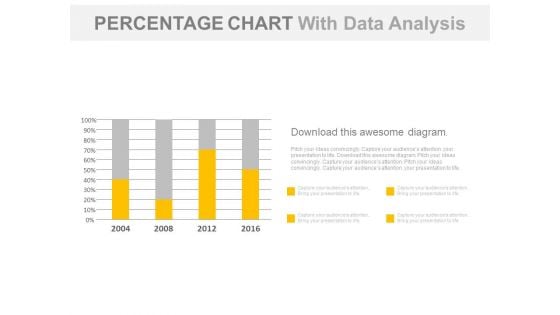
Year Based Chart With Percentage Data Analysis Powerpoint Slides
Our above business slide contains year based statistical chart. This PowerPoint template can be used to display percentage data analysis. Capture the attention of your audience with this slide.
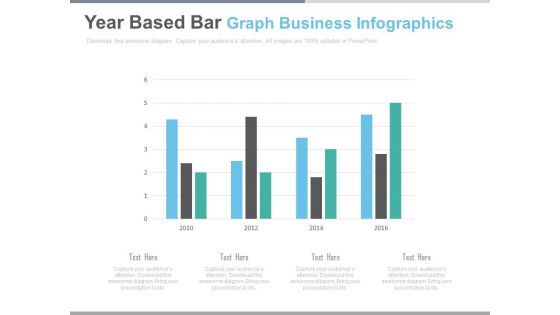
Bar Graph For Yearly Statistical Analysis Powerpoint Slides
This PowerPoint template has been designed with bar graph. This PowerPoint diagram is useful to exhibit yearly statistical analysis. This diagram slide can be used to make impressive presentations.
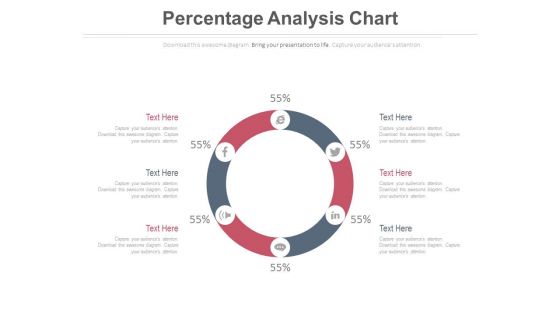
Circular Diagram For Percentage Analysis Powerpoint Slides
This PowerPoint slide has been designed with circular diagram with social media icons. This diagram slide may be used to display users of social media. Prove the viability of your ideas with this professional slide.
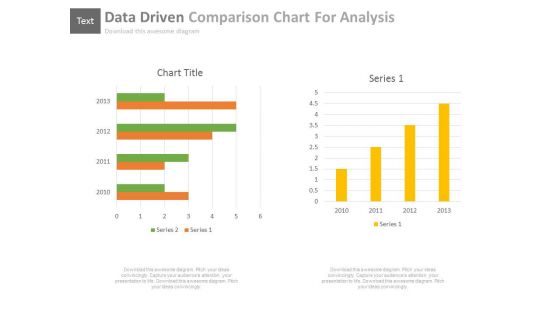
Data Driven Comparison Charts For Analysis Powerpoint Slides
You can download this PowerPoint template to display statistical data and analysis. This PPT slide contains data driven comparison charts. Draw an innovative business idea using this professional diagram.
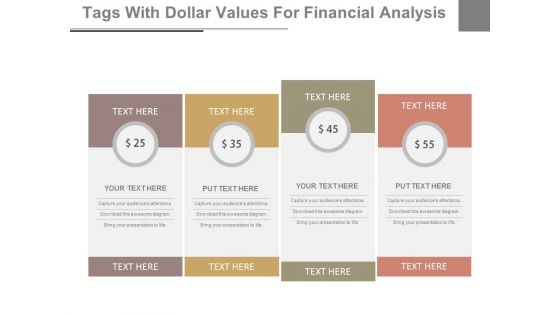
Dollar Value Pricing Table Powerpoint Slides
This PowerPoint template has been designed with dollar value pricing table chart. This PPT slide may be used for sample marketing proposal. Download this slide to build unique presentation.
Five Linear Circles And Icons For Technology Powerpoint Slides
This PowerPoint template has been designed with five linear circles and icons. This professional PPT slide is suitable to present technology growth steps. Capture the attention of your audience using this professional slide.
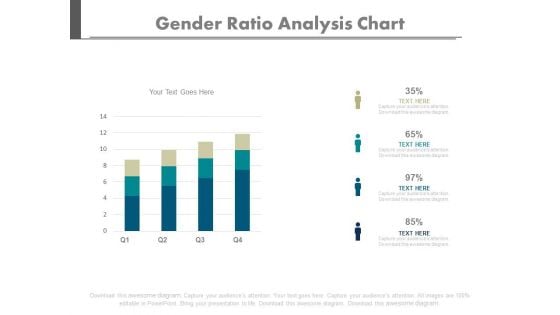
Four Bars Gender Population Ratio Chart Powerpoint Slides
Create dynamic presentations with our creative template of bar graph. This diagram may be used to present gender population. Download this template to leave permanent impression on your audience.
Four Clouds With Arrows And Icons Powerpoint Slides
This business slide displays diagram of four clouds with arrow and icons. Download this PowerPoint diagram to display technology development and management. Enlighten your audience with your breathtaking ideas.
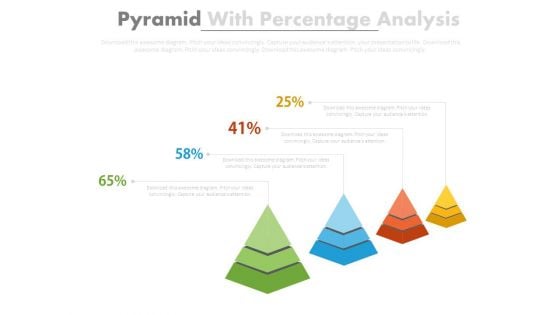
Four Pyramids With Growth Steps Powerpoint Slides
This business slide has been designed with four pyramids. This PowerPoint template may use to display sales growth and analysis. Prove the viability of your ideas using this impressive slide.
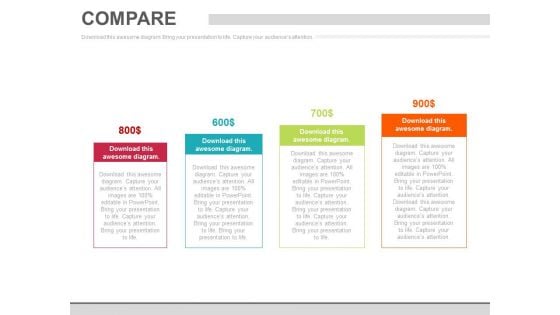
Four Steps Pricing Option Chart Powerpoint Slides
This PowerPoint template has been designed with dollar value pricing table chart. This PPT slide may be used for sample marketing proposal. Download this slide to build unique presentation.
Four Steps Pricing Table With Icons Powerpoint Slides
This PowerPoint template has been designed with dollar value pricing table chart. This PPT slide may be used for sample marketing proposal. Download this slide to build unique presentation.
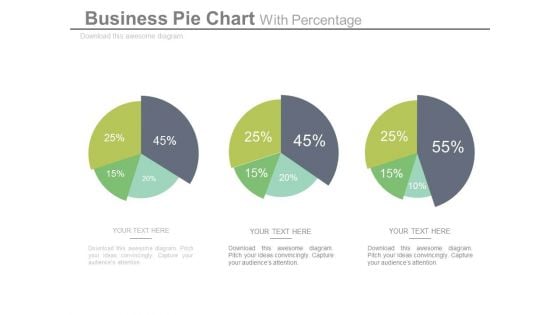
Pie Charts For Relative Comparison Study Powerpoint Slides
This power point template illustrates diagram of three pie charts with percentage values. This business slide can be used for relative comparison study. Present your views and ideas with this impressive slide.
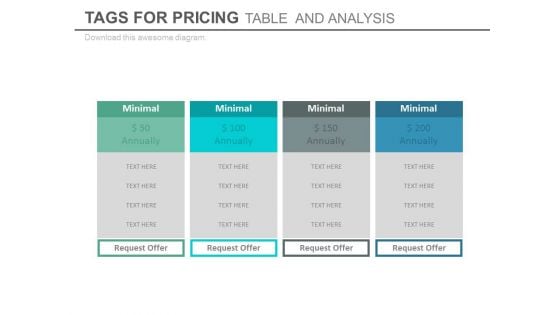
Pricing Comparison Table For Analysis Powerpoint Slides
This PowerPoint template has been designed with pricing comparison table. This PowerPoint template may be used to present pricing strategy. Prove the viability of your ideas using this impressive slide.
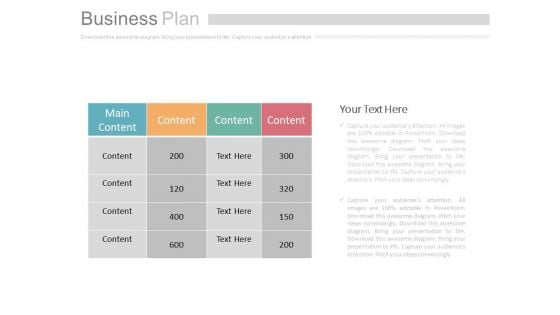
Table Chart For Business Plan Powerpoint Slides
Table chart has been used to design this power point template. This diagram may be used to display business plan. Download this template to leave permanent impression on your audience.
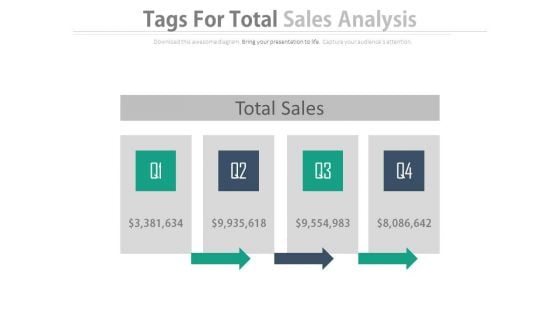
Table For Total Sales Analysis Powerpoint Slides
This PowerPoint template has been designed with four steps table chart. Use this PPT slide to display total sales analysis. Download this template to leave permanent impression on your audience.

Tap With Water Drops Diagram Powerpoint Slides
This PowerPoint template has been designed with graphics of tap with water drops. Download this business diagram to display save water concept. Present your views and ideas with this impressive design.
Text Tags And Icons With Percentage Values Powerpoint Slides
This PowerPoint template has been designed with graphics of text tags, icons and percentage values. Download this business diagram to outline business plan. Present your views and ideas with this impressive design.
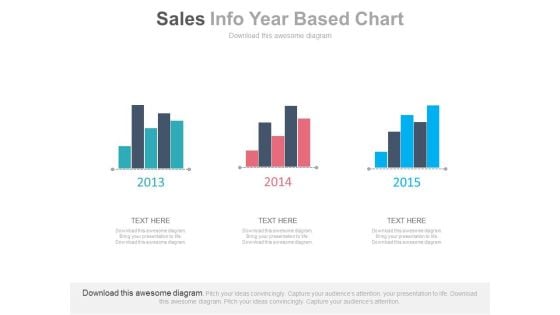
Three Years Sales Data Bar Graph Powerpoint Slides
This PowerPoint template has been designed with bar charts. This business slide may be used to display three years sales data for comparison. Present your views and ideas with this impressive design.
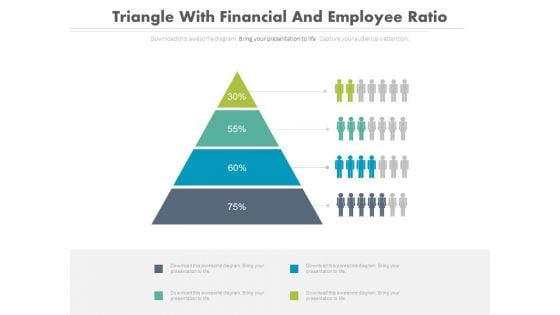
Triangle For Teams Performance Analysis Powerpoint Slides
This PPT slide displays graphics of triangle diagram with teams icons. Download this PowerPoint template for teams performances analysis. Use this PowerPoint template to emphasize your views.
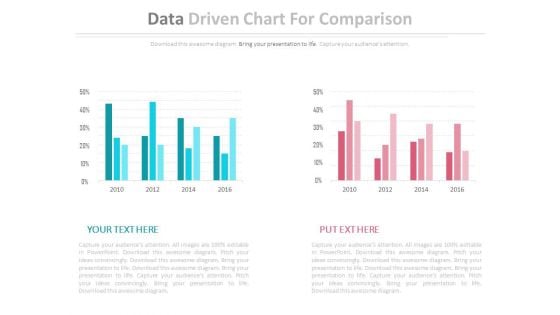
Two Data Driven Comparison Charts Powerpoint Slides
This PowerPoint template contains diagram of two data driven charts. You may use this PPT slide to depict strategic analysis for business. The color coding of this template is specifically designed to highlight you points.
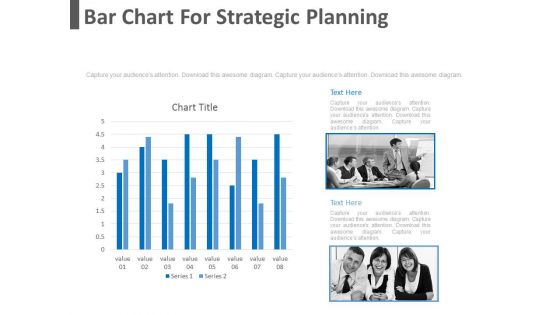
Bar Chart For Strategic Planning Powerpoint Slides
This PowerPoint template has been designed with bar graph with two teams. This diagram is useful to exhibit strategic planning. This diagram slide can be used to make impressive presentations.
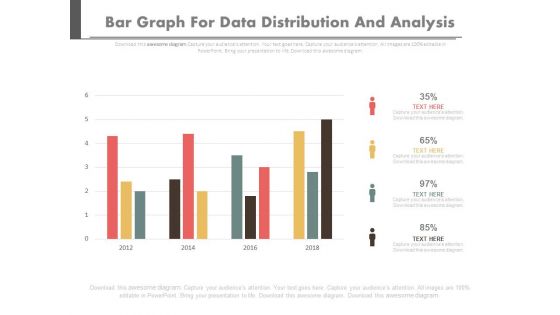
Bar Graph For Data Distribution And Analysis Powerpoint Slides
This PowerPoint template has been designed with bar graph. This PowerPoint diagram is useful for data distribution and analysis This diagram slide can be used to make impressive presentations.

Digital Media And Teamwork For Business Powerpoint Slides
This PowerPoint template has been designed with media devices and team pictures. This professional PPT slide is suitable to present digital media and teamwork. Capture the attention of your audience using this professional slide.

Four Segments Human Body Chart Powerpoint Slides
Create dynamic presentations with our creative template of human body chart with four segments. This diagram may be used to present information in visual manner. Download this template to leave permanent impression on your audience.
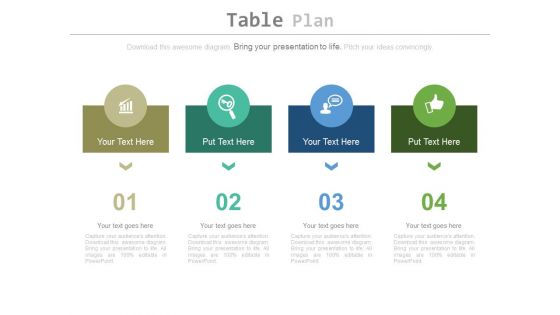
Four Steps Chart For Business Planning Powerpoint Slides
Our professionally designed business diagram is as an effective tool for communicating business planning. It contains four steps charts with icons. Above slide is suitable to display process management steps.
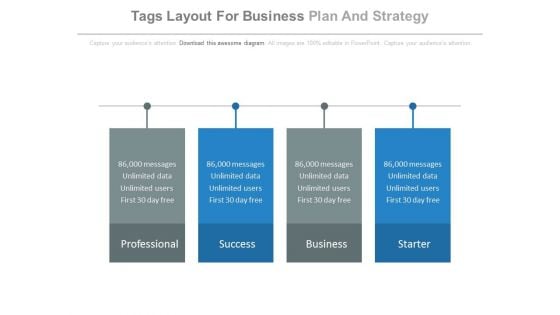
Four Tags Layout For Business Plan And Strategy Powerpoint Slides
This business slide displays diagram of four text tags. Download this PowerPoint diagram to display business plan and strategy. Enlighten your audience with your breathtaking ideas.
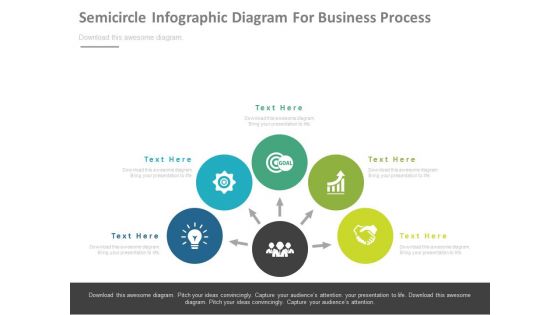
Semicircle Infographic Diagram For Business Process Powerpoint Slides
This PowerPoint template has been designed with semicircle infographic diagram. This PPT slide may be used to display business process flow. Download this slide to build unique presentation.
Six Steps Circular Chart With Icons Powerpoint Slides
This PowerPoint template has been designed with six steps circular chart with icons. This PPT slide may be used to display business and management functions. Download this slide to build unique presentation.
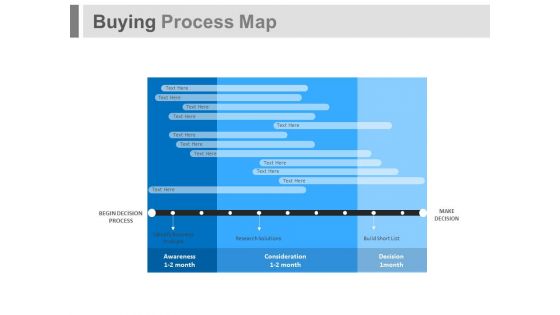
Buying Process Map Ppt Slides
This is a buying process map ppt slides. This is a one stage process. The stages in this process are business, marketing.
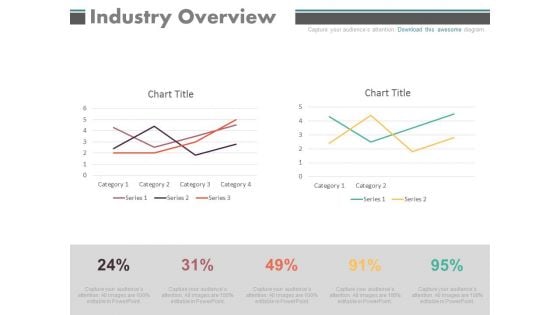
Industry Overview Percentage Chart Ppt Slides
This is a industry overview percentage chart ppt slides. This is a two stage process. The stages in this process are business, marketing.
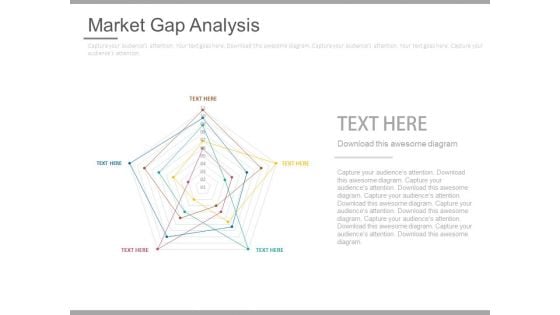
Market Gap Analysis Chart Ppt Slides
This is a market gap analysis chart ppt slides. This is a one stage process. The stages in this process are business, marketing.
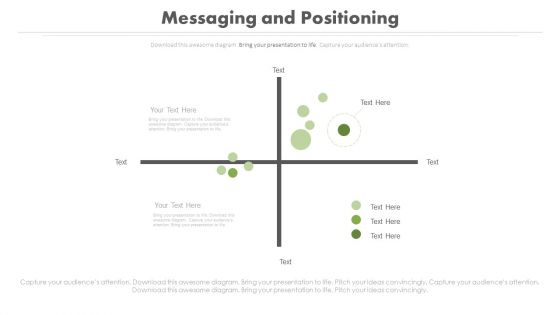
Messaging And Positioning Line Chart Ppt Slides
This is a messaging and positioning line chart ppt slides. This is a two stage process. The stages in this process are business, marketing.
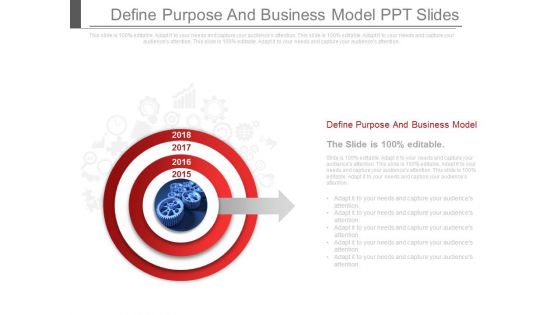
Define Purpose And Business Model Ppt Slides
This is a define purpose and business model. This is a four stage process. The stages in this process are time planning, business.
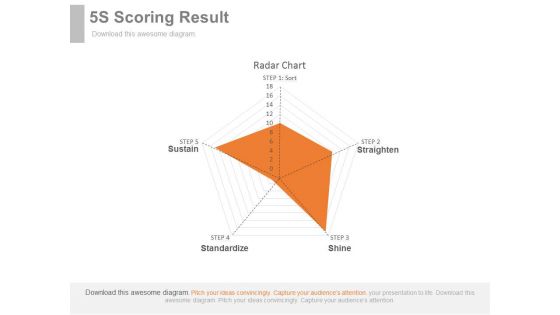
5S Scoring Result Ppt Slides
This is a 5s scoring result ppt slides. This is a five stage process. The stages in this process are business.
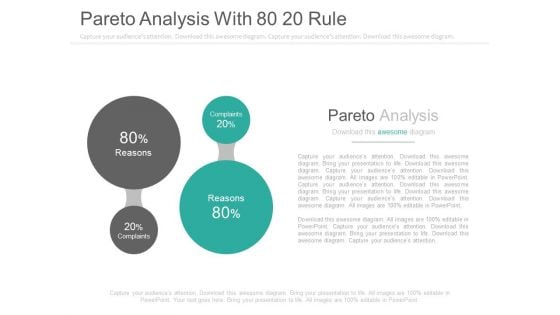
Pareto Analysis With 80 20 Rule Ppt Slides
This is a pareto analysis with 80 20 rule ppt slides. This is a two stage process. The stages in this process are finance, business.\n\n
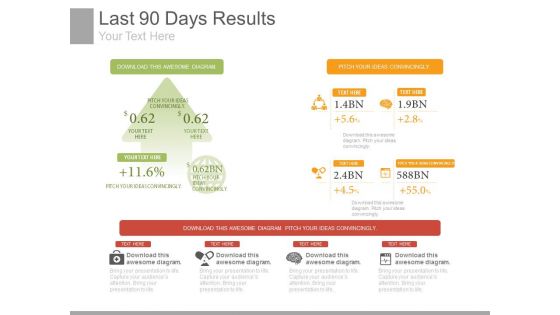
Last 90 Days Results Ppt Slides
This is a last 90 days results ppt slides. This is a four stage process. The stages in this process are business, marketing.
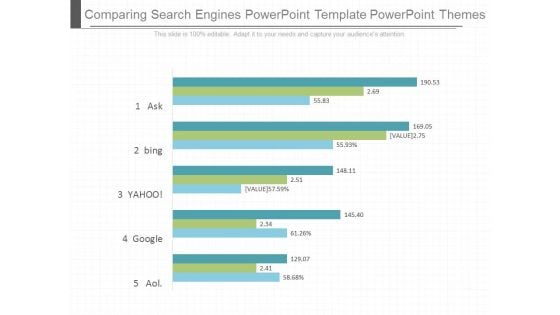
Comparing Search Engines Powerpoint Template Powerpoint Themes
This is a comparing search engines powerpoint template powerpoint themes. This is a five stage process. The stages in this process are ask, bing, yahoo, google, aol.
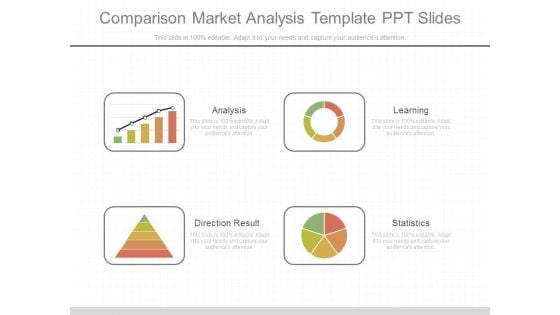
Comparison Market Analysis Template Ppt Slides
This is a comparison market analysis template ppt slides. This is a four stage process. The stages in this process are analysis, direction result, statistics, learning.
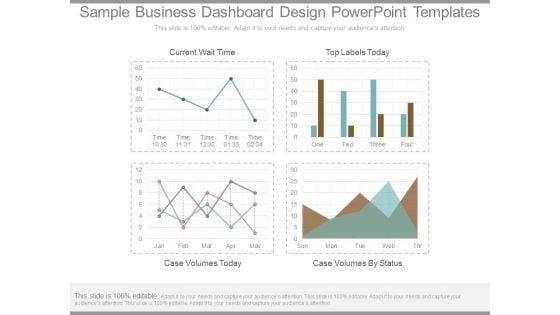
Sample Business Dashboard Design Powerpoint Templates
This is a sample business dashboard design powerpoint templates. This is a four stage process. The stages in this process are current wait time, top labels today, case volumes today, case volumes by status.
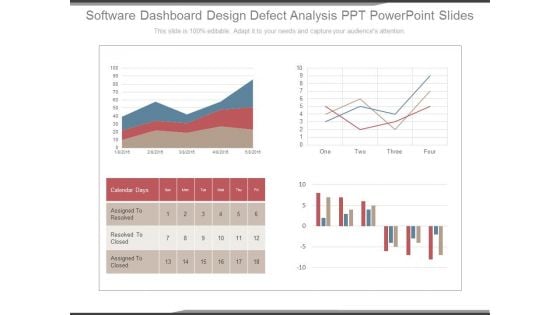
Software Dashboard Design Defect Analysis Ppt Powerpoint Slides
This is a software dashboard design defect analysis ppt powerpoint slides. This is a four stage process. The stages in this process are calendar days, assigned to resolved, resolved to closed, assigned to closed.
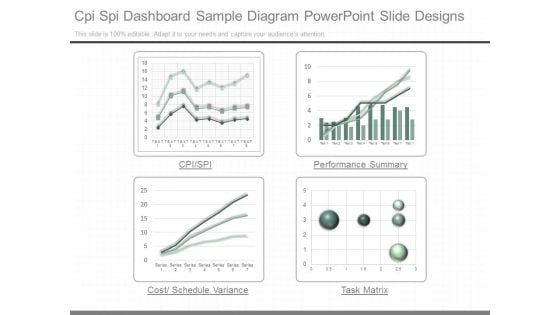
Cpi Spi Dashboard Sample Diagram Powerpoint Slide Designs
This is a cpi spi dashboard sample diagram powerpoint slide designs. This is a four stage process. The stages in this process are cpi spi, performance summary, cost schedule variance, task matrix.
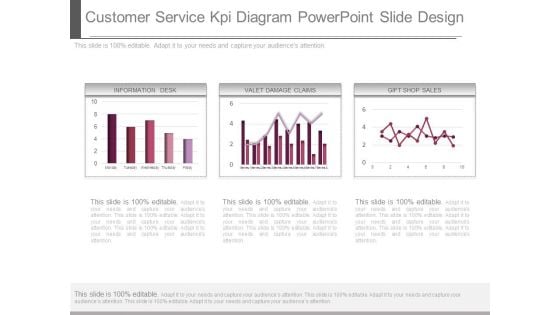
Customer Service Kpi Diagram Powerpoint Slide Design
This is a customer service kpi diagram powerpoint slide design. This is a three stage process. The stages in this process are information desk, valet damage claims, gift shop sales.
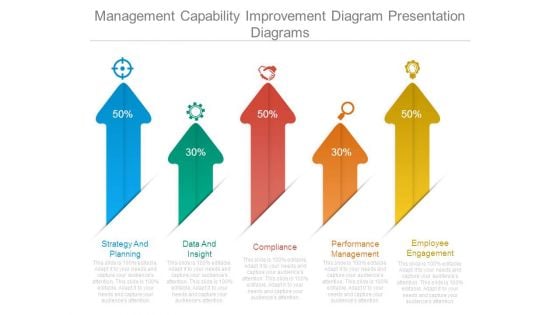
Management Capability Improvement Diagram Presentation Diagrams
This is a management capability improvement diagram presentation diagrams. This is a five stage process. The stages in this process are strategy and planning, data and insight, compliance, performance management, employee engagement.

Fixed Assets Classification Diagram Powerpoint Slide Backgrounds
This is a fixed assets classification diagram powerpoint slide backgrounds. This is a four stage process. The stages in this process are current book value by asset type, original cost by asset type, asset count by asset type, current value by department.


 Continue with Email

 Home
Home


