Revenue
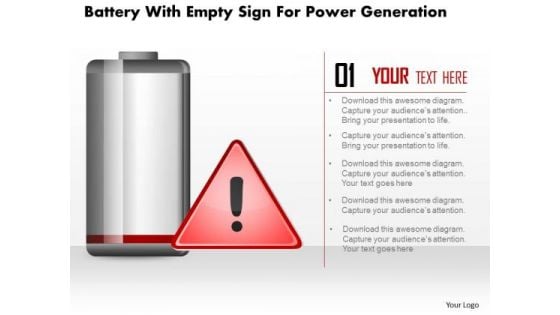
Business Diagram Battery With Empty Sign For Power Generation PowerPoint Slide
This business diagram displays empty sign alert on battery icon. Use this diagram, in your presentations to display energy saving, battery and technology. Create professional presentations using this diagram slide.
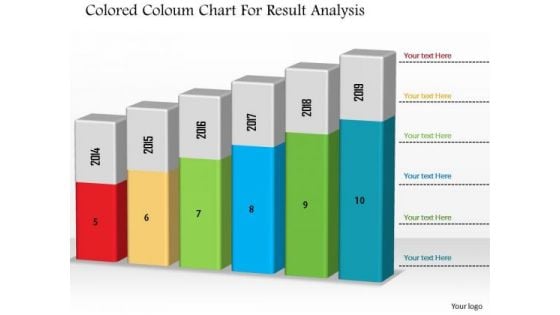
Business Diagram Colored Column Chart For Result Analysis PowerPoint Slide
This Power Point diagram has been designed with graphic of column chart. It contains diagram of bar char depicting annual business progress report. Use this diagram to build professional presentations for your viewers.

Business Diagram Data Driven Bar Graph And Pie Chart For Analysis PowerPoint Slide
This PowerPoint template displays technology gadgets with various business charts. Use this diagram slide, in your presentations to make business reports for statistical analysis. You may use this diagram to impart professional appearance to your presentations.

Business Diagram Data Driven Pie Chart Inside The Magnifier PowerPoint Slide
This business slide displays 3d colorful pie graph with magnifier. This diagram is a data visualization tool that gives you a simple way to present statistical information. This slide helps your audience examine and interpret the data you present.
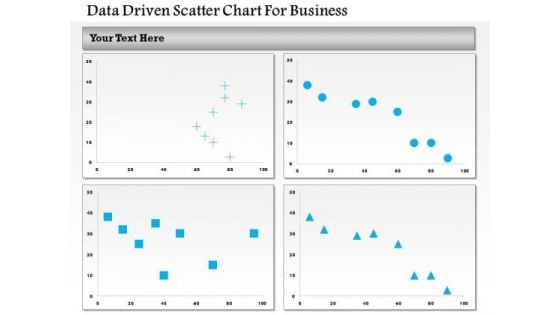
Business Diagram Data Driven Scatter Chart For Business PowerPoint Slide
This business diagram has been designed with four comparative charts. This slide suitable for data representation. You can also use this slide to present business analysis and reports. Use this diagram to present your views in a wonderful manner.
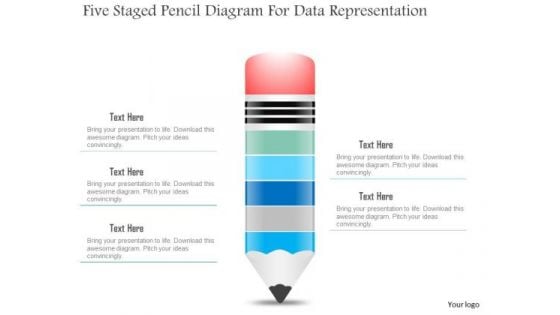
Business Diagram Five Staged Pencil Diagram For Data Representation PowerPoint Slide
This business slide displays five staged pencil diagram. It contains pencil graphic divided into five parts. This diagram slide depicts processes, stages, steps, points, options and education information display. Use this diagram, in your presentations to express your views innovatively.
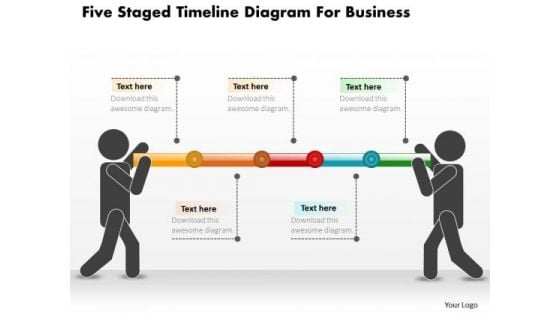
Business Diagram Five Staged Timeline Diagram For Business PowerPoint Slide
This PowerPoint template displays five points timeline diagram. This business diagram has been designed with graphic of timeline with five points, text space and start, end points. Use this diagram, in your presentations to display process steps, stages, timelines and business management. Make wonderful presentations using this business slide.
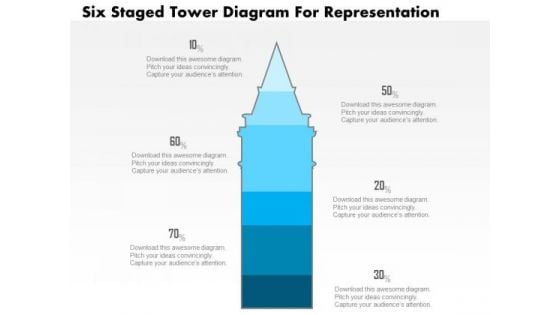
Business Diagram Five Staged Tower Diagram For Representation PowerPoint Slide
This business slide displays five staged tower diagram. It contains blue tower graphic divided into five parts. This diagram slide depicts processes, stages, steps, points, options information display. Use this diagram, in your presentations to express your views innovatively.
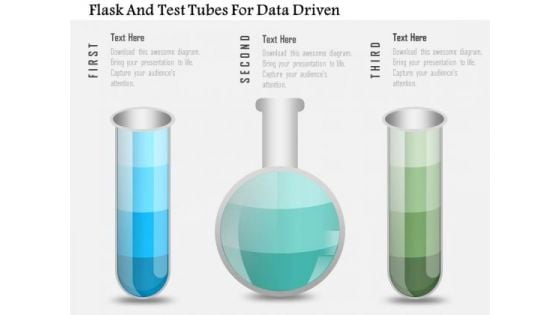
Business Diagram Flask And Test Tubes For Data Driven PowerPoint Slide
This data driven diagram has been designed with flask and test tubes. Download this diagram to give your presentations more effective look. It helps in clearly conveying your message to clients and audience.
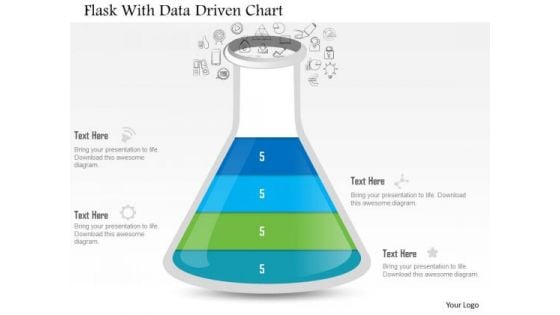
Business Diagram Flask With Data Driven Chart PowerPoint Slide
This data driven diagram has been designed with flask graphics. Download this diagram to give your presentations more effective look. It helps in clearly conveying your message to clients and audience.
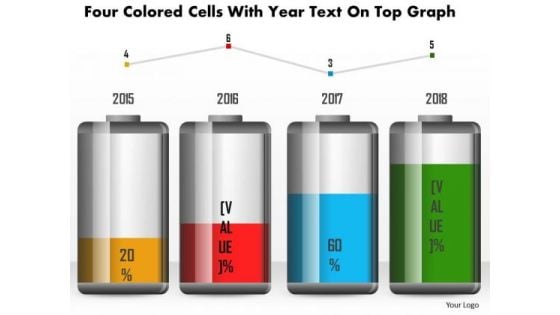
Business Diagram Four Colored Cells With Year Text On Top Graph PowerPoint Slide
This business diagram has been designed with battery cell graphic for business timeline. This slide can be used for business planning and management. Use this diagram for your business and success milestones related presentations.
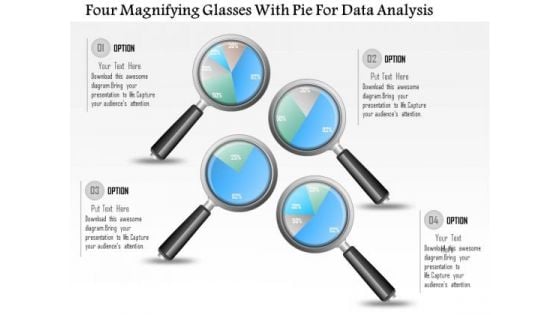
Business Diagram Four Magnifying Glasses With Pie For Data Analysis PowerPoint Slide
This business diagram displays graphic of pie charts in shape of magnifying glasses This business slide is suitable to present and compare business data. Use this diagram to build professional presentations for your viewers.

Business Diagram Four Pie Chart For Data Driven Result Analysis Of Business PowerPoint Slide
This business diagram displays graphic of pie charts in shape of flasks. This business slide is suitable to present and compare business data. Use this diagram to build professional presentations for your viewers.
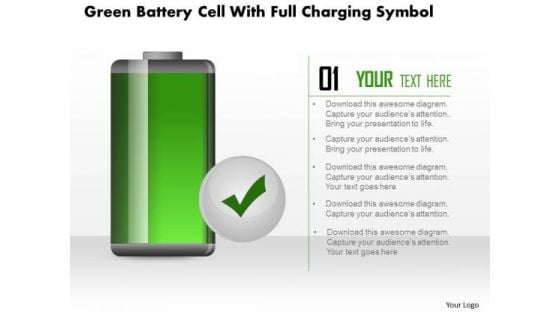
Business Diagram Green Battery Cell With Full Charging Symbol PowerPoint Slide
This business diagram displays full battery charge icon. Use this diagram, in your presentations to display energy saving, battery and technology. Create professional presentations using this diagram slide.
Business Diagram Hour Glass With 3d Man And Icons PowerPoint Slide
This diagram displays 3d man with hour glass and icons. This diagram contains concept of communication and technology. Use this diagram to display business process workflows in any presentations.
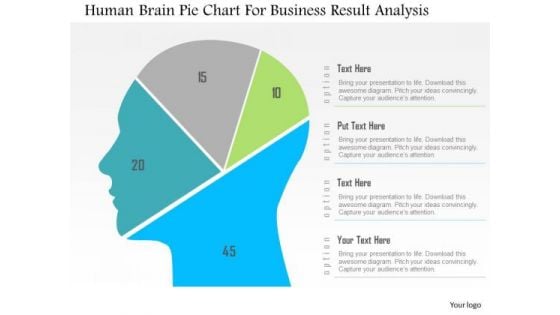
Business Diagram Human Brain Pie Chart For Business Result Analysis PowerPoint Slide
This diagram displays human face graphic divided into sections. This section can be used for data display. Use this diagram to build professional presentations for your viewers.
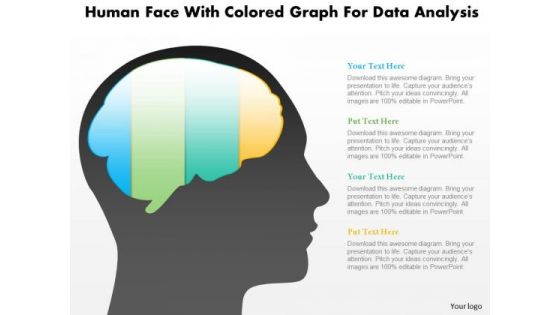
Business Diagram Human Face With Colored Graph For Data Analysis PowerPoint Slide
This diagram displays human face graphic with colored graph. This diagram can be used to represent strategy, planning, thinking of business plan. Display business options in your presentations by using this creative diagram.
Business Diagram Human Icons With Bubbles And Different Icons Inside PowerPoint Slide
This diagram displays graph with percentage value growth. This business slide is suitable to present and compare business data. Use this diagram to build professional presentations for your viewers.
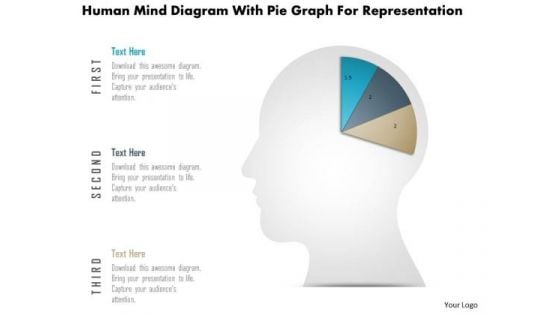
Business Diagram Human Mind Diagram With Pie Graph For Representation PowerPoint Slide
This diagram displays human face graphic divided into sections. This section can be used for data display. Use this diagram to build professional presentations for your viewers.
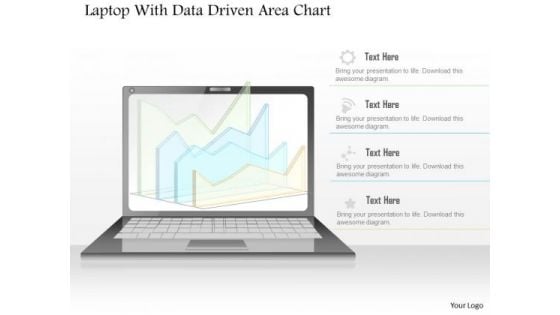
Business Diagram Laptop With Data Driven Area Chart PowerPoint Slide
This diagram has been designed with laptop and data driven area chart. Download this diagram to give your presentations more effective look. It helps in clearly conveying your message to clients and audience.
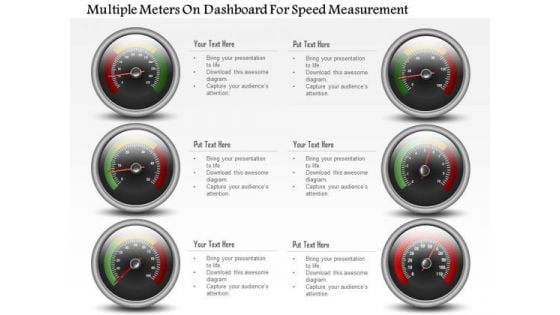
Business Diagram Multiple Meters On Dashboard For Speed Measurement PowerPoint Slide
This business diagram has been designed with multiple meters on dashboard. This slide can be used for business planning and progress. Use this diagram for your business and success milestones related presentations.

Business Diagram Six Staged Pie Charts For Text Representation PowerPoint Slide
This slide displays graphic six staged pie charts. Download this diagram to present and compare business data. Use this diagram to display business process workflows in any presentation.
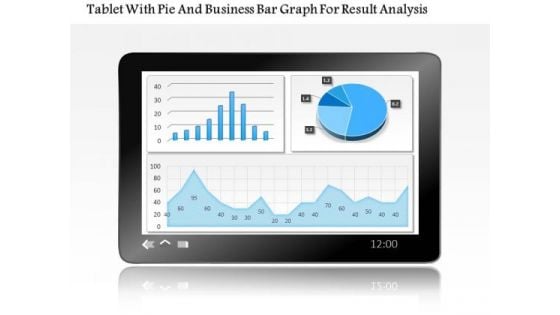
Business Diagram Tablet With Pie And Business Bar Graph For Result Analysis PowerPoint Slide
This PowerPoint template displays technology gadgets with various business charts. Use this diagram slide, in your presentations to make business reports for statistical analysis. You may use this diagram to impart professional appearance to your presentations.

Business Diagram Three Heads With Pie For Data Driven Technology PowerPoint Slide
This business diagram displays three human faces with pie charts. This Power Point template has been designed to compare and present business data. You may use this diagram to impart professional appearance to your presentations.

Business Diagram Three Staged Pencil Diagram For Graph Formation PowerPoint Slide
This business diagram displays set of pencils. This Power Point template has been designed to compare and present business data. Download this diagram to represent stages of business growth.
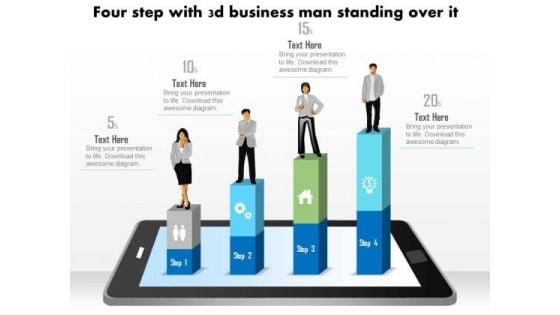
Business Diagram Four Steps With 3d Business Person Standing Over It PowerPoint Slide
This business diagram displays bar graph with business person standing on it. This Power Point template has been designed to display personal growth. You may use this diagram to impart professional appearance to your presentations.
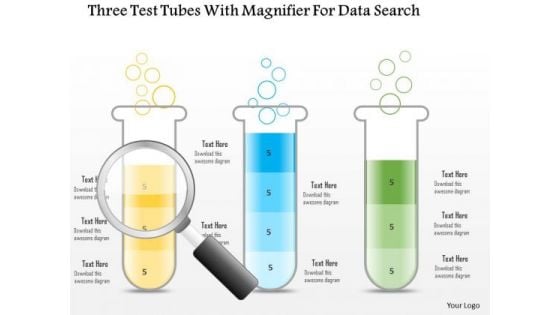
Business Diagram Three Test Tubes With Magnifier For Data Search PowerPoint Slide
This business diagram displays three test tubes with magnifying glass. This diagram is suitable to depict flow of business activities or steps. Download this professional slide to present information in an attractive manner.
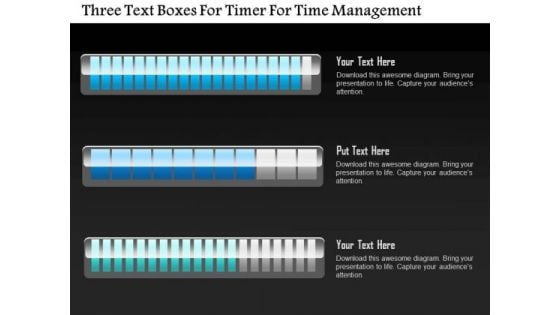
Business Diagram Three Text Boxes For Timer For Time Management PowerPoint Slide
This business diagram displays three text boxes. This diagram contains text boxes for data representation. Use this diagram to display business process workflows in any presentations.
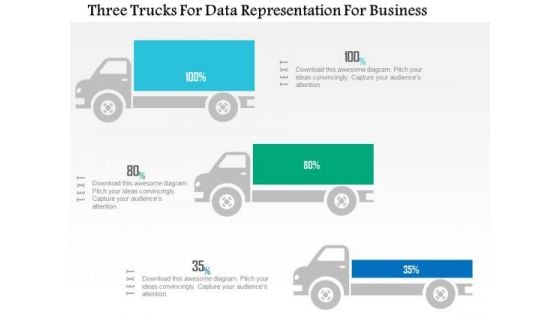
Business Diagram Three Trucks For Data Representation For Business PowerPoint Slide
This business diagram displays three trucks graphic. This diagram contains trucks for percentage value growth. Use this diagram to display business growth over a period of time.
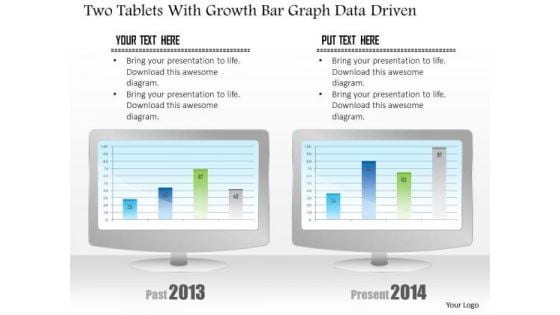
Business Diagram Two Tablets With Growth Bar Graph Data Driven PowerPoint Slide
This business diagram has been designed with comparative charts on tablets. This slide suitable for data representation. You can also use this slide to present business reports and information. Use this diagram to present your views in a wonderful manner.
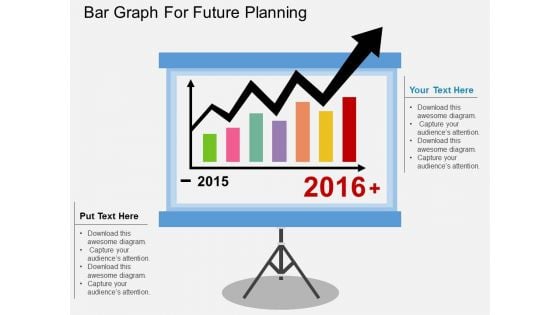
Bar Graph For Future Planning Powerpoint Template
This business diagram display bar graph for years 2015 and 2016. You may use this slide to display statistical analysis. This diagram provides an effective way of displaying information you can edit text, color, shade and style as per you need.

3D Men Icon With Percentage Values Powerpoint Templates
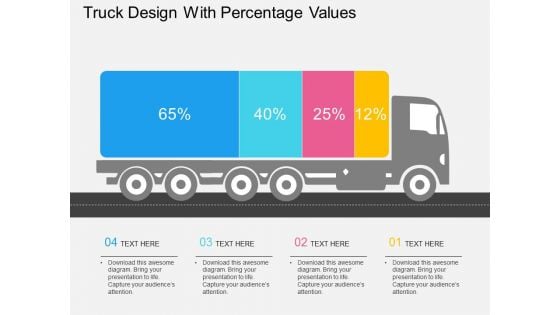
Truck Design With Percentage Values Powerpoint Template
Our compelling template consists with truck design with percentage values. This PPT slide has been professionally designed to exhibit transport and logistics concepts. This template offers an excellent background to build impressive presentation.
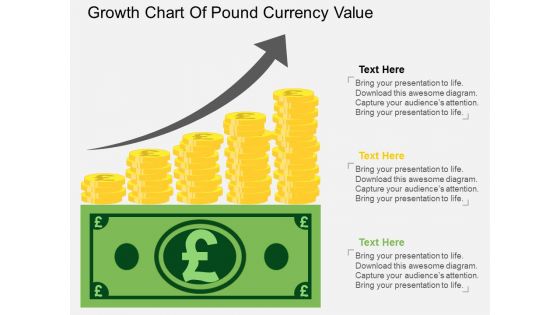
Growth Chart Of Pound Currency Value Powerpoint Template
The above PPT template displays growth chart of Pound currency. This diagram helps to exhibit Pound currency value growth. Adjust the above diagram in your business presentations to visually support your content.
Four Human Hand Icons With Circles Powerpoint Templates
This business slide provides background of four human hands. Display the options, business steps or workflow using this diagram as a tool. You can present your opinions using this impressive slide.
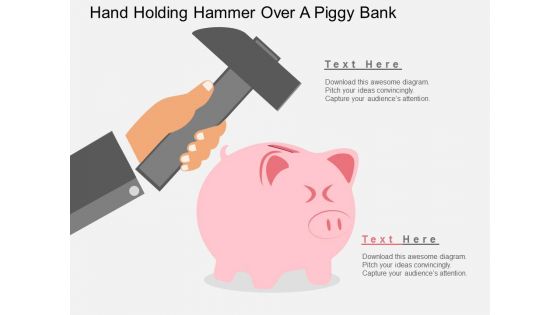
Hand Holding Hammer Over A Piggy Bank Powerpoint Templates
Our above business diagram displays vertical process infographic layout. This slide is suitable for to depict marketing and sales steps. Use this business diagram to present your work in a more smart and precise manner.

Strategy Marketing Pyramid Corporate Strategy Ppt Sample
This is a strategy marketing pyramid corporate strategy ppt sample. This is a four stages process. The stage in this process are circle charts, marketing, business, Finance.\n\n .\n
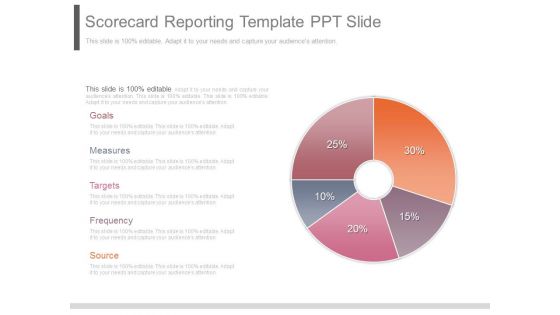
Scorecard Reporting Template Ppt Slide
This is a scorecard reporting template ppt slide. This is a five stage process. The stages in this process are goals, measures, targets, frequency, source.
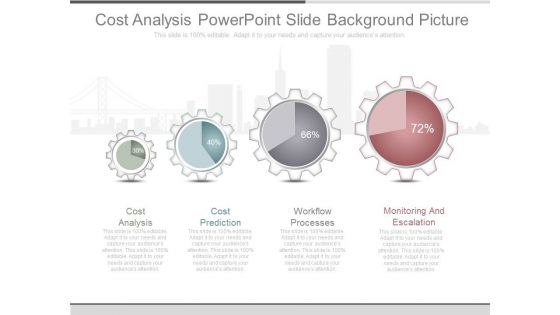
Cost Analysis Powerpoint Slide Background Picture
This is a cost analysis powerpoint slide background picture. This is a four stage process. The stages in this process are cost analysis, cost prediction, workflow processes, monitoring and escalation.
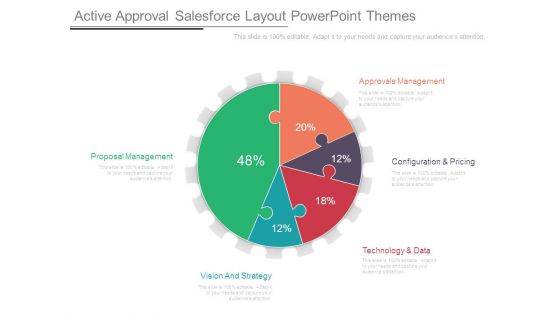
Active Approval Salesforce Layout Powerpoint Themes
This is a active approval salesforce layout powerpoint themes. This is a five stage process. The stages in this process are proposal management, vision and strategy, technology and data, configuration and pricing, approvals management.
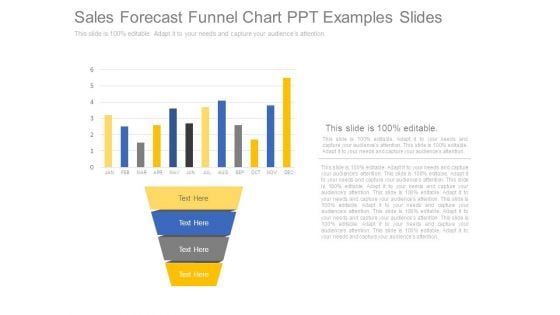
Sales Forecast Funnel Chart Ppt Examples Slides
This is a sales forecast funnel chart ppt examples slides. This is a four stage process. The stages in this process are jan, feb, mar, apr, may, jun, jul, aug, sep, oct, nov, dec.
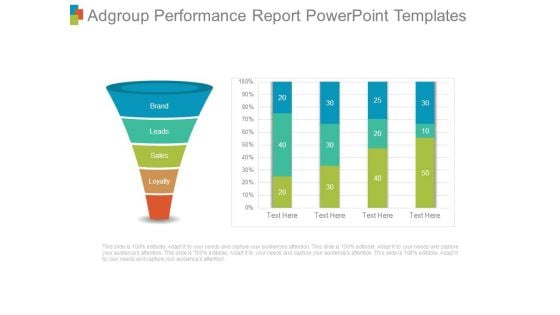
Adgroup Performance Report Powerpoint Templates
This is a adgroup performance report powerpoint templates. This is a four stage process. The stages in this process are brand, leads, sales, loyalty.
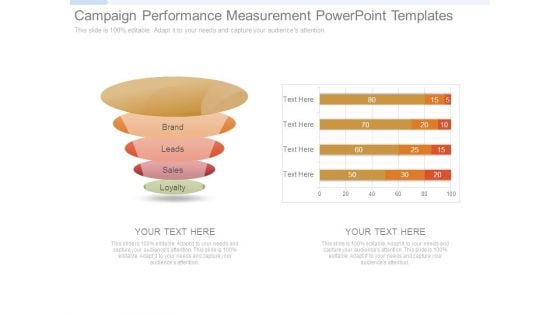
Campaign Performance Measurement Powerpoint Templates
This is a campaign performance measurement powerpoint templates. This is a four stage process. The stages in this process are brand, leads, sales, loyalty.
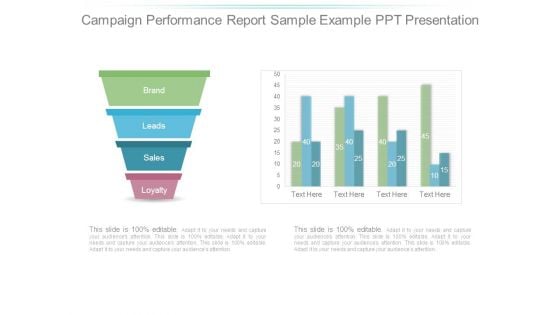
Campaign Performance Report Sample Example Ppt Presentation
This is a campaign performance report sample example ppt presentation. This is a four stage process. The stages in this process are brand, leads, sales, loyalty.
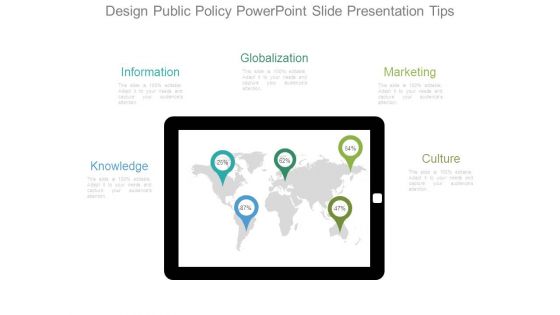
Design Public Policy Powerpoint Slide Presentation Tips
This is a design public policy powerpoint slide presentation tips. This is a five stage process. The stages in this process are target groups, create orders, deliver products, accompany customer, analyse customer, analyse processes.
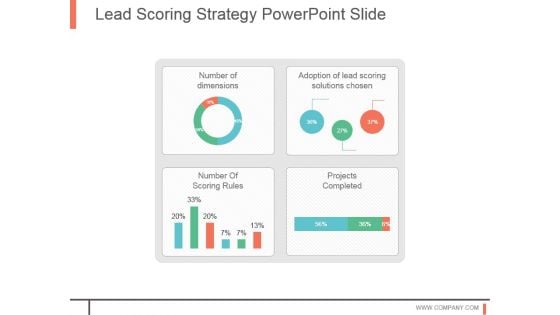
Lead Scoring Strategy Powerpoint Slide
This is a lead scoring strategy powerpoint slide. This is a four stage process. The stages in this process are adoption of lead scoring solutions chosen, projects completed, number of scoring rules, number of dimensions.
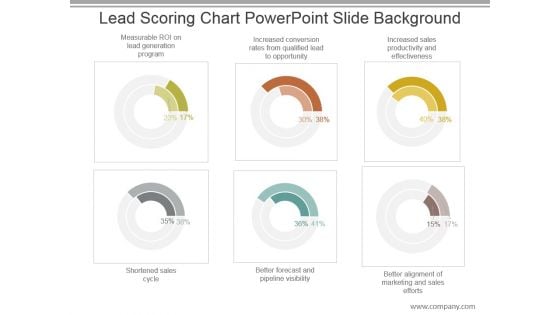
Lead Scoring Chart Powerpoint Slide Background
This is a lead scoring chart powerpoint slide background. This is a six stage process. The stages in this process are measurable roi on lead generation program, increased conversion rates from qualified lead to opportunity, increased sales productivity and effectiveness, shortened sales cycle, better forecast and pipeline visibility, better alignment of marketing and sales efforts.
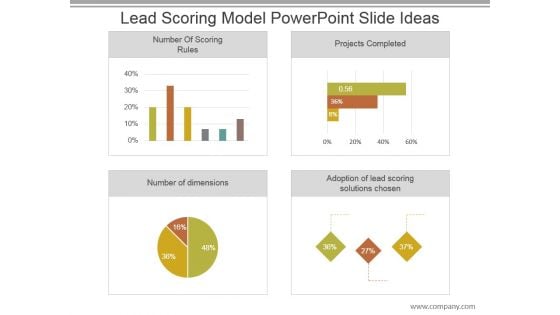
Lead Scoring Model Powerpoint Slide Ideas
This is a lead scoring model powerpoint slide ideas. This is a four stage process. The stages in this process are number of scoring rules, projects completed, number of dimensions, adoption of lead scoring solutions chosen.
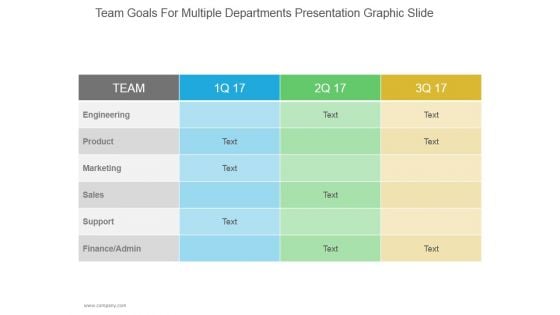
Team Goals For Multiple Departments Ppt PowerPoint Presentation Infographics
This is a team goals for multiple departments ppt powerpoint presentation infographic. This is a three stage process. The stages in this process are engineering, product, marketing, sales, support, finance admin.

Bpm Market Analysis Timeline Ppt PowerPoint Presentation Tips
This is a bpm market analysis timeline ppt powerpoint presentation tips. This is a five stage process. The stages in this process are growth, analysis, strategy, market, timeline.
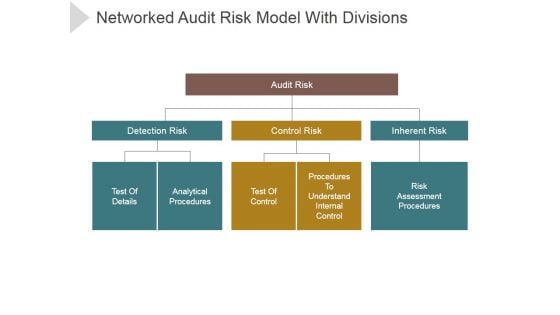
Networked Audit Risk Model With Divisions Ppt PowerPoint Presentation Professional
This is a networked audit risk model with divisions ppt powerpoint presentation professional. This is a three stage process. The stages in this process are audit risk, detection risk, control risk, inherent risk, test of details.
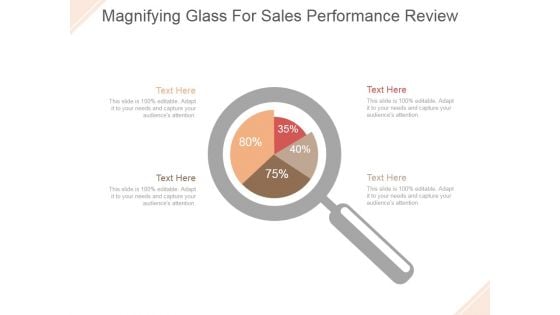
Magnifying Glass For Sales Performance Review Ppt PowerPoint Presentation Model
This is a magnifying glass for sales performance review ppt powerpoint presentation model. This is a four stage process. The stage in this process are magnifier glass, pie, finance, percentage, research.
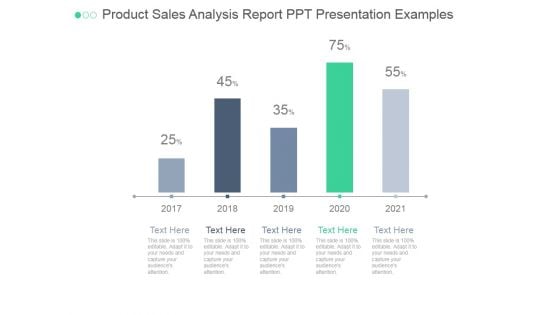
Product Sales Analysis Report Ppt PowerPoint Presentation Good
This is a product sales analysis report ppt powerpoint presentation good. This is a five stage process. The stages in this process are analysis, business, marketing, strategy, success, management, growth.
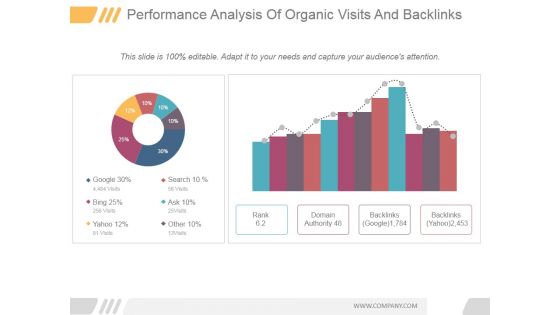
Performance Analysis Of Organic Visits And Backlinks Ppt PowerPoint Presentation Ideas
This is a performance analysis of organic visits and backlinks ppt powerpoint presentation ideas. This is a two stage process. The stages in this process are rank, domain authority, backlinks google, backlinks yahoo, google, bing.
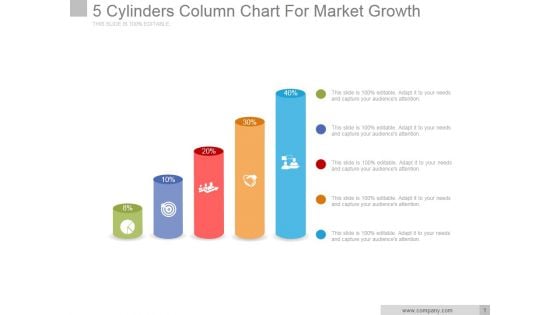
5 Cylinders Column Chart For Market Growth Ppt PowerPoint Presentation Outline
This is a 5 cylinders column chart for market growth ppt powerpoint presentation outline. This is a five stage process. The stages in this process are business, marketing, icons, growth, finance.
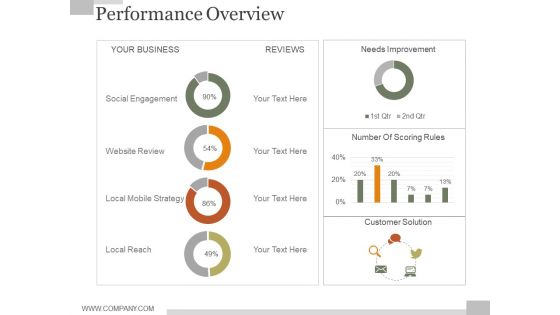
Performance Overview Ppt PowerPoint Presentation Diagrams
This is a performance overview ppt powerpoint presentation diagrams. This is a four stage process. The stages in this process are your business, social engagement, website review, local mobile strategy, local reach, reviews.
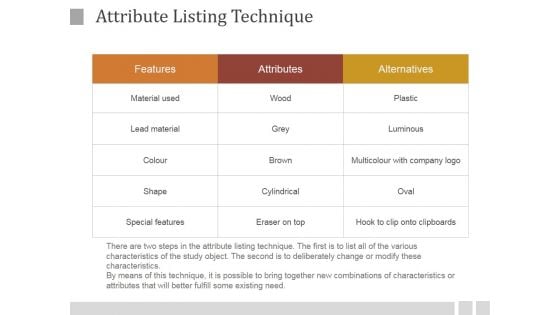
Attribute Listing Technique Ppt PowerPoint Presentation Microsoft
This is a attribute listing technique ppt powerpoint presentation microsoft. This is a three stage process. The stages in this process are features, attributes, alternatives, material used, lead material, shape, special features.
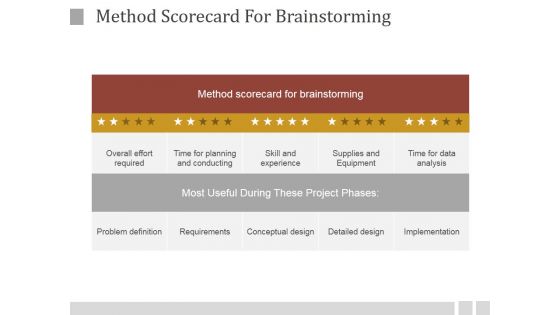
Method Scorecard For Brainstorming Ppt PowerPoint Presentation Visuals
This is a method scorecard for brainstorming ppt powerpoint presentation visuals. This is a five stage process. The stages in this process are method scorecard for brainstorming, overall effort required, time for planning and conducting, skill and experience, supplies and equipment, time for data analysis.
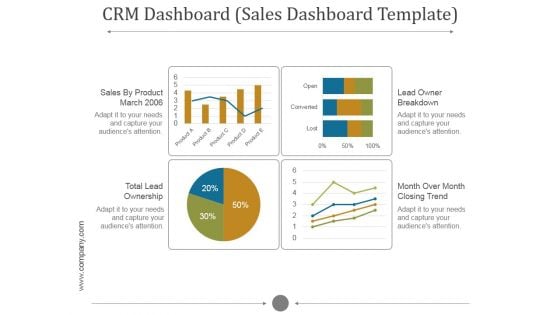
Crm Dashboard Sales Dashboard Template Ppt PowerPoint Presentation Inspiration
This is a crm dashboard sales dashboard template ppt powerpoint presentation inspiration. This is a five stage process. The stages in this process are sales by product march, lead owner breakdown, total lead ownership, month over month closing trend.
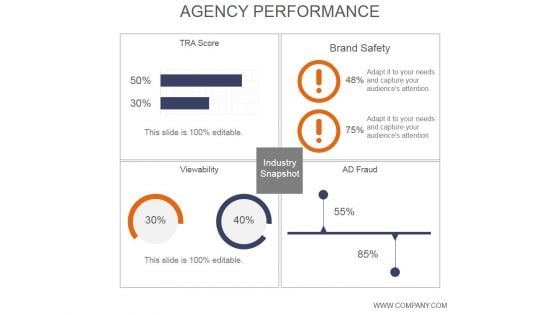
Agency Performance Ppt PowerPoint Presentation Layout
This is a agency performance ppt powerpoint presentation layout. This is a four stage process. The stages in this process are tra score, viewability, industry snapshot, brand safety, ad fraud.


 Continue with Email

 Home
Home


