Revenue
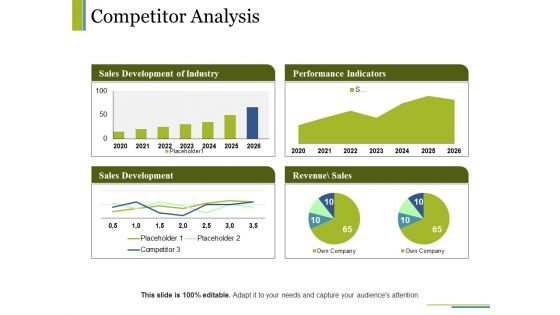
Competitor Analysis Ppt PowerPoint Presentation Visual Aids Model
This is a competitor analysis ppt powerpoint presentation visual aids model. This is a four stage process. The stages in this process are sales development of industry, performance indicators, sales development, revenue sales, business.
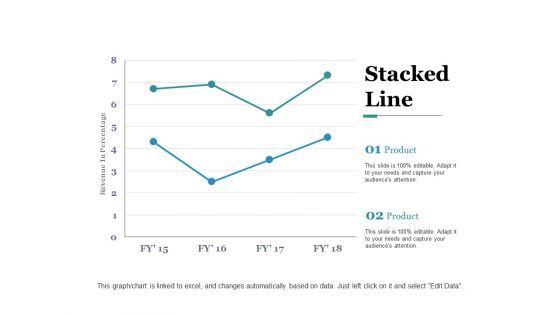
Stacked Line Ppt PowerPoint Presentation Professional Graphics Pictures
This is a stacked line ppt powerpoint presentation professional graphics pictures. This is a two stage process. The stages in this process are revenue in percentage, business, marketing, graph, finance.

Sales Kpi Performance Summary Ppt PowerPoint Presentation Show Themes
This is a sales kpi performance summary ppt powerpoint presentation show themes. This is a three stage process. The stages in this process are revenue comparison, quantity comparison, product sales mix, markets, sales channel.
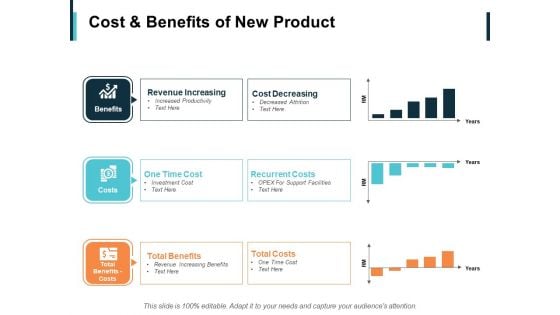
Cost And Benefits Of New Product Ppt PowerPoint Presentation Inspiration Diagrams
This is a cost and benefits of new product ppt powerpoint presentation inspiration diagrams. This is a three stage process. The stages in this process are recurrent costs, cost decreasing, revenue increasing, benefits, costs.
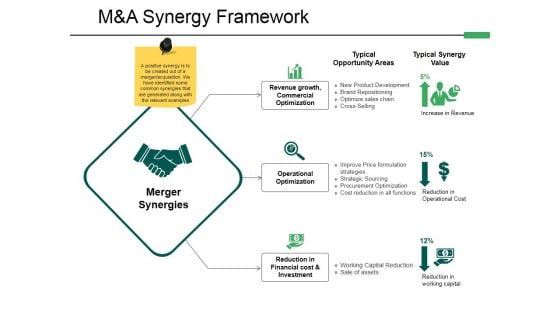
M And A Synergy Framework Ppt PowerPoint Presentation Professional Graphics
This is a m and a synergy framework ppt powerpoint presentation professional graphics. This is a three stage process. The stages in this process are revenue growth, commercial optimization, operational optimization, reduction in financial cost investment.

Sales Performance Dashboard Ppt PowerPoint Presentation Good
This is a sales performance dashboard ppt powerpoint presentation good. This is a four stage process. The stages in this process are lead sources revenue share, total sales by month, opportunities total sales by probability, win loss ratio.
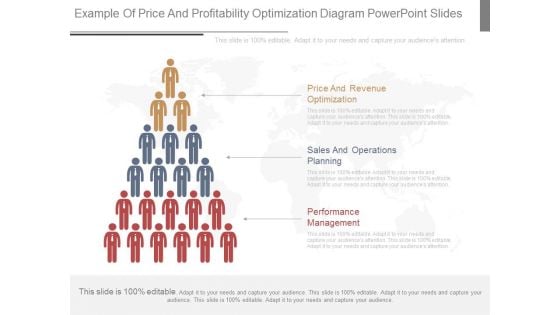
Example Of Price And Profitability Optimization Diagram Powerpoint Slides
This is a example of price and profitability optimization diagram powerpoint slides. This is a three stage process. The stages in this process are price and revenue optimization, sales and operations planning, performance management.
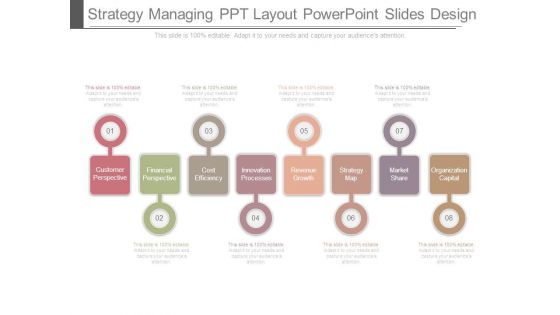
Strategy Managing Ppt Layout Powerpoint Slides Design
This is a strategy managing ppt layout powerpoint slides design. This is a eight stage process. The stages in this process are customer perspective, financial perspective, cost efficiency, innovation processes, revenue growth, strategy map, market share, organization capital.
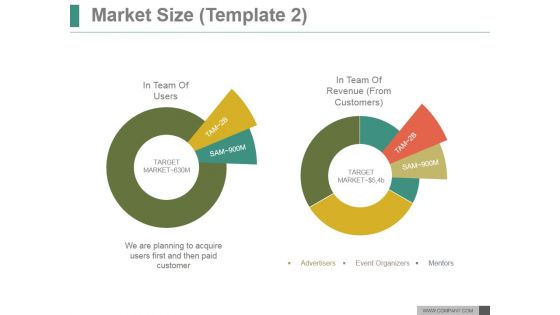
Market Size Template 2 Ppt PowerPoint Presentation Example File
This is a market size template 2 ppt powerpoint presentation example file. This is a two stage process. The stages in this process are in team of users, in team of revenue from customers.

Table Of Contents Template 2 Ppt PowerPoint Presentation Slide
This is a table of contents template 2 ppt powerpoint presentation slide. This is a two stage process. The stages in this process are business model, revenue model, growth strategy, marketing strategy, market size, financial summary, financial projection, shareholding pattern.
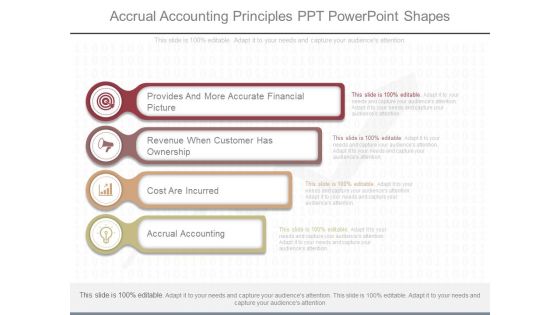
Accrual Accounting Principles Ppt Powerpoint Shapes
This is a accrual accounting principles ppt powerpoint shapes. This is a four stage process. The stages in this process are provides and more accurate financial picture, revenue when customer has ownership, cost are incurred, accrual accounting.
Business Overview Ppt PowerPoint Presentation Styles Icons
This is a business overview ppt powerpoint presentation styles icons. This is a six stage process. The stages in this process are highlights, financial highlights, product offering, revenue split by country, quarter track record.
Business Overview Ppt PowerPoint Presentation Infographic Template Visuals
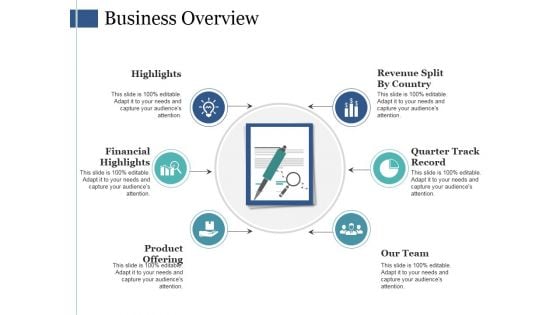
This is a business overview ppt powerpoint presentation infographic template visuals. This is a six stage process. The stages in this process are highlights, financial highlights, product offering, revenue split by country, quarter track record.

Business Overview Ppt PowerPoint Presentation File Ideas
This is a business overview ppt powerpoint presentation file ideas. This is a six stage process. The stages in this process are highlights, financial highlights, product offering, revenue split by country, our team.
M And A Synergy Framework Ppt PowerPoint Presentation Gallery Graphics Tutorials
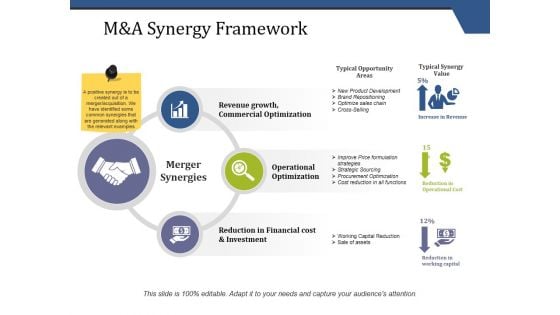
This is a m and a synergy framework ppt powerpoint presentation gallery graphics tutorials. This is a three stage process. The stages in this process are merger synergies, revenue growth, commercial optimization, operational optimization, reduction in financial cost and investment.
Content Ppt PowerPoint Presentation Infographics Diagrams
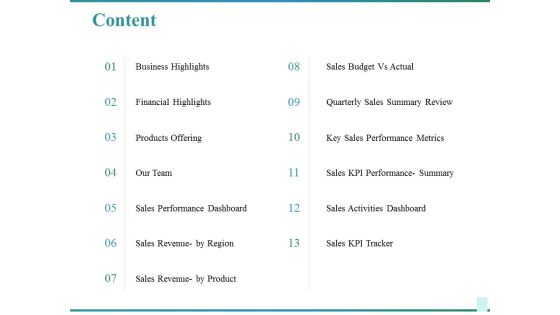
This is a content ppt powerpoint presentation infographics diagrams. This is a thirteen stage process. The stages in this process are business highlights, financial highlights, products offering, sales performance dashboard, sales revenue by region.

Formulating Procurement Strategy Ppt PowerPoint Presentation Styles Gallery
This is a formulating procurement strategy ppt powerpoint presentation styles gallery. This is a six stage process. The stages in this process are formulating procurement strategy, operations, financial data, procurement strategy, revenue impact.
Roi Strategies Diagram Powerpoint Slide Themes
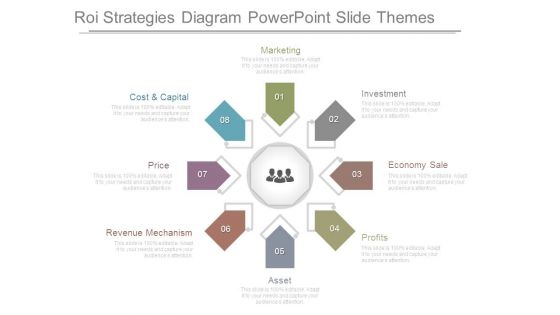
This is a roi strategies diagram powerpoint slide themes. This is a eight stage process. The stages in this process are marketing, investment, economy sale, profits, asset, revenue mechanism, price, cost and capital.
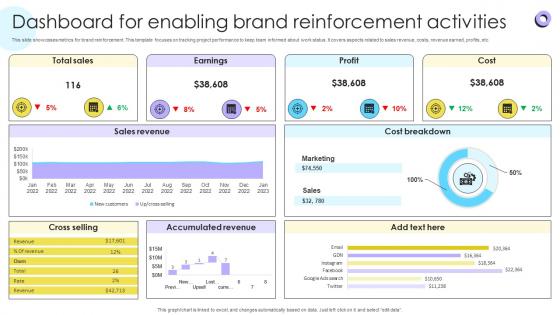
Dashboard For Enabling Brand Reinforcement Encouraging Repetitive Customer Purchase Ppt Slide
This slide showcases metrics for brand reinforcement. This template focuses on tracking project performance to keep team informed about work status. It covers aspects related to sales revenue, costs, revenue earned, profits, etc. From laying roadmaps to briefing everything in detail, our templates are perfect for you. You can set the stage with your presentation slides. All you have to do is download these easy-to-edit and customizable templates. Dashboard For Enabling Brand Reinforcement Encouraging Repetitive Customer Purchase Ppt Slide will help you deliver an outstanding performance that everyone would remember and praise you for. Do download this presentation today. This slide showcases metrics for brand reinforcement. This template focuses on tracking project performance to keep team informed about work status. It covers aspects related to sales revenue, costs, revenue earned, profits, etc.
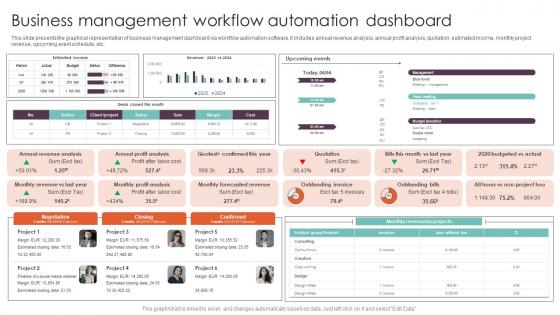
Business Management Workflow Automation Techniques Executing Workflow Ideas Pdf
This slide presents the graphical representation of business management dashboard via workflow automation software. It includes annual revenue analysis, annual profit analysis, quotation, estimated income, monthly project revenue, upcoming event schedule, etc. Create an editable Business Management Workflow Automation Techniques Executing Workflow Ideas Pdf that communicates your idea and engages your audience. Whether you are presenting a business or an educational presentation, pre-designed presentation templates help save time. Business Management Workflow Automation Techniques Executing Workflow Ideas Pdf is highly customizable and very easy to edit, covering many different styles from creative to business presentations. Slidegeeks has creative team members who have crafted amazing templates. So, go and get them without any delay. This slide presents the graphical representation of business management dashboard via workflow automation software. It includes annual revenue analysis, annual profit analysis, quotation, estimated income, monthly project revenue, upcoming event schedule, etc.
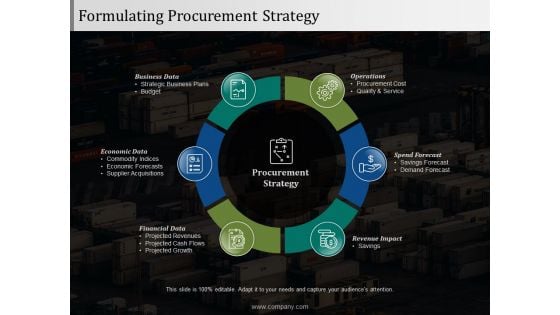
Formulating Procurement Strategy Ppt PowerPoint Presentation Pictures Gallery
This is a formulating procurement strategy ppt powerpoint presentation pictures gallery. This is a six stage process. The stages in this process are business data, operations, economic data, spend forecast, revenue impact.
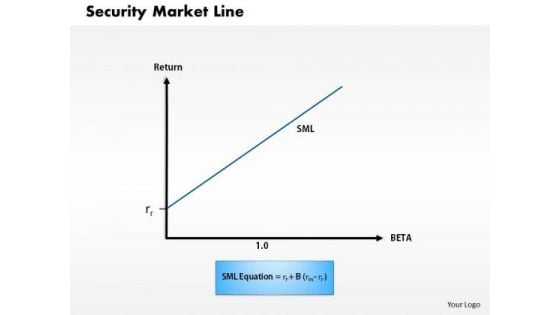
Business Framework Security Market Line 1 PowerPoint Presentation
This diagram displays graph of security market line. You can use line graph to plot changes in data over time, such as monthly revenue and earnings changes or daily changes in stock market prices.
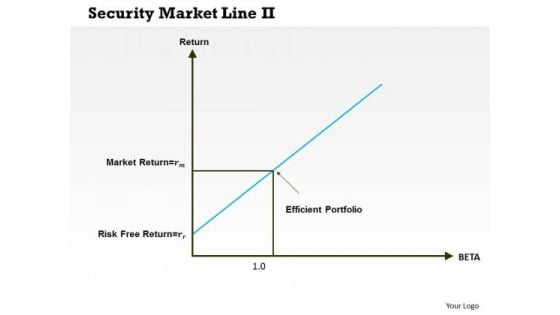
Business Framework Security Market Line 11 PowerPoint Presentation
This diagram displays graph of security market line. You can use line graph to plot changes in data over time, such as monthly revenue and earnings changes or daily changes in stock market prices.
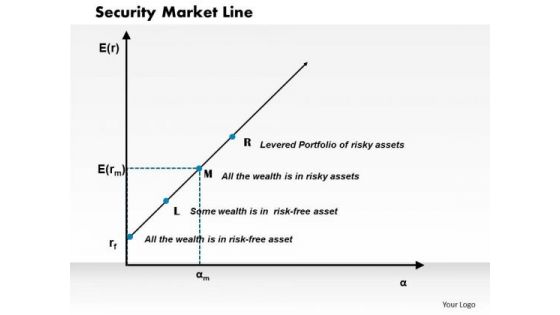
Business Framework Security Market Line PowerPoint Presentation
This diagram displays graph of security market line. You can use line graph to plot changes in data over time, such as monthly revenue and earnings changes or daily changes in stock market prices.
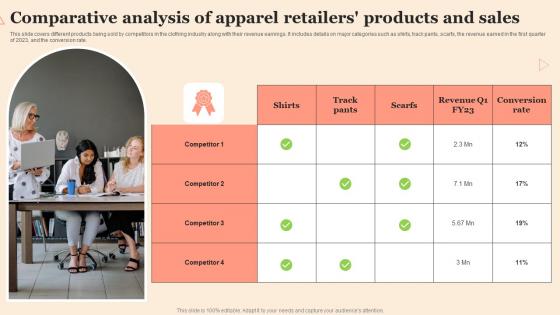
Comparative Analysis Of Apparel Retailers Products And Sales Clipart Pdf
This slide covers different products being sold by competitors in the clothing industry along with their revenue earnings. It includes details on major categories such as shirts, track pants, scarfs, the revenue earned in the first quarter of 2023, and the conversion rate. Pitch your topic with ease and precision using this Comparative Analysis Of Apparel Retailers Products And Sales Clipart Pdf This layout presents information on Comparative Analysis, Apparel Retailers, Products Sales It is also available for immediate download and adjustment. So, changes can be made in the color, design, graphics or any other component to create a unique layout. This slide covers different products being sold by competitors in the clothing industry along with their revenue earnings. It includes details on major categories such as shirts, track pants, scarfs, the revenue earned in the first quarter of 2023, and the conversion rate.
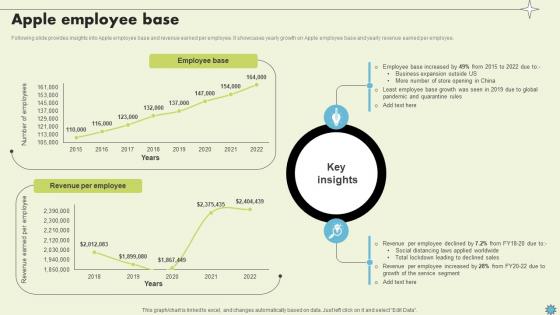
Apple Employee Base Consumer Electronics Company Profile CP SS V
Following slide provides insights into Apple employee base and revenue earned per employee. It showcases yearly growth on Apple employee base and yearly revenue earned per employee.Slidegeeks is one of the best resources for PowerPoint templates. You can download easily and regulate Apple Employee Base Consumer Electronics Company Profile CP SS V for your personal presentations from our wonderful collection. A few clicks is all it takes to discover and get the most relevant and appropriate templates. Use our Templates to add a unique zing and appeal to your presentation and meetings. All the slides are easy to edit and you can use them even for advertisement purposes. Following slide provides insights into Apple employee base and revenue earned per employee. It showcases yearly growth on Apple employee base and yearly revenue earned per employee.

Business Metrics And Performance Diagram Presentation Images
This is a business metrics and performance diagram presentation images. This is a six stage process. The stages in this process are expense management, customer satisfaction, net income, revenue attainment, business metrics, turnover, productivity.
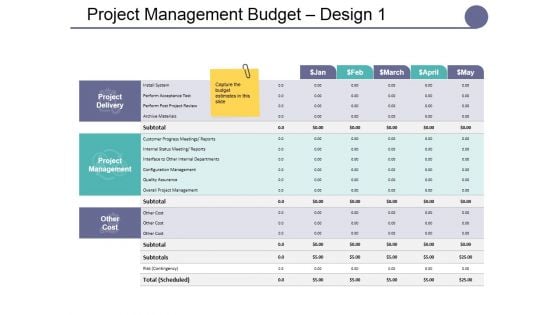
Project Management Budget Design Template 1 Ppt PowerPoint Presentation Show Model
This is a project management budget design template 1 ppt powerpoint presentation show model. This is a four stage process. The stages in this process are internal funding, department budget, existing revenue streams, government grants, itemized income.
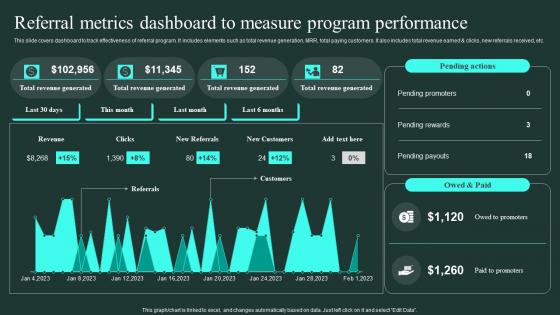
Referral Metrics Dashboard To Measure Program Performance Word Of Mouth Marketing Portrait Pdf
This slide covers dashboard to track effectiveness of referral program. It includes elements such as total revenue generation, MRR, total paying customers. It also includes total revenue earned And clicks, new referrals received, etc. This Referral Metrics Dashboard To Measure Program Performance Word Of Mouth Marketing Portrait Pdf from Slidegeeks makes it easy to present information on your topic with precision. It provides customization options, so you can make changes to the colors, design, graphics, or any other component to create a unique layout. It is also available for immediate download, so you can begin using it right away. Slidegeeks has done good research to ensure that you have everything you need to make your presentation stand out. Make a name out there for a brilliant performance. This slide covers dashboard to track effectiveness of referral program. It includes elements such as total revenue generation, MRR, total paying customers. It also includes total revenue earned and clicks, new referrals received, etc.
Referral Program Partners Performance Tracking Dashboard Word Of Mouth Marketing Pictures Pdf
This slide covers dashboard to track effectiveness of partners in referral program along revenue generation. It include elements such as total partners, patner employees, referrals received, revenue earned, etc.Do you know about Slidesgeeks Referral Program Partners Performance Tracking Dashboard Word Of Mouth Marketing Pictures Pdf These are perfect for delivering any kind od presentation. Using it, create PowerPoint presentations that communicate your ideas and engage audiences. Save time and effort by using our pre-designed presentation templates that are perfect for a wide range of topic. Our vast selection of designs covers a range of styles, from creative to business, and are all highly customizable and easy to edit. Download as a PowerPoint template or use them as Google Slides themes. This slide covers dashboard to track effectiveness of partners in referral program along revenue generation. It include elements such as total partners, patner employees, referrals received, revenue earned, etc.

Manufacturing Schedule Cycle Diagram Ppt Sample
This is a manufacturing schedule cycle diagram ppt sample. This is a six stage process. The stages in this process are delivery product on time, satisfy customer, improve customer retention, increase sales, drive revenue growth, deliver profit.
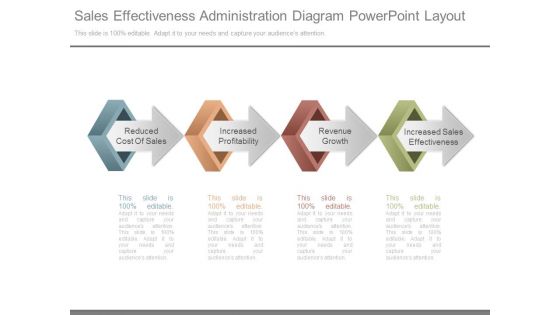
Sales Effectiveness Administration Diagram Powerpoint Layout
This is a sales effectiveness administration diagram powerpoint layout. This is a four stage process. The stages in this process are reduced cost of sales, increased profitability, revenue growth, increased sales effectiveness.
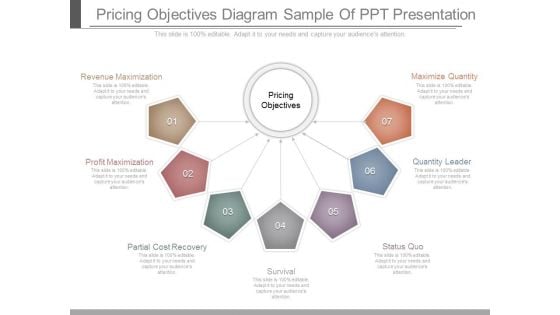
Pricing Objectives Diagram Sample Of Ppt Presentation
This is a pricing objectives diagram sample of ppt presentation. This is a seven stage process. The stages in this process are pricing objectives, revenue maximization, profit maximization, partial cost recovery, survival, status quo, quantity leader, maximize quantity.
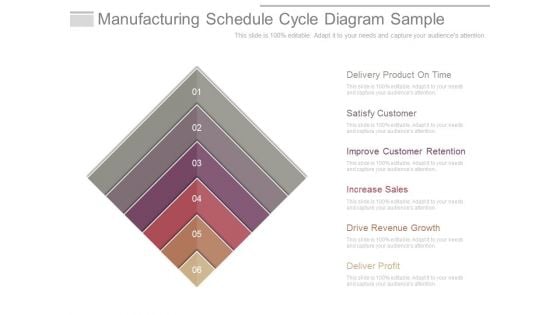
Manufacturing Schedule Cycle Diagram Sample
This is a manufacturing schedule cycle diagram sample. This is a six stage process. The stages in this process are delivery product on time, satisfy customer, improve customer retention, increase sales, drive revenue growth, deliver profit.
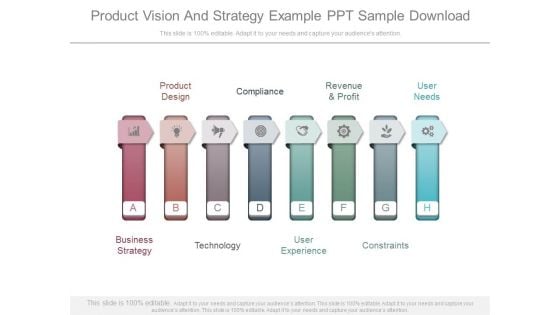
Product Vision And Strategy Example Ppt Sample Download
This is a product vision and strategy example ppt sample download. This is a eight stage process. The stages in this process are product design, compliance, revenue and profit, user needs, constraints, user experience, technology, business strategy.
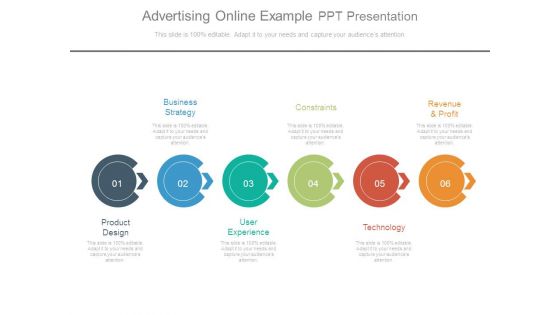
Advertising Online Example Ppt Presentation
This is a advertising online example ppt presentation. This is a six stage process. The stages in this process are business strategy, constraints, revenue and profit, product design, user experience, technology.
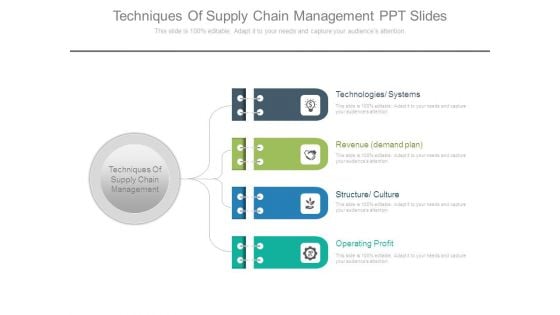
Techniques Of Supply Chain Management Ppt Slides
This is a techniques of supply chain management ppt slides. This is a four stage process. The stages in this process are techniques of supply chain management, technologies systems, revenue demand plan, structure culture, operating profit.
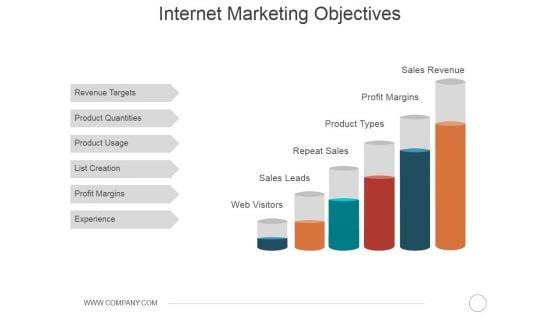
Internet Marketing Objectives Ppt PowerPoint Presentation Portfolio Summary
This is a internet marketing objectives ppt powerpoint presentation portfolio summary. This is a six stage process. The stages in this process are revenue targets, product quantities, product usage, list creation, profit margins, experience.
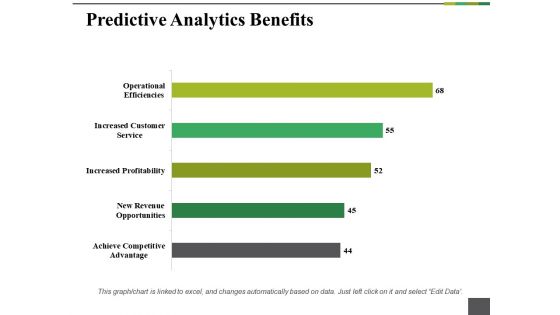
Predictive Analytics Benefits Ppt PowerPoint Presentation Outline File Formats
This is a predictive analytics benefits ppt powerpoint presentation outline file formats. This is a five stage process. The stages in this process are operational efficiency, increased customer service, increase profitability, new revenue opportunities.
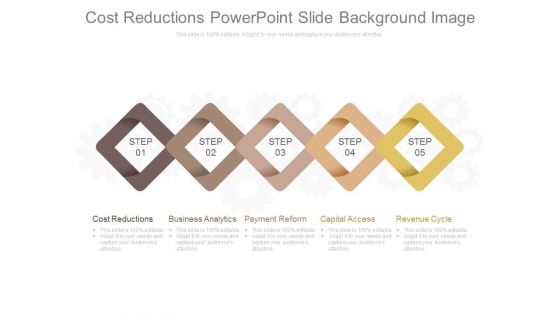
Cost Reductions Powerpoint Slide Background Image
This is a cost reductions powerpoint slide background image. This is a five stage process. The stages in this process are cost reductions, business analytics, payment reform, capital access, revenue cycle.
Dashboard For Tracking Impact Of Implementing Sales Techniques For Achieving Rules Pdf
This slide covers the KPI dashboard for tracking KPIs such as new customer YTD, sales revenue, profit, average weekly sales, above sales target, average revenue per unit, customer lifetime value, etc. Do you have an important presentation coming up Are you looking for something that will make your presentation stand out from the rest Look no further than Dashboard For Tracking Impact Of Implementing Sales Techniques For Achieving Rules Pdf. With our professional designs, you can trust that your presentation will pop and make delivering it a smooth process. And with Slidegeeks, you can trust that your presentation will be unique and memorable. So why wait Grab Dashboard For Tracking Impact Of Implementing Sales Techniques For Achieving Rules Pdf today and make your presentation stand out from the rest This slide covers the KPI dashboard for tracking KPIs such as new customer YTD, sales revenue, profit, average weekly sales, above sales target, average revenue per unit, customer lifetime value, etc.
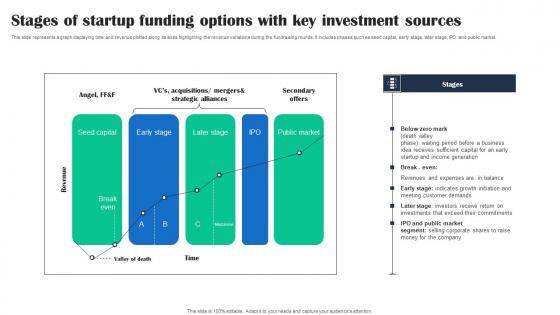
Stages Of Startup Funding Options With Key Investment Sources Formats Pdf
This slide represents a graph displaying time and revenue plotted along its axes highlighting the revenue variations during the fundraising rounds. It includes phases such as seed capital, early stage, later stage, IPO and public market. Showcasing this set of slides titled Stages Of Startup Funding Options With Key Investment Sources Formats Pdf. The topics addressed in these templates are Secondary Offers, Sources, Stages . All the content presented in this PPT design is completely editable. Download it and make adjustments in color, background, font etc. as per your unique business setting. This slide represents a graph displaying time and revenue plotted along its axes highlighting the revenue variations during the fundraising rounds. It includes phases such as seed capital, early stage, later stage, IPO and public market.
Amur Tiger PowerPoint Icon Cc
Amur Tiger (Panthera tigris altaica) looking to left of frame - landscape orientation Start accelerating revenue growth with our Amur Tiger PowerPoint Icon Cc. They will make you look good.
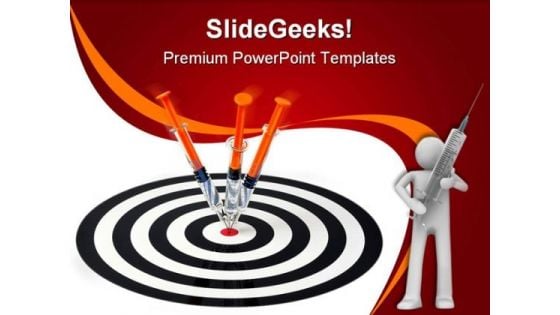
Vaccine Target Medical PowerPoint Backgrounds And Templates 0111
Microsoft PowerPoint Template and Background with syringes and target Start accelerating revenue growth with our Vaccine Target Medical PowerPoint Backgrounds And Templates 0111. They will make you look good.

Locked Earth Security PowerPoint Templates And PowerPoint Backgrounds 0311
Microsoft PowerPoint Template and Background with blue and white earth with keyhole Start accelerating revenue growth with our Locked Earth Security PowerPoint Templates And PowerPoint Backgrounds 0311. They will make you look good.
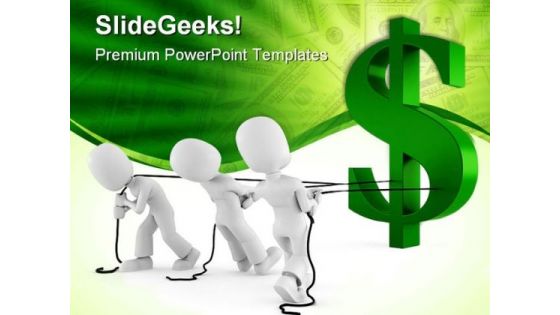
Crisis Dollar Business PowerPoint Templates And PowerPoint Backgrounds 0411
Microsoft PowerPoint Template and Background with man pulling the dollar symbol Start accelerating revenue growth with our Crisis Dollar Business PowerPoint Templates And PowerPoint Backgrounds 0411. They will make you look good.

Teamwork04 Business PowerPoint Templates And PowerPoint Backgrounds 0611
Microsoft PowerPoint Template and Background with business team holding hands Start accelerating revenue growth with our Teamwork04 Business PowerPoint Templates And PowerPoint Backgrounds 0611. They will make you look good.

Abstract Arrows Business PowerPoint Templates And PowerPoint Themes 0312
Microsoft Powerpoint Templates and Background with glossy arrows background Start accelerating revenue growth with our Abstract Arrows Business PowerPoint Templates And PowerPoint Themes 0312. They will make you look good.

Home Loans Services PowerPoint Templates And PowerPoint Themes 0912
Home Loans Services PowerPoint Templates And PowerPoint Themes 0912-Microsoft Powerpoint Templates and Background with home loans Start accelerating revenue growth with our Home Loans Services PowerPoint Templates And PowerPoint Themes 0912. They will make you look good.
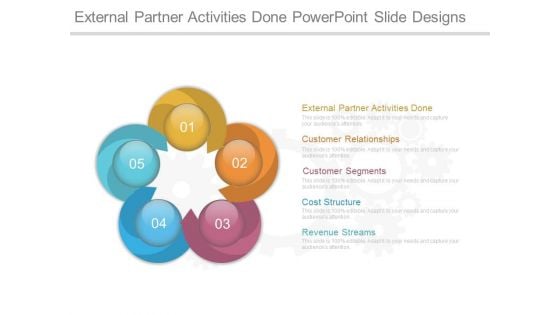
External Partner Activities Done Powerpoint Slide Designs
This is an external partner activities done powerpoint slide designs. This is a five stage process. The stages in this process are external partner activities done, customer relationships, customer segments, cost structure, revenue streams.
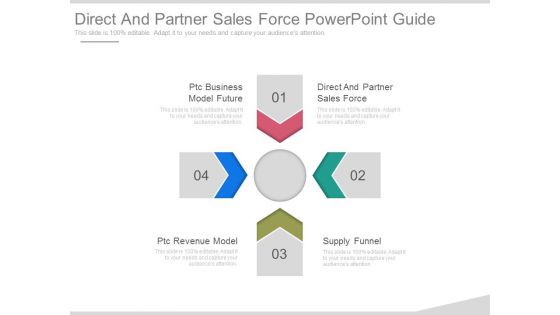
Direct And Partner Sales Force Powerpoint Guide
This is a direct and partner sales force powerpoint guide. This is a four stage process. The stages in this process are ptc business model future, direct and partner sales force, ptc revenue model, supply funnel.
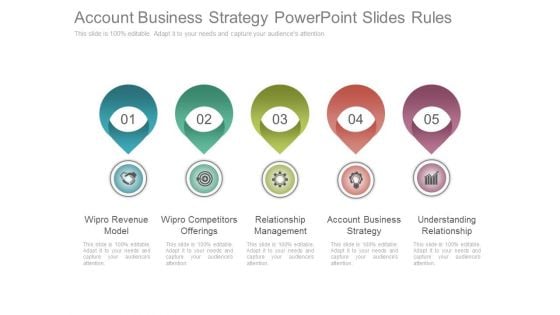
Account Business Strategy Powerpoint Slides Rules
This is a account business strategy powerpoint slides rules. This is a five stage process. The stages in this process are wipro revenue model, wipro competitors offerings, relationship management, account business strategy, understanding relationship.
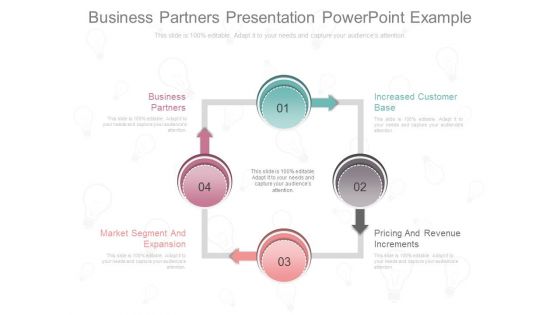
Business Partners Presentation Powerpoint Example
This is a business partners presentation powerpoint example. This is a four stage process. The stages in this process are business partners, increased customer base, market segment and expansion, pricing and revenue increments.
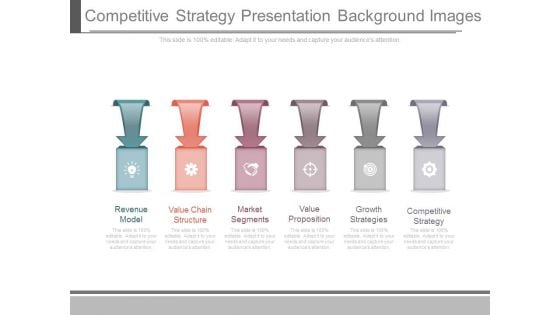
Competitive Strategy Presentation Background Images
This is a competitive strategy presentation background images. This is a six stage process. The stages in this process are revenue model, value chain structure, market segments, value proposition, growth strategies, competitive strategy.
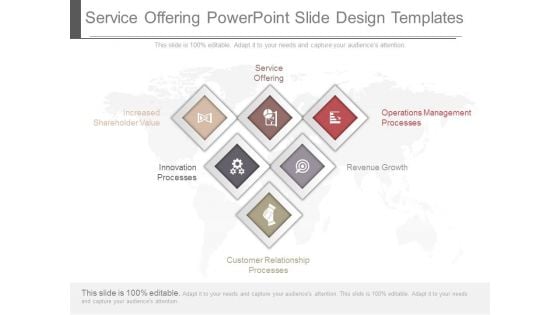
Service Offering Powerpoint Slides Design Templates
This is a service offering powerpoint slides design templates. This is a six stage process. The stages in this process are service offering, increased shareholder value, innovation processes, customer relationship processes, revenue growth, operations management processes.
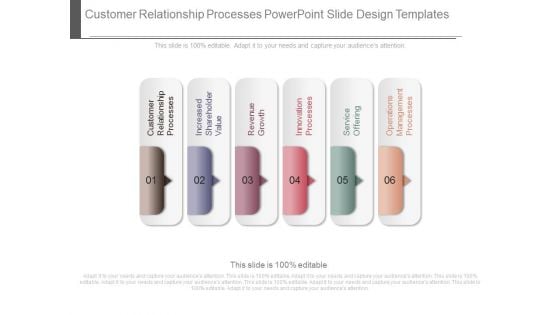
Customer Relationship Processes Powerpoint Slide Design Templates
This is a customer relationship processes powerpoint slide design templates. This is a six stage process. The stages in this process are customer relationship processes, increased shareholder value, revenue growth, innovation processes, service offering, operations management processes.
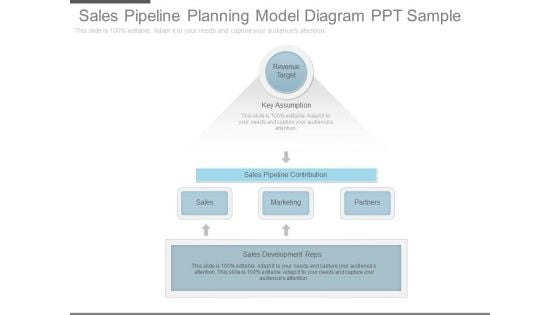
Sales Pipeline Planning Model Diagram Ppt Sample
This is a sales pipeline planning model diagram ppt sample. This is a one stage process. The stages in this process are revenue target, key assumption, sales pipeline contribution, sales, marketing, partners, sales development reps.
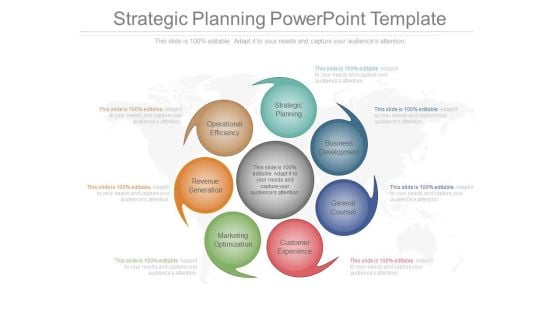
Strategic Planning Powerpoint Template
This is a strategic planning powerpoint template. This is a seven stage process. The stages in this process are strategic planning, business development, general counsel, customer experience, marketing optimization, revenue generation, operational efficiency.
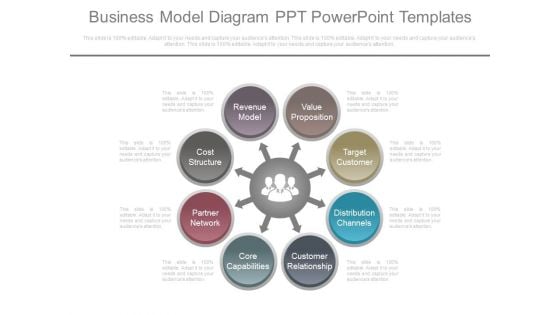
Business Model Diagram Ppt Powerpoint Templates
This is a business model diagram ppt powerpoint templates. This is a eight stage process. The stages in this process are partner network, cost structure, revenue model, value proposition, target customer, distribution channels, customer relationship, core capabilities.
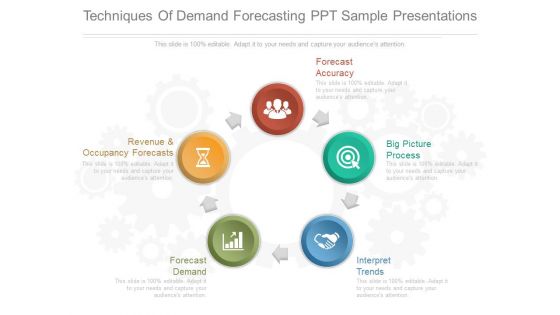
Techniques Of Demand Forecasting Ppt Sample Presentations
This is a techniques of demand forecasting ppt sample presentations. This is a five stage process. The stages in this process are revenue and occupancy forecasts, forecast accuracy, big picture process, interpret trends, forecast demand.


 Continue with Email

 Home
Home


