Revenue

Our Team Ppt PowerPoint Presentation File Vector
This is a our team ppt powerpoint presentation file vector. This is a four stage process. The stages in this process are ceo, designer, manager, financial advisor.
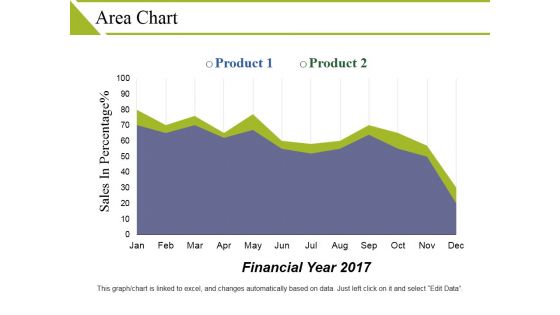
Area Chart Ppt PowerPoint Presentation Outline Objects
This is a area chart ppt powerpoint presentation outline objects. This is a two stage process. The stages in this process are product, sales in percentage, financial year.
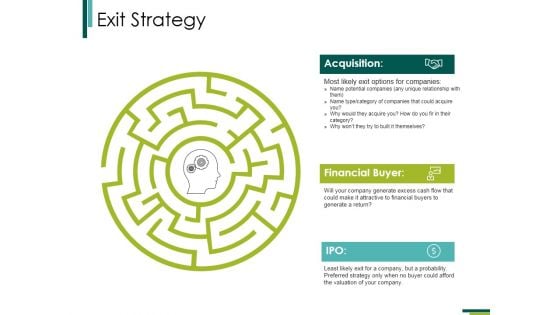
Exit Strategy Ppt PowerPoint Presentation Outline Infographics
This is a exit strategy ppt powerpoint presentation outline infographics. This is a one stage process. The stages in this process are acquisition, financial buyer, ipo.
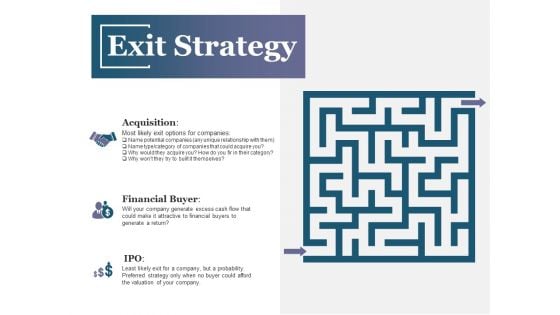
Exit Strategy Ppt PowerPoint Presentation File Ideas
This is a exit strategy ppt powerpoint presentation file ideas. This is a three stage process. The stages in this process are acquisition, financial buyer, ipo, business, marketing.

Exit Strategy Ppt PowerPoint Presentation Slide
This is a exit strategy ppt powerpoint presentation slide. This is a three stage process. The stages in this process are acquisition, financial buyer, ipo.

Exit Strategy Ppt PowerPoint Presentation Styles Information
This is a exit strategy ppt powerpoint presentation styles information. This is a one stage process. The stages in this process are acquisition, financial buyer, ipo.
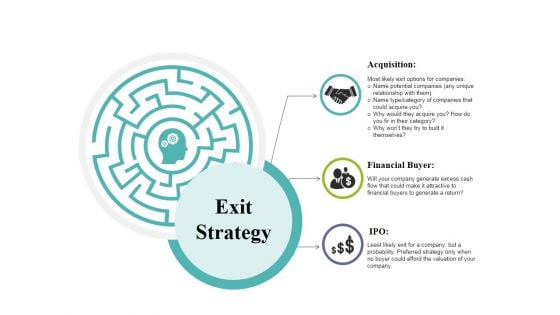
Exit Strategy Ppt PowerPoint Presentation File Templates
This is a exit strategy ppt powerpoint presentation file templates. This is a three stage process. The stages in this process are acquisition, financial buyer, ipo, exit strategy.
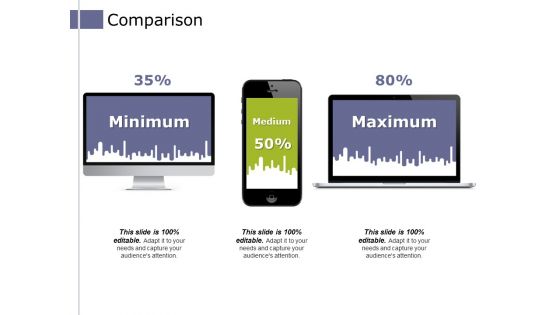
Comparison Ppt PowerPoint Presentation Infographics Example File
This is a comparison ppt powerpoint presentation infographics example file. This is a three stage process. The stages in this process are minimum, medium, maximum, financial, comparison.
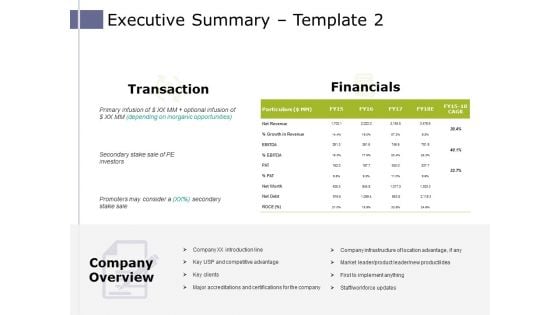
Executive Summary Template 2 Ppt PowerPoint Presentation Professional Microsoft
This is a executive summary template 2 ppt powerpoint presentation professional microsoft. This is a five stage process. The stages in this process are transaction, financials, company overview.

Our Team Ppt PowerPoint Presentation Portfolio Rules
This is a our team ppt powerpoint presentation portfolio rules. This is a four stage process. The stages in this process are ceo, designer, financial, manager, our team.
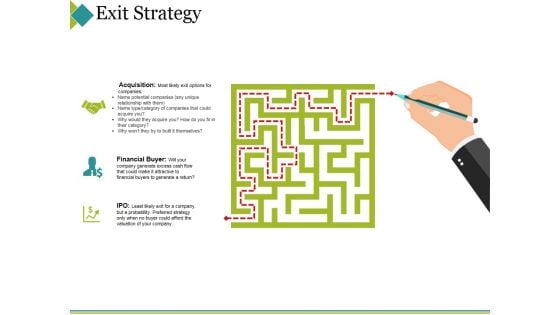
Exit Strategy Ppt PowerPoint Presentation Infographics Graphic Images
This is a exit strategy ppt powerpoint presentation infographics graphic images. This is a three stage process. The stages in this process are acquisition, financial buyer, ipo.
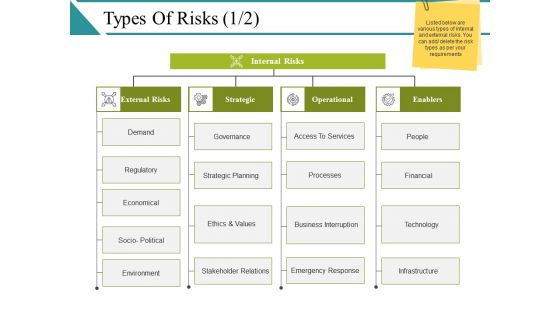
Types Of Risks Ppt PowerPoint Presentation Model Tips
This is a types of risks ppt powerpoint presentation model tips. This is a four stage process. The stages in this process are strategic, operational, hazard, financial.

Our Team Ppt PowerPoint Presentation Layouts Deck
This is a our team ppt powerpoint presentation layouts deck. This is a three stage process. The stages in this process are marketing manager, financial manager, product manager.
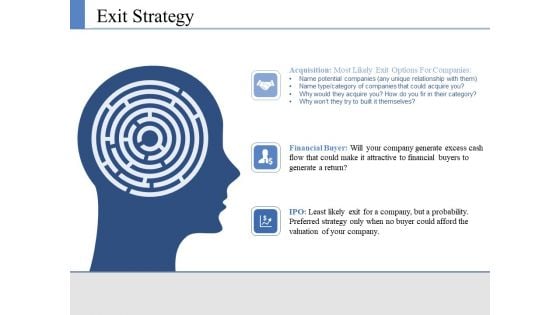
Exit Strategy Ppt PowerPoint Presentation Ideas Grid
This is a exit strategy ppt powerpoint presentation ideas grid. This is a three stage process. The stages in this process are financial buyer, ipo, maze, problem, solution.
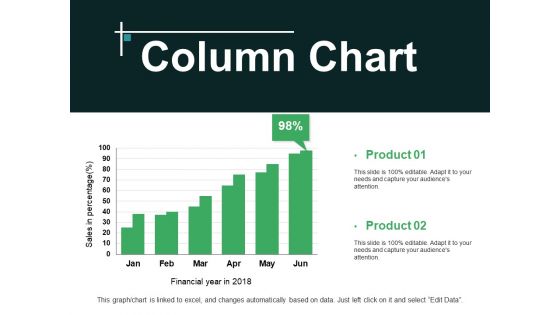
Column Chart Ppt PowerPoint Presentation Professional Aids
This is a column chart ppt powerpoint presentation professional aids. This is a two stage process. The stages in this process are product, sales in percentage, financial years.
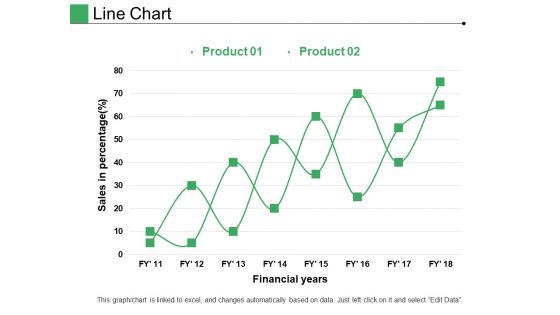
Line Chart Ppt PowerPoint Presentation Pictures Layout
This is a line chart ppt powerpoint presentation pictures layout. This is a two stage process. The stages in this process are product, financial years, sales in percentage.
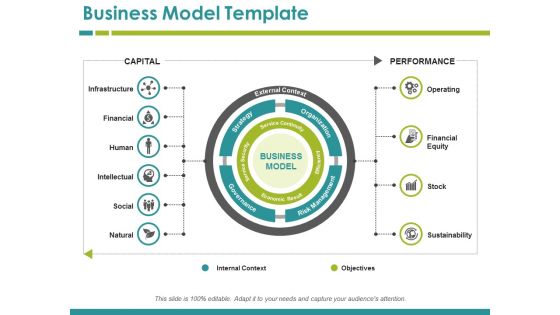
Business Model Template Ppt PowerPoint Presentation Pictures Styles
This is a business model template ppt powerpoint presentation pictures styles. This is a ten stage process. The stages in this process are infrastructure, financial, human, intellectual, social.
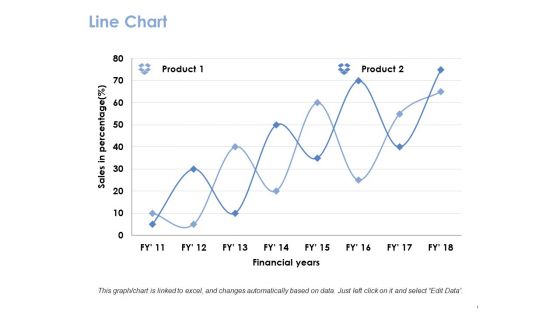
Line Chart Ppt PowerPoint Presentation Gallery Guide
This is a line chart ppt powerpoint presentation gallery guide. This is a two stage process. The stages in this process are product, financial years, sales in percentage.
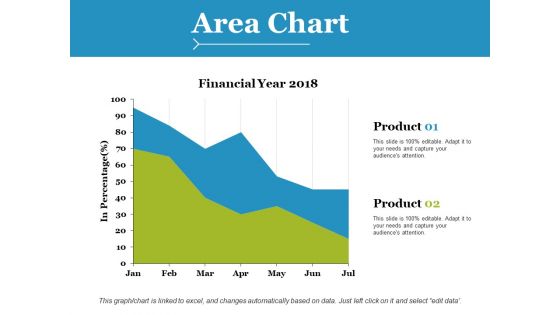
Area Chart Ppt PowerPoint Presentation Styles Brochure
This is a area chart ppt powerpoint presentation styles brochure. This is a two stage process. The stages in this process are product, financial years, in percentage.

Line Chart Ppt PowerPoint Presentation Gallery Example Introduction
This is a line chart ppt powerpoint presentation portfolio shapes. This is a two stage process. The stages in this process are product, financial years, line chart.
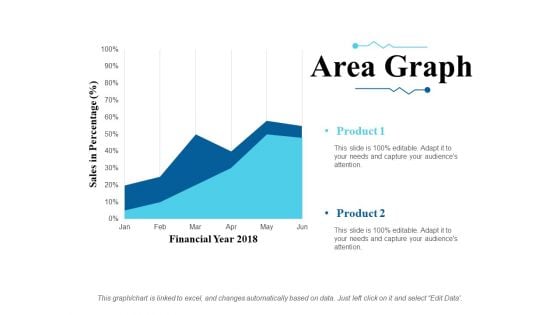
Area Graph Ppt PowerPoint Presentation Slides Ideas
This is a area graph ppt powerpoint presentation slides ideas. This is a two stage process. The stages in this process are sales in percentage, financial year, product.
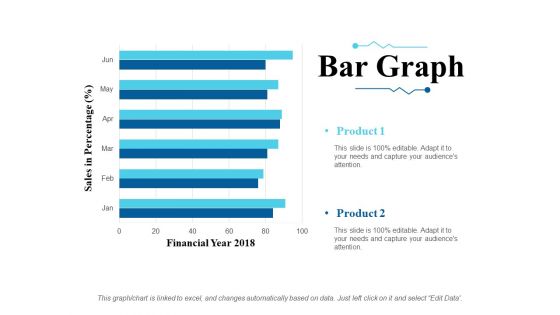
Bar Graph Ppt PowerPoint Presentation Inspiration Slides
This is a bar graph ppt powerpoint presentation inspiration slides. This is a six stage process. The stages in this process are sales in percentage, financial year, product.
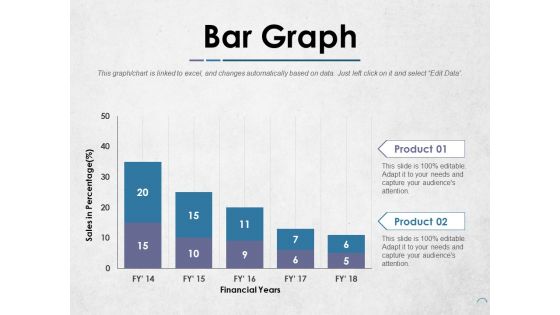
Bar Graph Ppt PowerPoint Presentation Infographics Templates
This is a bar graph ppt powerpoint presentation infographics templates. This is a two stage process. The stages in this process are product, financial years, sales in percentage.
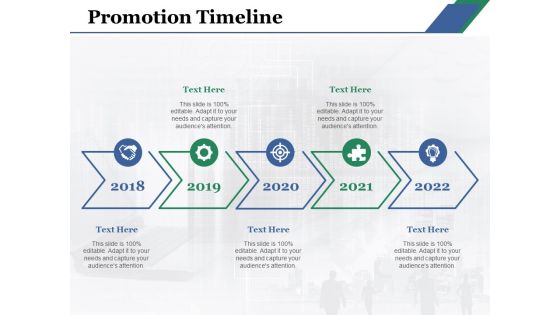
Promotion Timeline Ppt PowerPoint Presentation Styles Shapes
This is a promotion timeline ppt powerpoint presentation styles shapes. This is a five stage process. The stages in this process are promotion, timeline, financial, planning, process.
Timeline Ppt PowerPoint Presentation Icon Graphics Template
This is a timeline ppt powerpoint presentation icon graphics template. This is a six stage process. The stages in this process are timeline, financial, processing, analysis, business.
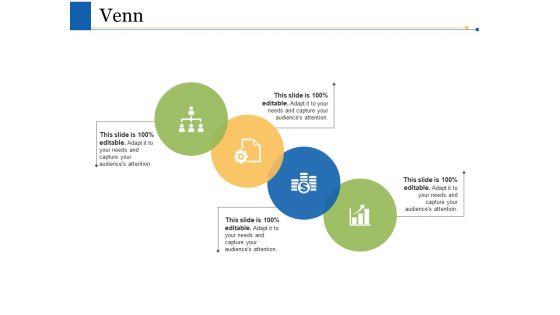
Venn Ppt PowerPoint Presentation Ideas Tips
This is a venn ppt powerpoint presentation ideas tips. This is a four stage process. The stages in this process are venn, financial, strategy, business, planning.
Line Chart Ppt PowerPoint Presentation Icon Inspiration
This is a line chart ppt powerpoint presentation icon inspiration. This is a two stage process. The stages in this process are product, financial years, sales in percentage.
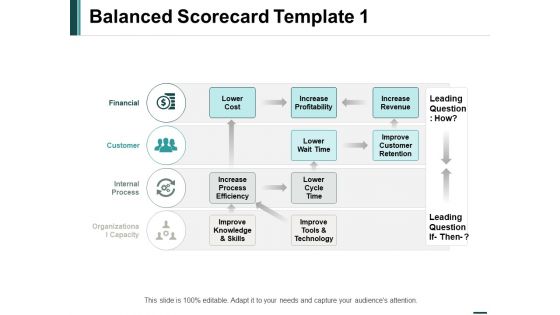
Balanced Scorecard Leading Ppt PowerPoint Presentation Pictures Professional
This is a balanced scorecard leading ppt powerpoint presentation pictures professional. This is a four stage process. The stages in this process are business, management, marketing, process, financial.
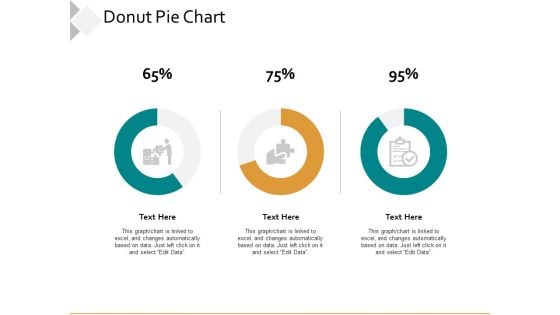
Donut Pie Chart Ppt PowerPoint Presentation Infographics Examples
This is a donut pie chart ppt powerpoint presentation infographics examples. This is a three stage process. The stages in this process are business, management, marketing, financial.

Checkmark Sign On Laptop Ppt PowerPoint Presentation Model Portfolio
This is a checkmark sign on laptop ppt powerpoint presentation model portfolio. This is a one stage process. The stages in this process are financial, planning, fact icon.
Diet Chat Vector Icon Ppt PowerPoint Presentation Ideas Microsoft
This is a diet chat vector icon ppt powerpoint presentation ideas microsoft. This is a one stage process. The stages in this process are financial, planning, fact icon.
Medical Report Vector Icon Ppt PowerPoint Presentation Outline Icons
This is a medical report vector icon ppt powerpoint presentation outline icons. This is a four stage process. The stages in this process are financial, planning, fact icon.
Newspaper Icon On White Background Ppt PowerPoint Presentation Layouts
This is a newspaper icon on white background ppt powerpoint presentation layouts. This is a four stage process. The stages in this process are financial, planning, fact icon.
Verified Document Vector Icon Ppt PowerPoint Presentation Summary Format
This is a verified document vector icon ppt powerpoint presentation summary format. This is a one stage process. The stages in this process are financial, planning, fact icon.
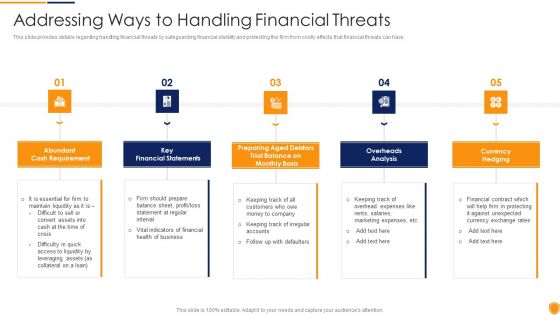
Mitigating Cybersecurity Threats And Vulnerabilities Addressing Ways To Handling Professional PDF
This slide provides details regarding handling financial threats by safeguarding financial stability and protecting the firm from costly effects that financial threats can have. Presenting mitigating cybersecurity threats and vulnerabilities addressing ways to handling professional pdf to provide visual cues and insights. Share and navigate important information on five stages that need your due attention. This template can be used to pitch topics like cash requirement, key financial statements, overheads analysis, currency hedging. In addtion, this PPT design contains high resolution images, graphics, etc, that are easily editable and available for immediate download.
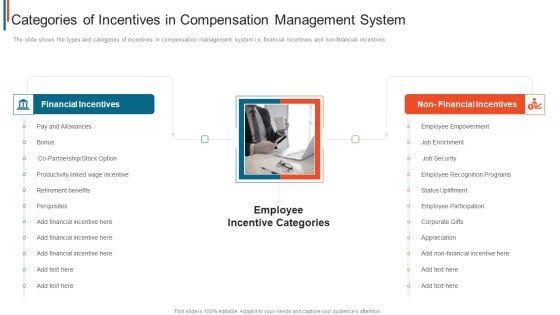
Effective Remuneration Management Talent Acquisition Retention Categories Of Incentives Compensation Mockup PDF
The slide shows the types and categories of incentives in compensation management system i.e. financial incentives and non-financial incentives Presenting effective remuneration management talent acquisition retention categories of incentives compensation mockup pdf to provide visual cues and insights. Share and navigate important information on two stages that need your due attention. This template can be used to pitch topics like financial incentives, non financial incentives, perquisites, retirement benefits. In addtion, this PPT design contains high resolution images, graphics, etc, that are easily editable and available for immediate download.

Applications Of Forensic Accounting And Forensic Accounting Summary PDF
This slide covers use of forensic accounting and investigation for multiple financial crimes. It includes crimes such as bribery, conflict of interest, asset misappropriation and financial statement fraud, omission of transactions, fraudulent financial reporting, etc. Persuade your audience using this Applications Of Forensic Accounting And Forensic Accounting Summary PDF. This PPT design covers three stages, thus making it a great tool to use. It also caters to a variety of topics including Asset Misappropriation, Corruption, Financial Statement Fraud. Download this PPT design now to present a convincing pitch that not only emphasizes the topic but also showcases your presentation skills.
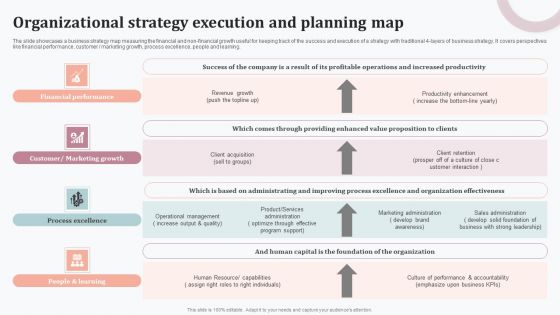
Organizational Strategy Execution And Planning Map Sample PDF
The slide showcases a business strategy map measuring the financial and non-financial growth useful for keeping track of the success and execution of a strategy with traditional 4 layers of business strategy. It covers perspectives like financial performance, customer marketing growth, process excellence, people and learning. Persuade your audience using this Organizational Strategy Execution And Planning Map Sample PDF. This PPT design covers four stages, thus making it a great tool to use. It also caters to a variety of topics including Financial Performance, Customer Marketing Growth, Process Excellence. Download this PPT design now to present a convincing pitch that not only emphasizes the topic but also showcases your presentation skills.
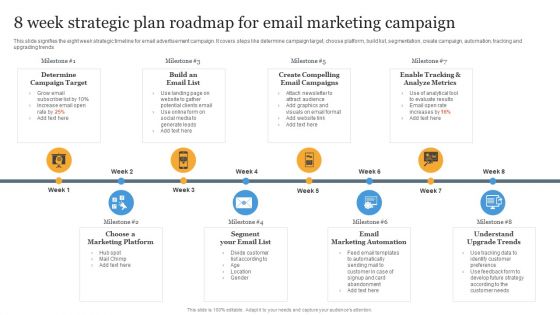
8 Week Strategic Plan Roadmap For Email Marketing Campaign Graphics PDF
This slide signifies the ten weeks timeline for effective financial planning. It covers stages like define financial objectives, gathering financial information, analysis, development and implementation Persuade your audience using this 8 Week Strategic Plan Roadmap For Email Marketing Campaign Graphics PDF. This PPT design covers six stages, thus making it a great tool to use. It also caters to a variety of topics including Financial Objectives, Analysis, Development. Download this PPT design now to present a convincing pitch that not only emphasizes the topic but also showcases your presentation skills.
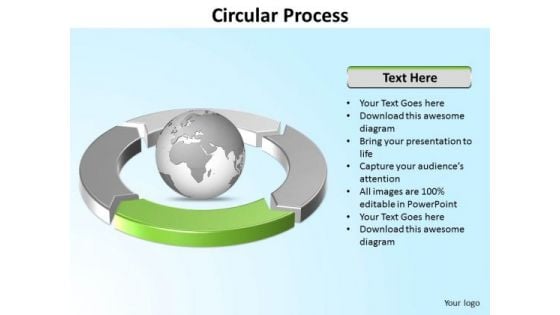
Ppt Four Segments Around Spinning Globe PowerPoint Template Circle Green Templates
PPT four segments around spinning globe powerpoint template circle green Templates-This PowerPoint Diagram can be used to represent worldwide issues such as Global warming, Acid Rain, Poverty, Racism,Obesity, overpopulation. It is illustrated by Green component. This Diagram will fit for Business Presentations.-Can be used for presentations on abstract, achievement, aim, arrow, background, business, chart, communication, company, competition, concept, design, development, diagram, direction, finance, financial, forecast, forward, goal, graph, graphic, growth, icon, illustration, increase, investment, leader, leadership, marketing, motion, moving, path, price, process, profit, progress, progress bar, shape, sign, success, symbol, target, team, teamwork, turquoise blue, up, upward-PPT four segments around spinning globe powerpoint template circle green Templates Compare products and services with our Ppt Four Segments Around Spinning Globe PowerPoint Template Circle Green Templates. You will come out on top.
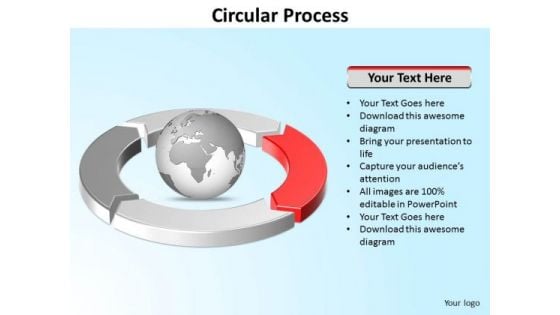
Ppt Four Segments Around Spinning Globe PowerPoint Template Circle Red Templates
PPT four segments around spinning globe powerpoint template circle red Templates-This PowerPoint Diagram can be used to represent worldwide issues such as Global warming, Acid Rain, Poverty, Racism,Obesity, overpopulation etc. It is illustrated by Red component. This Diagram will fit for Business Presentations.-Can be used for presentations on abstract, achievement, aim, arrow, background, business, chart, communication, company, competition, concept, design, development, diagram, direction, finance, financial, forecast, forward, goal, graph, graphic, growth, icon, illustration, increase, investment, leader, leadership, marketing, motion, moving, path, price, process, profit, progress, progress bar, shape, sign, success, symbol, target, team, teamwork, turquoise blue, up, upward-PPT four segments around spinning globe powerpoint template circle red Templates Enter the professional club with our Ppt Four Segments Around Spinning Globe PowerPoint Template Circle Red Templates. You will come out on top.
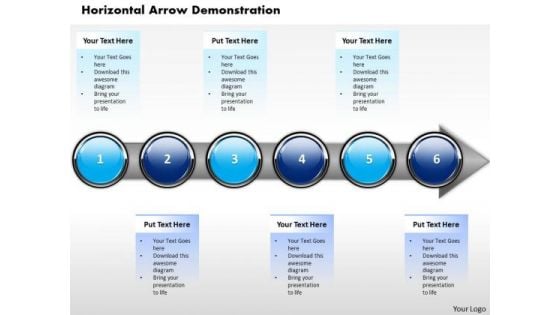
Ppt Horizontal Demonstration Of Finance Process Using 6 Stages PowerPoint Templates
PPT horizontal demonstration of finance process using 6 stages PowerPoint Templates-Use This Horizontally Demonstrated PowerPoint Diagram having six circular boxes on the arrow pointing towards east direction signifying his completion of the process and leading towards success.-PPT horizontal demonstration of finance process using 6 stages PowerPoint Templates-Abstract, Achievement, Aim, Arrow, Background, Business, Chart, Communication, Company, Competition, Concept, Design, Development, Diagram, Direction, Finance, Financial, Forecast, Forward, Goal, Graph, Graphic, Growth, Icon, Illustration, Increase, Investment, Leader, Leadership, Marketing, Motion, Moving, Orange, Path, Price, Process, Profit, Progress, Shape, Sign, Success, Symbol, Target, Team, Teamwork, Up, Upwards Be accurate with your estimates. Our Ppt Horizontal Demonstration Of Finance Process Using 6 Stages PowerPoint Templates will help narrow it down.
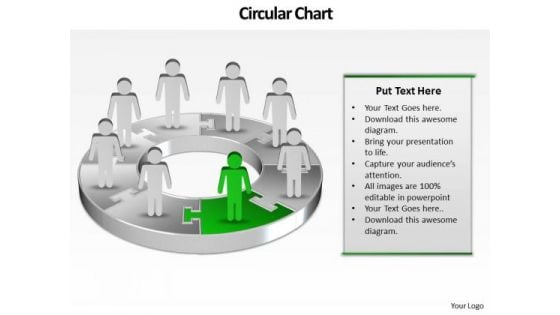
Ppt Pie Family Tree Chart PowerPoint 2003 Person Standing Green Piece Templates
PPT pie family tree chart PowerPoint 2003 person standing green piece Templates-The above Diagram displays a picture of eight circular text boxes placed in sequential manner. This image has been professionally designed to emphasize the concept of Operations performed in Circular process. Adjust the above image in your PPT presentations to visually support your content in your Business PPT slideshows.-PPT pie family tree chart PowerPoint 2003 person standing green piece Templates-arrow, bar, business, businessman, candidate, cartoon, character, chart, circle, circular, client, communication, company, concept, diagram, finance, financial, flow, growth, human, illustration, increase, information, iteration, man, market, marketing, process, processing, profit, sales, statistics, stats, success, target Embrace your dreams with our Ppt Pie Family Tree Chart PowerPoint 2003 Person Standing Green Piece Templates. They will come within your grasp.
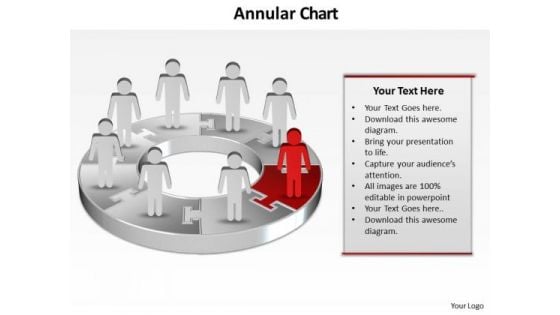
Ppt Pie Gantt Chart PowerPoint Template Person Standing Red Piece Templates
PPT pie Gantt chart PowerPoint template person standing red piece Templates-Develop competitive advantage with our above Diagram which contains a diagram of eight stages organized in Circular Manner. This Highlighted Pink text box shows the sixth step occurring in the process. It is a useful captivating tool enables you to define your message in your Marketing PPT presentations. You can edit text, color, shade and style as per you need.-PPT pie Gantt chart PowerPoint template person standing red piece Templates-arrow, bar, business, businessman, candidate, cartoon, character, chart, circle, circular, client, communication, company, concept, diagram, finance, financial, flow, growth, human, illustration, increase, information, iteration, man, market, marketing, process, processing, profit, sales, statistics, stats, success, target Let us fulfil your presentation needs with our Ppt Pie Gantt Chart PowerPoint Template Person Standing Red Piece Templates. You will be at the top of your game.
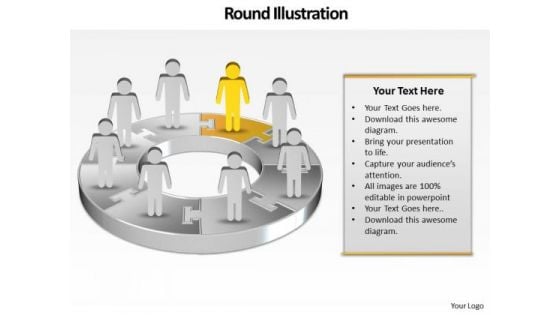
Ppt Team Effort Person Standing Yellow Piece Of Chart PowerPoint Ks2 Templates
PPT team effort person standing yellow piece of chart PowerPoint ks2 Templates-Use this Circular Arrow diagram to show activities that are related to the business plan metrics and monitor the results to determine if the business plan is proceeding as planned. You can apply other 3D Styles and shapes to the slide to enhance your presentations.-PPT team effort person standing yellow piece of chart PowerPoint ks2 Templates-arrow, bar, business, businessman, candidate, cartoon, character, chart, circle, circular, client, communication, company, concept, diagram, finance, financial, flow, growth, human, illustration, increase, information, iteration, man, market, marketing, process, processing, profit, sales, statistics, stats, success, target Feature your views with our Ppt Team Effort Person Standing Yellow Piece Of Chart PowerPoint Ks2 Templates. They will get the desired exposure.
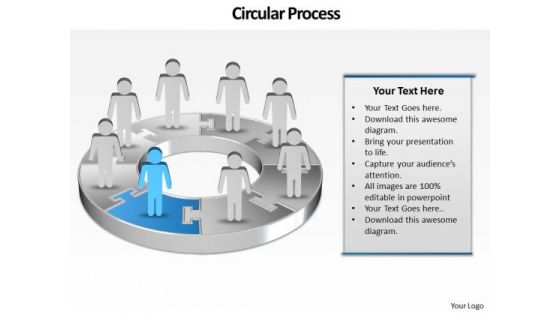
Ppt Team Work Person Standing Red Blue PowerPoint Template Piece Templates
PPT team work person standing red blue PowerPoint template piece Templates-This PowerPoint Diagram shows you the Successive Representation of Eight approaches through people standing on puzzle pieces which are combined to form circle. It shows the successive concepts used in a procedure. You can change color, size and orientation of any icon to your liking.-PPT team work person standing red blue PowerPoint template piece Templates-arrow, bar, business, businessman, candidate, cartoon, character, chart, circle, circular, client, communication, company, concept, diagram, finance, financial, flow, growth, human, illustration, increase, information, iteration, man, market, marketing, process, processing, profit, sales, statistics, stats, success, target Clear the blocks for your thoughts. Open up the pipeline with our Ppt Team Work Person Standing Red Blue PowerPoint Template Piece Templates.
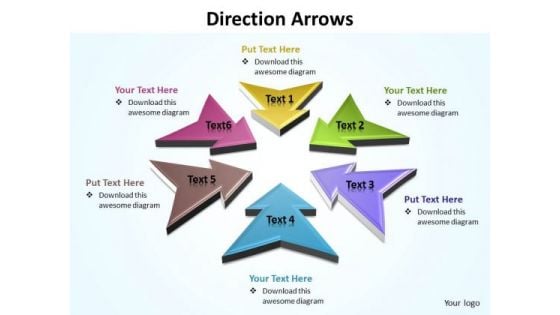
Ppt Direction Arrows Diagram PowerPoint Free Editable Templates
PPT direction arrows diagram powerpoint free editable templates-Create stunning Microsoft office PPT Presentations with our professional templates containing a graphic of multicolored arrows. This image has been professionally designed to emphasize the concept of interrelated business issues. This awesome image makes your presentations simpler and professional. This PPT image is an effective tool to make your clients understand the concept.-PPT direction arrows diagram powerpoint free editable templates-Abstract, Achievement, Aim, Arrow, Background, Business, Chart, Communication, Competition, Concept, Design, Direction, Development, Diagram, Direction, Finance, Financial, Forecast, Forward, Goal, Graph, Graphic, Growth, Icon, Illustration, Increase, Investment, Leader, Leadership, Design, Marketing, Price, Process, Profit, Progress, Progress, Shape, Sign, Success, Symbol, Target, Team, Teamwork Our Ppt Direction Arrows Diagram PowerPoint Free Editable Templates will exhort you on. Establish new boundaries with your ideas.
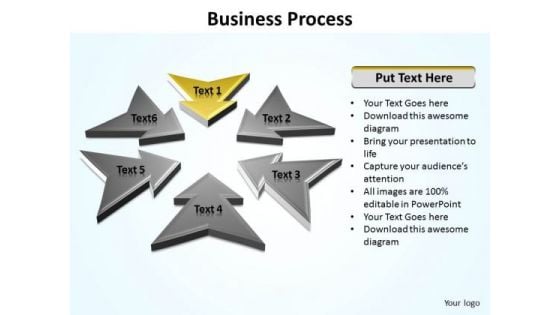
Ppt Direction Arrows Fashion Design PowerPoint Presentation Editable Templates
PPT direction arrows fashion design powerpoint presentation editable Templates-Visually support your Microsoft office PPT Presentation with our above template illustrating arrows in a circle pointing towards the center. This image represents the concept common goal. It is a useful captivating tool conceived to enable you to define your message in your business and finance PPT presentations. Create captivating presentations to deliver comparative and weighted arguments.-PPT direction arrows fashion design powerpoint presentation editable Templates-Abstract, Achievement, Aim, Arrow, Background, Business, Chart, Communication, Competition, Concept, Design, Direction, Development, Diagram, Direction, Finance, Financial, Forecast, Forward, Goal, Graph, Graphic, Growth, Icon, Illustration, Increase, Investment, Leader, Leadership, Design, Marketing, Price, Process, Profit, Progress, Progress, Shape, Sign, Success, Symbol, Target, Team, Teamwork Avoid any clutter in your thoughts. Concentrate on absolute essentials with our Ppt Direction Arrows Fashion Design PowerPoint Presentation Editable Templates.
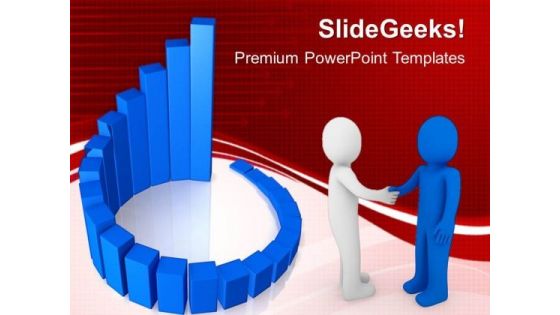
Circular Bar Graph Business Success PowerPoint Templates And PowerPoint Themes 1012
Circular Bar Graph Business Success PowerPoint Templates And PowerPoint Themes 1012-The above template displays a diagram of blue circular progress bars. This image represent the concept of business growth and success. This template imitates economy, finance, global, goal, growth, ideas, information, management, profit and statistics. This image has been conceived to enable you to emphatically communicate your ideas in your Business and Marketing PPT presentations. Use this template for financial analysis, business reviews and statistics. Go ahead and add charm to your presentations with our high quality template.-Circular Bar Graph Business Success PowerPoint Templates And PowerPoint Themes 1012-This PowerPoint template can be used for presentations relating to-Circular success graph, marketing, business, finance, success, circle charts Fashion your plans on our Circular Bar Graph Business Success PowerPoint Templates And PowerPoint Themes 1012. They will always keep you in contention.
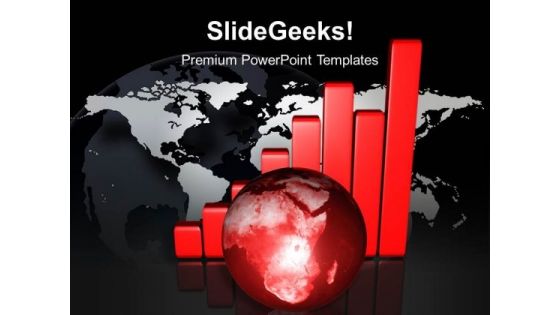
Growth Bar Graph With Earth PowerPoint Templates And PowerPoint Themes 1012
Growth Bar Graph With Earth PowerPoint Templates And PowerPoint Themes 1012-Create stunning Microsoft office PPT Presentations with our professional templates containing a graphic of a rising chart graph predicts global worldwide growth with a globe as symbol of success and financial, business. This image has been conceived to enable you to emphatically communicate your ideas in your Business PPT presentations. Our PPT images are so ideally designed that it reveals the very basis of our PPT template are an effective tool to make your clients understand.-Growth Bar Graph With Earth PowerPoint Templates And PowerPoint Themes 1012-This PowerPoint template can be used for presentations relating to-Global profit growth charts with world globe, success, business, finance, marketing, globe Examine the causes with our Growth Bar Graph With Earth PowerPoint Templates And PowerPoint Themes 1012. Let everyone know what's behind it all.
Growth Chart Business PowerPoint Templates And PowerPoint Themes 1012
Growth Chart Business PowerPoint Templates And PowerPoint Themes 1012-The above template displays a diagram of a colorful business chart outgoing. This image has been professionally designed to emphasize business concept. It signifies chart, finance, future, growth, profit, progress, statistics and success. Adjust the above image in your PPT presentations to visually support your content in your Marketing and Financial PPT slideshows. Our PPT images are so ideally designed that it reveals the very basis of our PPT template are an effective tool to make your clients understand.-Growth Chart Business PowerPoint Templates And PowerPoint Themes 1012-This PowerPoint template can be used for presentations relating to-Business growth and success graph, finance, business, success, competition, arrows Our Growth Chart Business PowerPoint Templates And PowerPoint Themes 1012 will get you all animated. You will become eager to assert your views.
Computer Tablet With Graph Business PowerPoint Templates And PowerPoint Themes 1012
Computer Tablet With Graph Business PowerPoint Templates And PowerPoint Themes 1012-Develop competitive advantage with our above template which contains a diagram of computer tablet with bra graph showing success and growth. It portrays the concept of account, balance, business, data, economy, finance, graph, growth, information, investment, market, profit, report, research, statistics and success. Adjust the above image in your PPT presentations to visually support your content in your Business and Financial PPT slideshows. Present your views using our innovative slides and be assured of leaving a lasting impression.-Computer Tablet With Graph Business PowerPoint Templates And PowerPoint Themes 1012-This PowerPoint template can be used for presentations relating to-Computer Tablet With Graph, Arrows, Finance, Business, Marketing, Symbol Our Computer Tablet With Graph Business PowerPoint Templates And PowerPoint Themes 1012 will keep the faith. They will show allegiance to your thoughts.
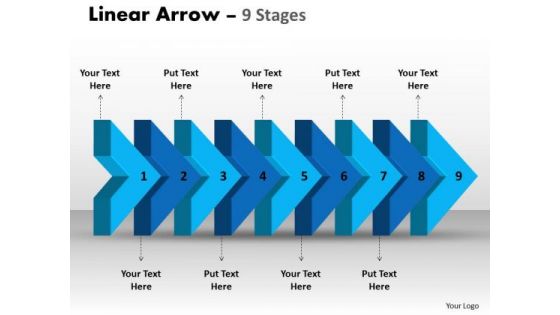
Ppt Theme Beeline Work Flow Chart PowerPoint Arrow Network Diagram Template 1 Image
We present our PPT Theme beeline work flow Chart PowerPoint arrow network diagram template 1 Image. Use our Arrows PowerPoint Templates because, you understand how each drives the next to motor the entire sequence. Use our Symbol PowerPoint Templates because, Bullet-point your thoughts and ideas to profitably accomplish every step of every stage along the way. Use our Business PowerPoint Templates because, Timelines Template: - Getting it done may not be enough. Use our Process and Flows PowerPoint Templates because, All elements of the venture are equally critical. Use our Marketing PowerPoint Templates because, an occasion for gifting and giving. Use these PowerPoint slides for presentations relating to Arrow, Background, Business, Chart, Diagram, Financial, Graphic, Gray, Icon, Illustration, Management, Perspective, Process, Reflection, Stage, Text, Transparency. The prominent colors used in the PowerPoint template are Blue, Blue navy, Gray Capture success with our Ppt Theme Beeline Work Flow Chart PowerPoint Arrow Network Diagram Template 1 Image. You will come out on top.
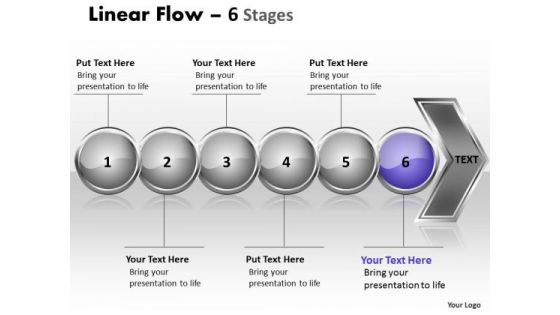
Business Ppt Theme Continual Illustration Graphical Of 6 Issues 7
We present our Business PPT Theme continual illustration Graphical of 6 issues 7.Use our Spheres PowerPoint Templates because, Cycle Template: - Rolling along while gathering profits along the way is the aim. Use our Symbol PowerPoint Templates because, Many a core idea has various enveloping layers. Use our Arrows PowerPoint Templates because, Timelines Template: - Getting it done may not be enough. Use our Metaphor PowerPoint Templates because, But it cannot be gained to desired levels in one go. Use our Business PowerPoint Templates because, Marketing Strategy Business Template:- Maximizing sales of your product is the intended destination. Use these PowerPoint slides for presentations relating to Arrow, Background, Business, Chart, Diagram, Financial, Flow, Graphic, Gray, Icon, Illustration, Linear, Management, Orange, Perspective, Process, Reflection, Spheres, Stage, Text. The prominent colors used in the PowerPoint template are Purple, Gray, and Black Your team will get faithfully behind you. Assume control with our Business Ppt Theme Continual Illustration Graphical Of 6 Issues 7.
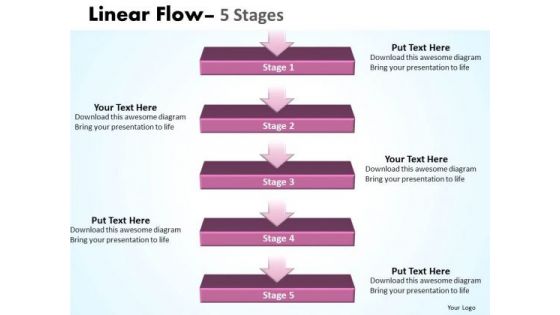
Editable Ppt Theme Hierarchical Model Of 5 Stages 1 Design
We present our editable PPT Theme hierarchical model of 5 stages 1 design. Use our Symbol PowerPoint Templates because; demonstrate how they contribute to the larger melting pot. Use our Layers PowerPoint Templates because, to take it along a sure fire road to good profit. Use our Business PowerPoint Templates because; illustrate how each element flows seamlessly onto the next stage. Use our Metaphor PowerPoint Templates because, the alphabetical order is a time honored concept. Use our Arrows PowerPoint Templates because; Help them develop their thoughts along the way. Use these PowerPoint slides for presentations relating to Arrow, Background, Business, Chart, Diagram, Financial, Flow, Graphic, Gray, Icon, Illustration, Linear, Management, Orange, Perspective, Process, Reflection, Spheres, Stage, Text. The prominent colors used in the PowerPoint template are Purple, Pink, and White Our Editable Ppt Theme Hierarchical Model Of 5 Stages 1 Design have a fetish for excellence. They just can't settle for anything less.
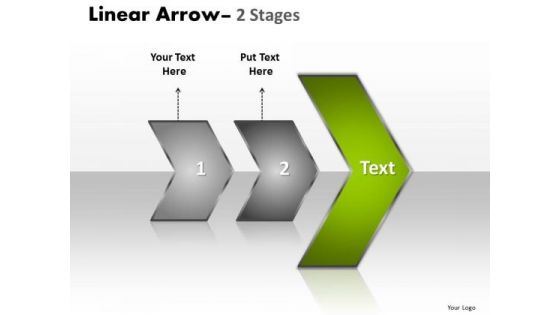
Ppt Template Two Stages Linear World Trade Presentation PowerPoint Tips Strategy 4 Graphic
We present our PPT template two stages linear world trade presentation PowerPoint tips strategy 4 Graphic. Use our Abstract PowerPoint Templates because, Brilliant ideas popping up all over the place. Use our Business PowerPoint Templates because; Shower them with the wisdom of your words. Use our Arrows PowerPoint Templates because, the foundation stones of many a life. Use our Process and Flows PowerPoint Templates because, To take it along a sure fire road to good profit. Use our Symbol PowerPoint Templates because, Stable ideas are the building blocks of a successful structure. Use these PowerPoint slides for presentations relating to Arrow, Background, Business, Chart, Diagram, Financial, Flow, Graphic, Gray, Icon, Illustration, Linear, Management, Orange, Perspective, Process, Reflection, Spheres, Stage, Text. The prominent colors used in the PowerPoint template are Green, Gray, and Black Encourage the enthusiasm in your team. Spur them on with our Ppt Template Two Stages Linear World Trade Presentation PowerPoint Tips Strategy 4 Graphic.
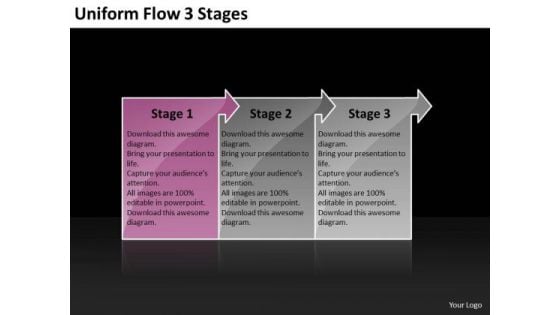
Uniform Flow 3 Stages Technical Chart PowerPoint Templates
We present our uniform flow 3 stages technical chart PowerPoint templates. Use our Arrows PowerPoint Templates because, Set out the goals and your plan of action for them. Use our Symbol PowerPoint Templates because, Business Template:- There is a vision, a need you can meet. Use our Business PowerPoint Templates because, Amplify on your plans to have dedicated sub groups working on related but distinct tasks. Use our Metaphor PowerPoint Templates because, Readymade PowerPoint templates for slides to show. Use our Process and Flows PowerPoint Templates because, Cycle Template: - Rolling along while gathering profits along the way is the aim. Use these PowerPoint slides for presentations relating to Reinforcing, Arrow, Background, Business, Chart, Diagram, Financial, Graphic, Gray, Icon, Illustration, Management, Orange, Perspective, Planning, Process, Stages, Steps, Text. The prominent colors used in the PowerPoint template are Pink, Gray, and Black Give an exhaustive account with our Uniform Flow 3 Stages Technical Chart PowerPoint Templates. Your thoughts will illuminate every little detail.
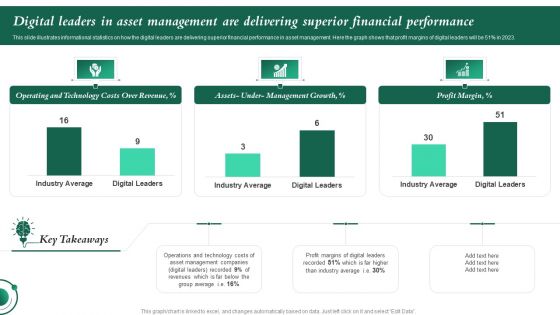
Digital Leaders In Asset Management Are Deliverin Erformance Investment In Latest Technology To Ensure Ideas PDF
This slide illustrates informational statistics on how the digital leaders are delivering superior financial performance in asset management. Here the graph shows that profit margins of digital leaders will be 51 PRECENT in 2023.This Digital Leaders In Asset Management Are Deliverin Erformance Investment In Latest Technology To Ensure Ideas PDF is perfect for any presentation, be it in front of clients or colleagues. It is a versatile and stylish solution for organizing your meetings. The product features a modern design for your presentation meetings. The adjustable and customizable slides provide unlimited possibilities for acing up your presentation. Slidegeeks has done all the homework before launching the product for you. So, do not wait, grab the presentation templates today.
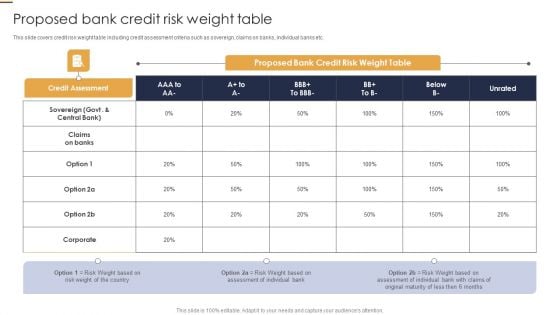
Proposed Bank Credit Risk Weight Table Credit Risk Analysis Model For Banking Institutions Rules PDF
This slide shows the principal risks components financial risk, business risk, management risk and key parameters leverage, liquidity, profitability, etc..Whether you have daily or monthly meetings, a brilliant presentation is necessary. Proposed Bank Credit Risk Weight Table Credit Risk Analysis Model For Banking Institutions Rules PDF can be your best option for delivering a presentation. Represent everything in detail using Proposed Bank Credit Risk Weight Table Credit Risk Analysis Model For Banking Institutions Rules PDF and make yourself stand out in meetings. The template is versatile and follows a structure that will cater to your requirements. All the templates prepared by Slidegeeks are easy to download and edit. Our research experts have taken care of the corporate themes as well. So, give it a try and see the results.

Coca Cola Emotional Marketing Strategy Affect Of Consumer Emotions On Brands Kpis Inspiration PDF
This slide showcases assessing key indicators for measuring financial performance of brand. It provides details about turnover, marketing costs, sales, administrative expenses, profit, percentage turnover, trade debtor days, headcount, etc. Create an editable Coca Cola Emotional Marketing Strategy Affect Of Consumer Emotions On Brands Kpis Inspiration PDF that communicates your idea and engages your audience. Whether youre presenting a business or an educational presentation, pre-designed presentation templates help save time. Coca Cola Emotional Marketing Strategy Affect Of Consumer Emotions On Brands Kpis Inspiration PDF is highly customizable and very easy to edit, covering many different styles from creative to business presentations. Slidegeeks has creative team members who have crafted amazing templates. So, go and get them without any delay.


 Continue with Email

 Home
Home


