Risk Framework
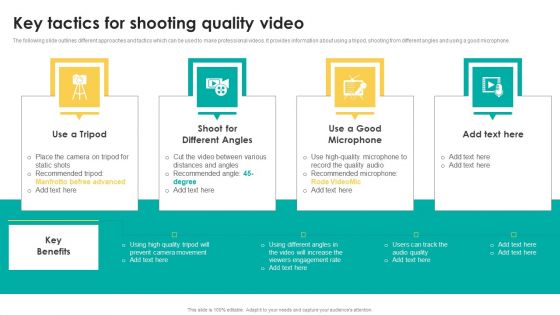
Key Tactics For Shooting Quality Video Infographics PDF
The following slide outlines different approaches and tactics which can be used to make professional videos. It provides information about using a tripod, shooting from different angles and using a good microphone. Do you have to make sure that everyone on your team knows about any specific topic I yes, then you should give Key Tactics For Shooting Quality Video Infographics PDF a try. Our experts have put a lot of knowledge and effort into creating this impeccable Key Tactics For Shooting Quality Video Infographics PDF. You can use this template for your upcoming presentations, as the slides are perfect to represent even the tiniest detail. You can download these templates from the Slidegeeks website and these are easy to edit. So grab these today.
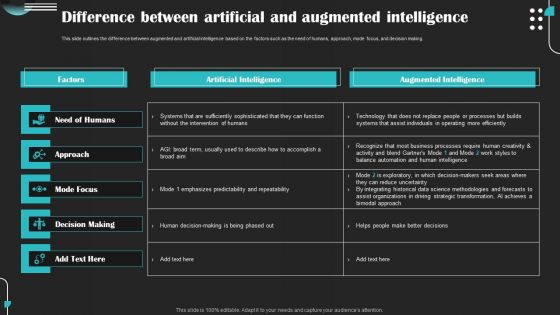
Intelligence Amplification IA IT Difference Between Artificial And Augmented Intelligence Download PDF
This slide outlines the difference between augmented and artificial intelligence based on the factors such as the need of humans, approach, mode focus, and decision making. Do you have to make sure that everyone on your team knows about any specific topic I yes, then you should give Intelligence Amplification IA IT Difference Between Artificial And Augmented Intelligence Download PDF a try. Our experts have put a lot of knowledge and effort into creating this impeccable Intelligence Amplification IA IT Difference Between Artificial And Augmented Intelligence Download PDF. You can use this template for your upcoming presentations, as the slides are perfect to represent even the tiniest detail. You can download these templates from the Slidegeeks website and these are easy to edit. So grab these today
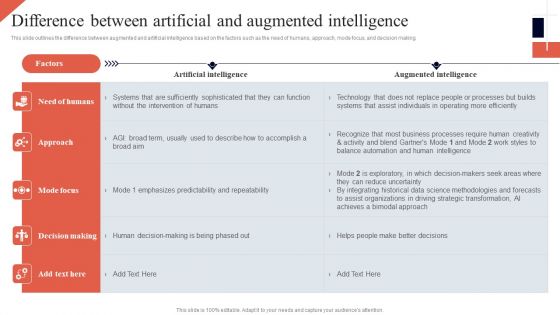
Cognitive Enhancement Difference Between Artificial Augmented Intelligence Graphics PDF
This slide outlines the difference between augmented and artificial intelligence based on the factors such as the need of humans, approach, mode focus, and decision making. Do you have to make sure that everyone on your team knows about any specific topic I yes, then you should give Cognitive Enhancement Difference Between Artificial Augmented Intelligence Graphics PDF a try. Our experts have put a lot of knowledge and effort into creating this impeccable Cognitive Enhancement Difference Between Artificial Augmented Intelligence Graphics PDF. You can use this template for your upcoming presentations, as the slides are perfect to represent even the tiniest detail. You can download these templates from the Slidegeeks website and these are easy to edit. So grab these today.
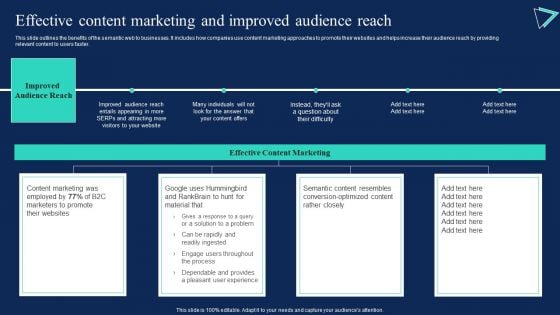
Enterprise Information Web Standards Effective Content Marketing Information PDF
This slide outlines the benefits of the semantic web to businesses. It includes how companies use content marketing approaches to promote their websites and helps increase their audience reach by providing relevant content to users faster. Are you in need of a template that can accommodate all of your creative concepts This one is crafted professionally and can be altered to fit any style. Use it with Google Slides or PowerPoint. Include striking photographs, symbols, depictions, and other visuals. Fill, move around, or remove text boxes as desired. Test out color palettes and font mixtures. Edit and save your work, or work with colleagues. Download Enterprise Information Web Standards Effective Content Marketing Information PDF and observe how to make your presentation outstanding. Give an impeccable presentation to your group and make your presentation unforgettable.
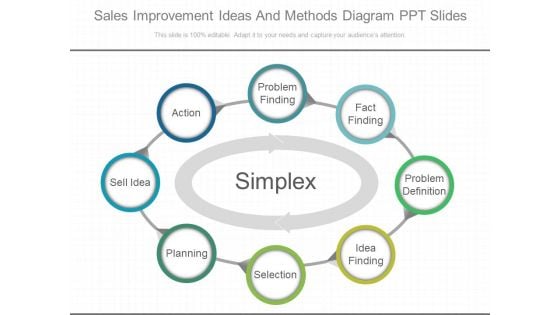
Sales Improvement Ideas And Methods Diagram Ppt Slides
This is a sales improvement action plan diagram ppt slides. This is a eight stage process. The stages in this process are simplex, problem finding, fact finding, problem definition, idea finding, selection, planning, sell idea, action.
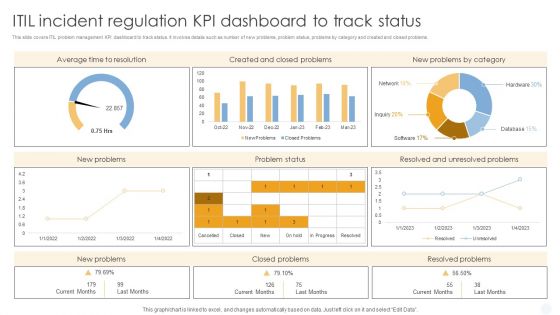
ITIL Incident Regulation Kpi Dashboard To Track Status Mockup PDF
This slide covers ITIL problem management KPI dashboard to track status. It involves details such as number of new problems, problem status, problems by category and created and closed problems.Showcasing this set of slides titled ITIL Incident Regulation Kpi Dashboard To Track Status Mockup PDF. The topics addressed in these templates are Average Time Resolution, Created Problems, Problems Category. All the content presented in this PPT design is completely editable. Download it and make adjustments in color, background, font etc. as per your unique business setting.

Back To School Education PowerPoint Backgrounds And Templates 1210
Microsoft PowerPoint Template and Background with 3d render of an apple, laptop and books Delve on the cold facts in detail. Explain the factual analysis on our Back To School Education PowerPoint Backgrounds And Templates 1210.

Virus Science PowerPoint Templates And PowerPoint Backgrounds 0311
Microsoft PowerPoint Template and Background with detailed virus view inside the body Delve on the cold facts in detail. Explain the factual analysis on our Virus Science PowerPoint Templates And PowerPoint Backgrounds 0311.
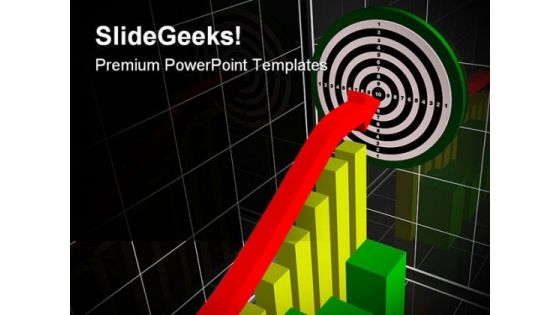
Performance Chart Business PowerPoint Templates And PowerPoint Backgrounds 0311
Microsoft PowerPoint Template and Background with business picture about analysis graph arrow and target Illustrate the essential elements of the project. Delve into the basic nature with our Performance Chart Business PowerPoint Templates And PowerPoint Backgrounds 0311.
Graph01 Finance PowerPoint Templates And PowerPoint Backgrounds 0511
Microsoft PowerPoint Template and Background with financial computing deskto computer with bar chart Delve on the cold facts in detail. Explain the factual analysis on our Graph01 Finance PowerPoint Templates And PowerPoint Backgrounds 0511.

Idea Success PowerPoint Templates And PowerPoint Backgrounds 0511
Microsoft PowerPoint Template and Background with concept box in plastic style with idea analysis success text Earn accolades with our Idea Success PowerPoint Templates And PowerPoint Backgrounds 0511. Download without worries with our money back guaranteee.

Investor Report Finance PowerPoint Templates And PowerPoint Backgrounds 0711
Microsoft PowerPoint Template and Background with stock market charts for investor analysis Our Investor Report Finance PowerPoint Templates And PowerPoint Backgrounds 0711 can be aesthetically appealing. Expose your audience to the art of beauty.
Database System PowerPoint Icon Cc
Microsoft PowerPoint Template and Background with database system for reports and data analysis Underline your erudition with our Database System PowerPoint Icon Cc. They will project your considerable expertise.
Database System PowerPoint Icon F
Microsoft PowerPoint Template and Background with database system for reports and data analysis Give them a big deal with our Database System PowerPoint Icon F. The audience will be unabashedly appreciative.
Database System PowerPoint Icon R
Microsoft PowerPoint Template and Background with database system for reports and data analysis Our Database System PowerPoint Icon R are self explanatory. What you get is what you see.
Database System PowerPoint Icon C
Microsoft PowerPoint Template and Background with database system for reports and data analysis Our Database System PowerPoint Icon C have fantastic ability. They will have an astounding effect on the audience.
Database System PowerPoint Icon S
Microsoft PowerPoint Template and Background with database system for reports and data analysis Never fail to impress with our Database System PowerPoint Icon S. You will be at the top of your game.
Yellow Daises PowerPoint Icon R
Microsoft PowerPoint Template and Background with yellow gerber isolated against a blue sky Delve on the cold facts in detail. Explain the factual analysis on our Yellow Daises PowerPoint Icon R.

Target Concept Success PowerPoint Templates And PowerPoint Backgrounds 0811
Microsoft PowerPoint Template and Background with target concept red thumbtack placed in the center Delve on the cold facts in detail. Explain the factual analysis on our Target Concept Success PowerPoint Templates And PowerPoint Backgrounds 0811.

Blue Tit Fledgling Nature PowerPoint Themes And PowerPoint Slides 0211
Microsoft PowerPoint Theme and Slide with blue tit fledgling bird Delve on the cold facts in detail. Explain the factual analysis on our Blue Tit Fledgling Nature PowerPoint Themes And PowerPoint Slides 0211.

Idea Success PowerPoint Themes And PowerPoint Slides 0511
Microsoft PowerPoint Theme and Slide with concept box in plastic style with idea analysis success text Get enthusiastic with our Idea Success PowerPoint Themes And PowerPoint Slides 0511. Encourage your team to better performances.

Bar Graph For Business Growth Powerpoint Templates
This PowerPoint slide contains graphics bar chart. This slide helps to exhibit business growth analysis. Sparkling thoughts are swirling around in your head. Filter them through with this diagram slide.
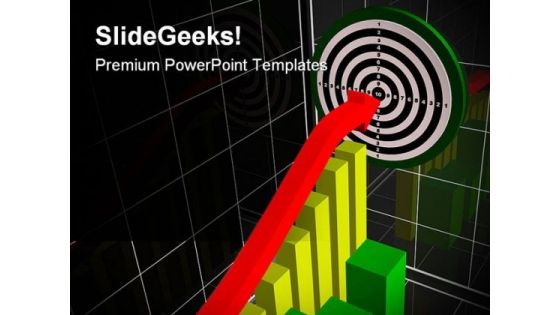
Performance Chart Business PowerPoint Themes And PowerPoint Slides 0311
Microsoft PowerPoint Theme and Slide with business picture about analysis graph arrow and target Your ideas will flower with our Performance Chart Business PowerPoint Themes And PowerPoint Slides 0311. Your brilliance will begin to bloom.
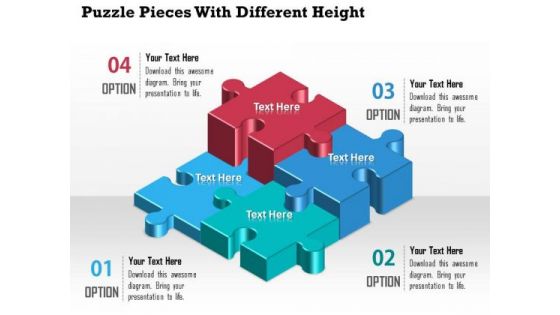
Business Diagram Puzzle Pieces With Different Height Presentation Template
A professional bar graph has been crafted with graphic of puzzles. All these puzzles are in different heights which shows the various levels of any data result representations. Use this diagram for your business result and data analysis related topics.
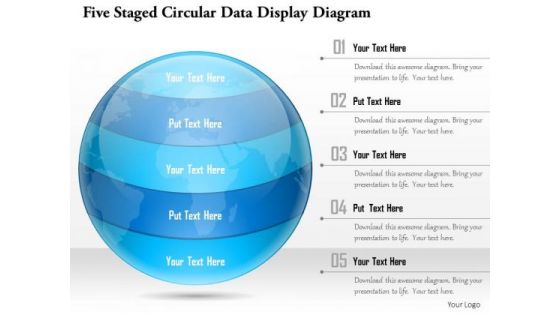
Business Diagram Five Staged Circular Data Display Diagram Presentation Template
This Power Point template slide has been crafted with graphic of five staged circular diagram. This PPT slide contains the concept of data analysis and representation. This PPT slide can be used for business data presentations.

Business Diagram Seven Staged Circular Ribbon Text Box Diagram Presentation Template
This Power Point template slide has been used to display the concept of business data analysis. This PPT slide contains the graphic of seven staged circular ribbon style text boxes. Use this PPT slide for your business presentations.
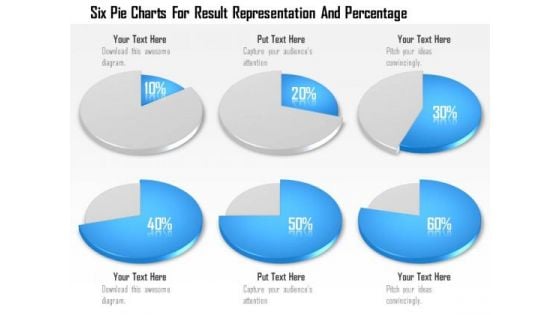
Business Diagram Six Pie Charts For Result Representation And Percentage Presentation Template
Display the concept of result analysis in your business presentation. This PPT slide contains the graphic of six pie charts. Use this PPT slide for your business and marketing data related presentations.
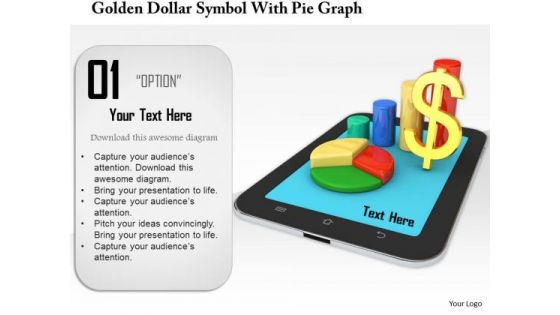
Stock Photo Golden Dollar Symbol With Pie Graph PowerPoint Slide
This Power Point template has been crafted with graphic of golden dollar symbol and pie chart on a tablet. Display the concept of financial data analysis with this image. Use this image to present financial reports in business presentations.
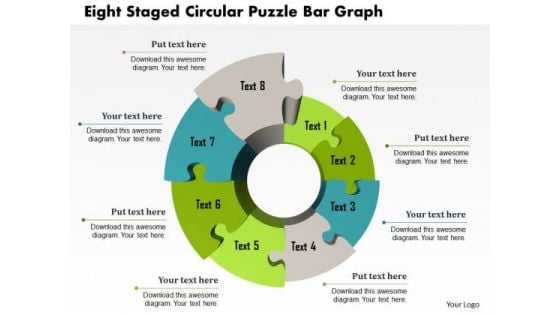
Business Diagram Eight Staged Circular Puzzle Bar Graph Presentation Template
This Power Point template has been crafted with graphic of eight staged circular puzzle and bar graph. This PPT contains the financial result analysis related concept. Use this PPT for your business and success related presentations.
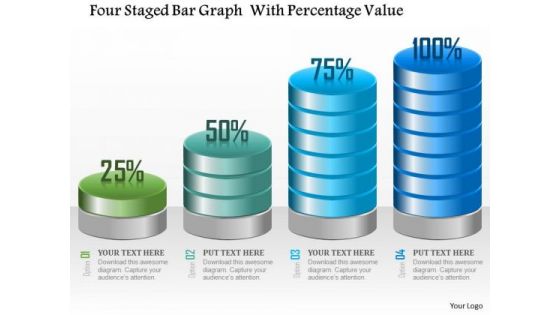
Business Diagram Four Staged Bar Graph With Percentage Value Presentation Template
Four staged bar graph with percentage value has been used to craft this power point template. This PPT contains the concept of making financial timeline and result analysis. This PPT can be used for business and finance related presentations.
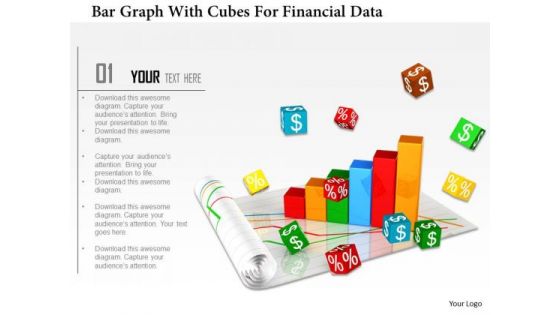
Stock Photo Bar Graph With Cubes For Financial Data PowerPoint Slide
Graphic of bar graph and cubes are used to decorate this image template. This PPT contains the concept of financial data analysis. Use this PPT for finance and business related presentations.
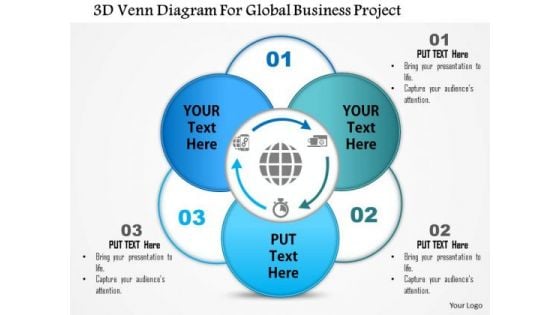
Business Diagram 3d Venn Diagram For Global Business Project Presentation Template
This business diagram displays 3d Venn diagram. This editable slide is suitable to present business reports. Use this diagram for business and finance related topics and display complete data analysis in your presentation.
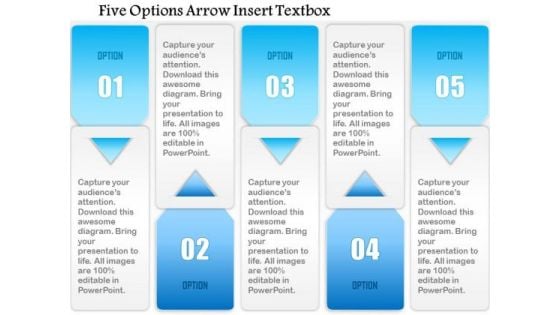
Business Diagram Five Options Arrow Insert Textbox Presentation Template
This PowerPoint template displays textbox diagram. This business diagram contains five points textboxes. Use this diagram, in your presentations to display timeline, strategy, icons and business analysis. Create professional presentations using this professional slide.
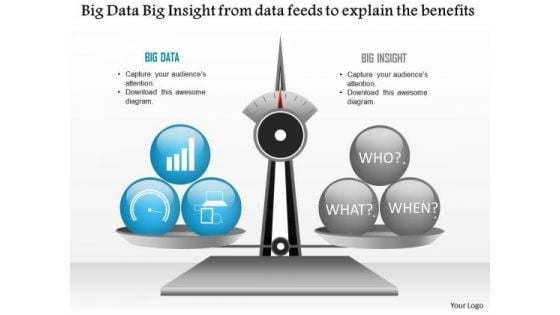
Business Diagram Big Data Big Insight From Data Feeds To Explain The Benefits Ppt Slide
Explain the benefits of big data analysis and data feeds with this technology diagram. This slide contains the graphic of scale with big data and big insight. Use this slide your data information and measurement related presentations.
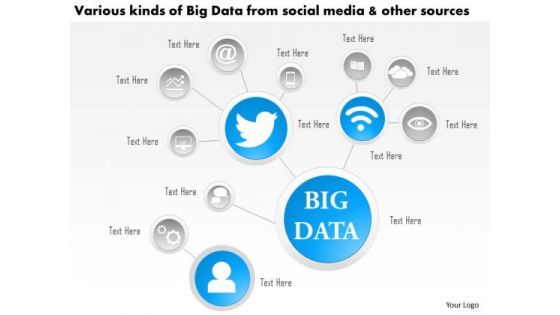
Business Diagram Various Kinds Of Big Data From Social Media And Other Sources Ppt Slide
This technology diagram contains the concept of big data analysis. This slide depicts various kinds of social media and other sources. Use this diagram for mobile and communication related presentations.
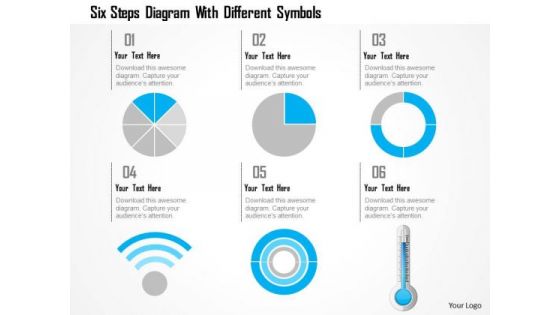
Business Diagram Six Steps Diagram With Different Symbols Presentation Template
This power point template has been crafted with graphic of 3d pie charts with Wi-Fi symbol and thermometer. This PPT contains the concept of calculation and result analysis. Use this PPT for your business and science related presentations.
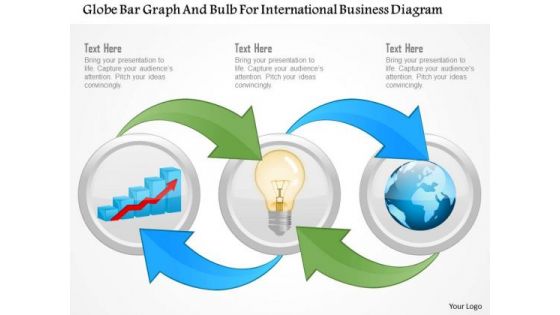
Business Diagram Globe Bar Graph And Bulb For International Business Diagram Presentation Template
Graphic of globe and bar graph with bulb has been used to craft this power point template diagram. This PPT diagram contains the concept of international business growth analysis. Use this PPT for global business and sales related presentations.
Business Diagram Human Icon Bar Graph For Business Presentation Template
Graphic of human icons and bar graph has been used to decorate this power point template. This PPT contains the concept of business communication and result analysis. Use this PPT for business and marketing related presentations.
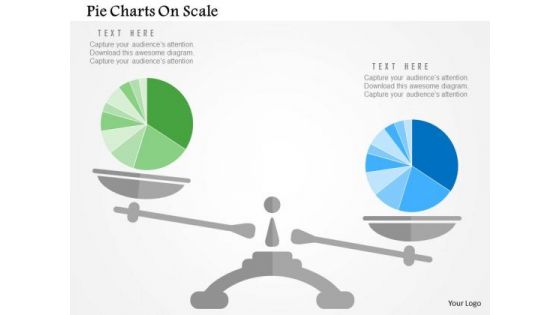
Business Diagram Pie Charts On Scale Presentation Template
Our above slide display graphics of pie chart on a scale. Download this diagram slide to display competitive analysis of business. Adjust the above diagram in your business presentations to visually support your content.
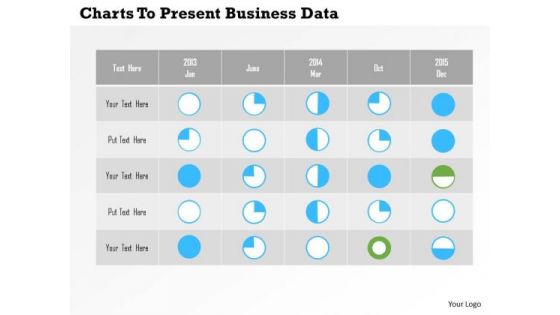
Business Diagram Charts To Present Business Data PowerPoint Templates
Table of pie graphs has been used in this power point diagram. This business diagram contains the concept of result analysis. The template offers an excellent background to build up the various stages of your business process.

3d Happy Person With Dollars PowerPoint Templates
Concept of financial growth analysis with happiness has been defined in this PowerPoint template. This diagram slide contains the graphic of 3d man standing over the currency. Use this image for business and finance related topics in any presentation.
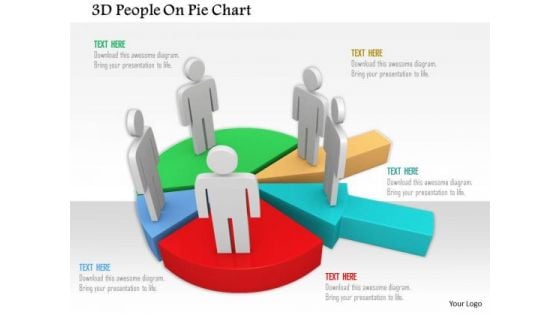
3d People On Pie Chart PowerPoint Templates
This power point diagram has been crafted with graphic of 3d team members on pie chart. This 3d diagram contains the concept of team management and result analysis. Use this diagram to create an impact on your viewers.
Business Diagram Icons And Charts For Business Growth Presentation Template
Our above slide contains graphics of business charts and icons. It helps to display business reports and analysis. Use this diagram to impart more clarity to data and to create more sound impact on viewers.
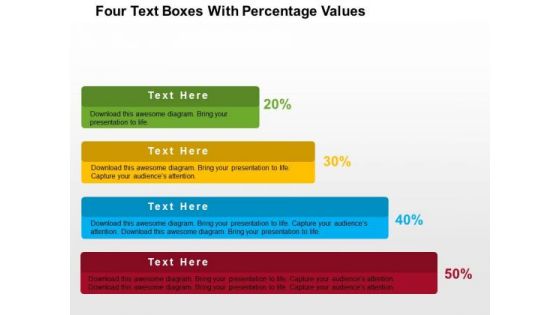
Four Text Boxes With Percentage Values PowerPoint Template
Growth analysis for business can be defined with this business diagram. This slide depicts text boxes in increasing flow. Present your views using this innovative slide and be assured of leaving a lasting impression
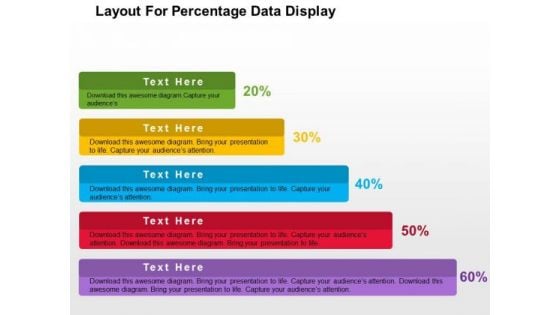
Layout For Precentage Data Display PowerPoint Template
Growth analysis for business can be defined with this business diagram. This slide depicts text boxes in increasing flow. Present your views using this innovative slide and be assured of leaving a lasting impression
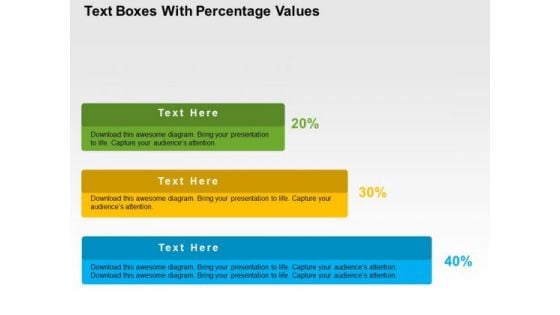
Text Boxes With Percentage Values PowerPoint Template
Growth analysis for business can be defined with this business diagram. This slide depicts text boxes in increasing flow. Present your views using this innovative slide and be assured of leaving a lasting impression
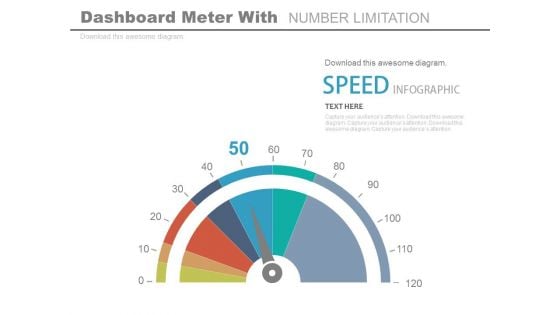
Dashboard To Impact The Performance Powerpoint Slides
This PowerPoint template graphics of meter chart. Download this PPT chart for business performance analysis. This PowerPoint slide is of great help in the business sector to make realistic presentations and provides effective way of presenting your newer thoughts.
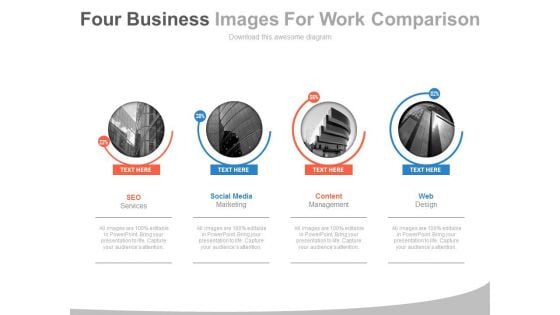
Four Companies With Web Services Powerpoint Slides
This PowerPoint template display graphics of four corporate buildings. You may use this PPT slide for financial and strategic analysis for web services companies. This dashboard slide may useful for multilevel status report creation and approval process.
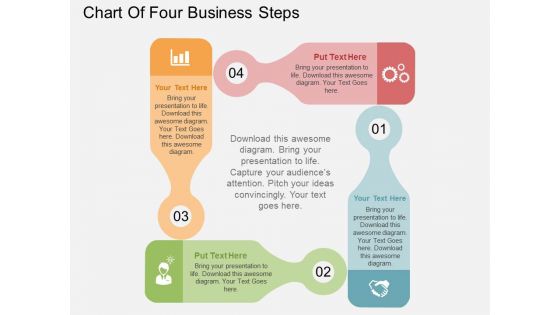
Chart Of Four Business Steps Powerpoint Templates
This business diagram displays flow of four business steps. This editable slide is suitable to present growth management. Use this diagram for business and finance related topics and display complete data analysis in your presentation.
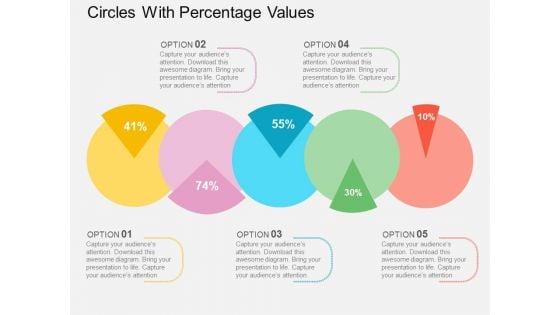
Circles With Percentage Values Powerpoint Templates
This PowerPoint template displays circles with percentage values. This business diagram is suitable for financial data analysis. Use this business diagram slide to highlight the key issues of your presentation.
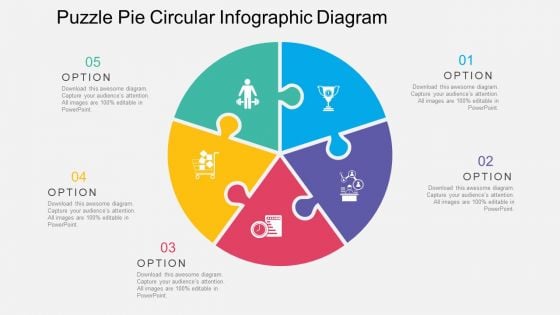
Puzzle Pie Circular Infographic Diagram Powerpoint Templates
Our above PPT slide display puzzle pie circular Infographic. Download this diagram slide to display strategy and analysis. Adjust the above diagram in your business presentations to visually support your content.
Rocket With Three Staged Icons Powerpoint Template
Growth analysis for business can be defined with this business diagram. This slide depicts rocket with three staged icons. Present your views using this innovative slide and be assured of leaving a lasting impression
Five Hexagons With Business Icons Powerpoint Templates
This PowerPoint template contains graphics of hexagons with business icons. This layout helps you to portray concepts teamwork, idea sharing and business analysis. Streamline the flow of information across the board using this diagram.
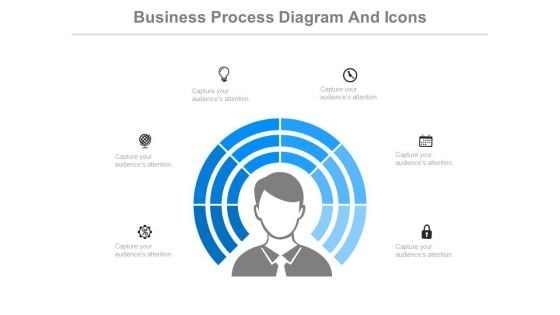
Human Thinking Business Process Diagram Powerpoint Slides
Our above PPT slide contains circles around human mind with icons. This PowerPoint template helps to display thinking process, business strategy and analysis. Use this diagram to impart more clarity to subject and to create more sound impact on viewers.
Six Staged Infographics Square With Business Icons Powerpoint Templates
This business diagram displays circular puzzle infographic. This editable slide is suitable to present global communication. Use this diagram for business and finance related topics and display complete data analysis in your presentation.
Three Arrows With Icons Powerpoint Templates
This business diagram displays graphic of three arrows with icons. This power point template contains the concept of business analysis and research. Use this diagram to build unique presentation for your viewers.
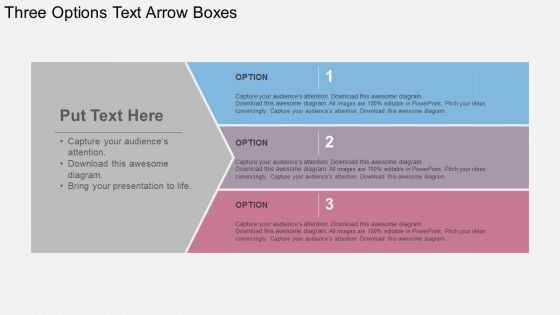
Three Options Text Arrow Boxes Powerpoint Templates
This business diagram displays graphic of arrows with icons. This power point template contains the concept of business analysis and research. Use this diagram to build unique presentation for your viewers.
Circular Arrow Chart With Business Icons Powerpoint Slides
Graphics of circular arrow chart with icons have been displayed in this business slide. This business diagram helps to exhibit strategy analysis and management. Use this PowerPoint template to visually support your content.
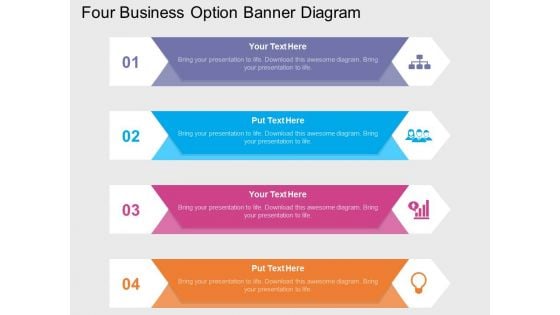
Four Business Option Banner Diagram Powerpoint Template
This business slide contains four option banners with business icons. This PPT diagram is suitable to present concept of profit growth value analysis. Visual effect of this diagram provides more clarity to the subject.
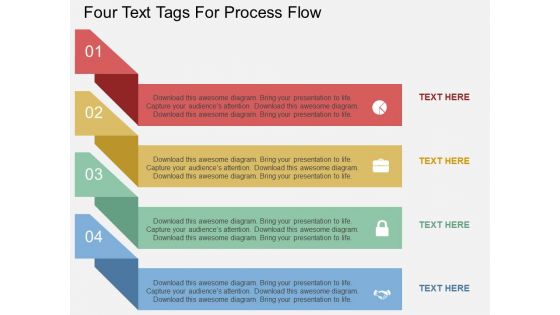
Four Text Tags For Process Flow Powerpoint Template
This PPT slide contains four text tags with business icons. This PPT diagram is suitable to present concept of profit growth value analysis. Enlighten others on the process with this innovative PowerPoint template.


 Continue with Email

 Home
Home


