Risk Framework
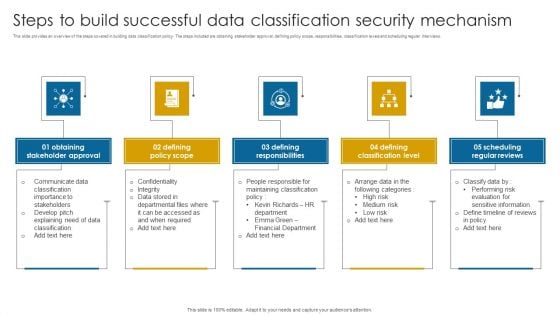
Steps To Build Successful Data Classification Security Mechanism Structure PDF
This slide provides an overview of the steps covered in building data classification policy. The steps included are obtaining stakeholder approval, defining policy scope, responsibilities, classification levels and scheduling regular interviews.Presenting Steps To Build Successful Data Classification Security Mechanism Structure PDF to dispense important information. This template comprises five stages. It also presents valuable insights into the topics including Stakeholder Approval, Defining Policy Scope, Defining Responsibilities. This is a completely customizable PowerPoint theme that can be put to use immediately. So, download it and address the topic impactfully.
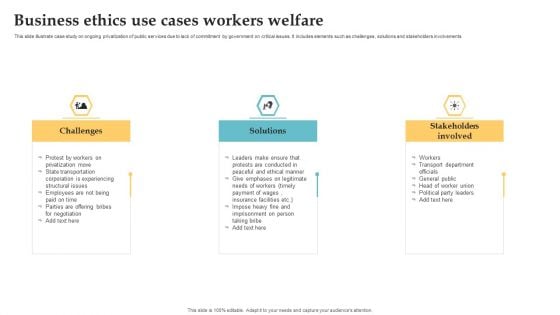
Business Ethics Use Cases Workers Welfare Structure PDF
This slide illustrate case study on ongoing privatization of public services due to lack of commitment by government on critical issues. It includes elements such as challenges, solutions and stakeholders involvements. Presenting Business Ethics Use Cases Workers Welfare Structure PDF to dispense important information. This template comprises Three stages. It also presents valuable insights into the topics including Challenges, Solutions, Stakeholders Involved. This is a completely customizable PowerPoint theme that can be put to use immediately. So, download it and address the topic impactfully.
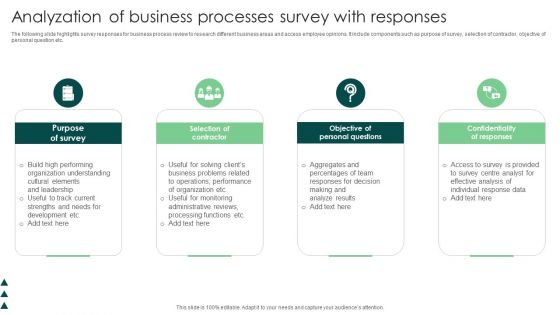
Analyzation Of Business Processes Survey With Responses Structure PDF
The following slide highlights survey responses for business process review to research different business areas and access employee opinions. It include components such as purpose of survey, selection of contractor, objective of personal question etc. Presenting Analyzation Of Business Processes Survey With Responses Structure PDF to dispense important information. This template comprises four stages. It also presents valuable insights into the topics including Contractor, Personal Questions, Responses. This is a completely customizable PowerPoint theme that can be put to use immediately. So, download it and address the topic impactfully.
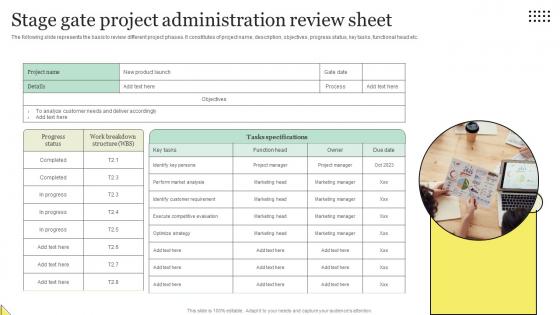
Stage Gate Project Administration Review Sheet Portrait Pdf
The following slide represents the basis to review different project phases. It constitutes of project name, description, objectives, progress status, key tasks, functional head etc. Pitch your topic with ease and precision using this Stage Gate Project Administration Review Sheet Portrait Pdf. This layout presents information on Identify Key Persons, Perform Market Analysis, Identify Customer Requirement. It is also available for immediate download and adjustment. So, changes can be made in the color, design, graphics or any other component to create a unique layout. The following slide represents the basis to review different project phases. It constitutes of project name, description, objectives, progress status, key tasks, functional head etc.

Swot Analysis Business PowerPoint Templates And PowerPoint Backgrounds 0811
Microsoft PowerPoint Template and Background with a set of project management buttons Redesign your organization with our Swot Analysis Business PowerPoint Templates And PowerPoint Backgrounds 0811. Download without worries with our money back guaranteee.

Graph Analysis Arrow Business PowerPoint Themes And PowerPoint Slides 0211
Microsoft PowerPoint Theme and Slide with a man analyzing a graph showing growth Help yourself win with our Graph Analysis Arrow Business PowerPoint Themes And PowerPoint Slides 0211. Make sure your presentation gets the attention it deserves.

Swot Analysis Business PowerPoint Themes And PowerPoint Slides 0811
Microsoft PowerPoint Theme and slide with a set of project management buttons Leave a good taste with our Swot Analysis Business PowerPoint Themes And PowerPoint Slides 0811. They always add to the fare.
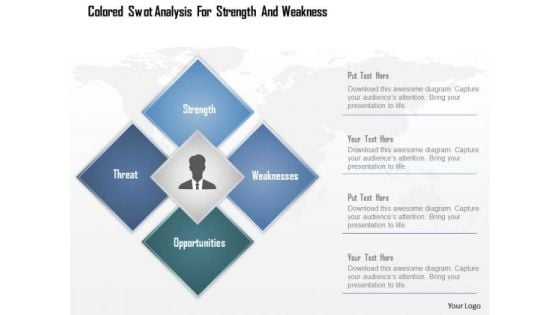
Colored Swot Analysis For Strength And Weakness PowerPoint Template
Concept of SWOT analysis has been displayed in this power point template. This PPT contains the graphic of colored square. This PPT diagram contains the weakness and strength. Use this PPT for your management and business related presentations.
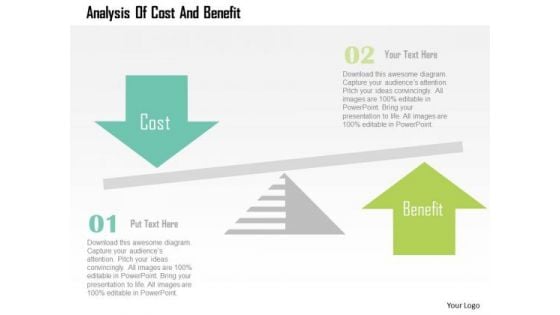
Business Diagram Analysis Of Cost And Benefit Presentation Template
This business diagram contains graphics of balancing scale with arrows of cost and benefit. You may use this diagram for analysis of cost and benefit. Communicate effectively with your group through this slide.
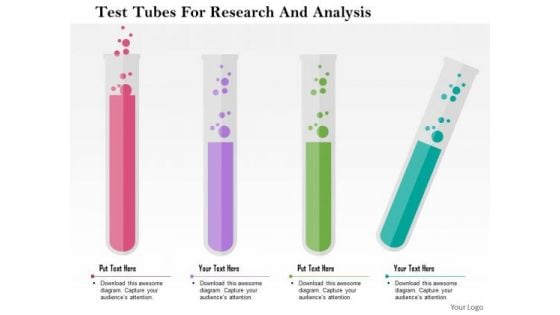
Business Diagram Test Tubes For Research And Analysis Presentation Template
This diagram is suitable for research and analysis. This diagram template contains the graphic of test tubes. Adjust the above diagram into your Presentations to visually support your contents.
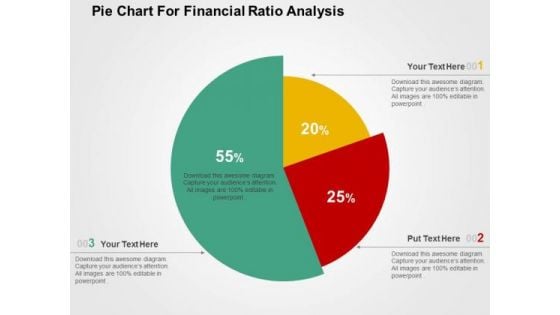
Pie Chart For Financial Ratio Analysis PowerPoint Templates
Create visually amazing presentations with this slide of pie chart. This PPT slide of pie chart for financial ratio analysis. Add this diagram in your presentations to visually support your content.
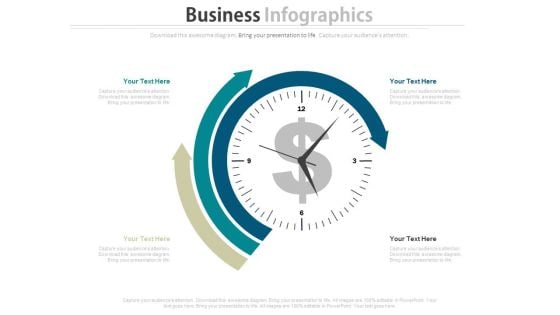
Dashboard Diagram For Finance And Strategic Analysis Powerpoint Slides
This PowerPoint template display graphics of clock with arrows around it and dollar symbol in center. You may use this PPT slide for financial and strategic analysis. This dashboard slide may useful for multilevel status report creation and approval process.
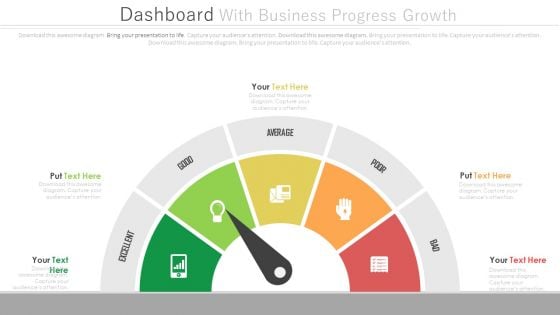
Dashboard To Simplify Business Data Analysis Powerpoint Slides
This PowerPoint template graphics of meter chart. Download this PPT chart to simplify business data analysis. This PowerPoint slide is of great help in the business sector to make realistic presentations and provides effective way of presenting your newer thoughts.
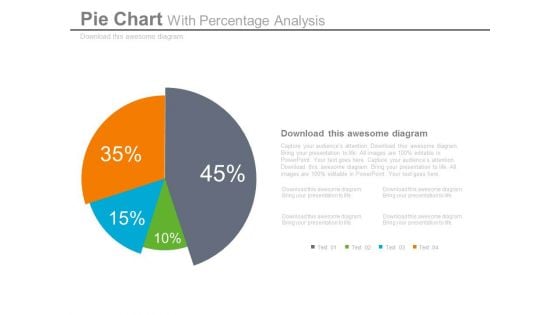
Pie Chart Dashboard Style For Percentage Analysis Powerpoint Slides
This dashboard PPT template contains graphics of pie chart. This dashboard PowerPoint template helps to display percentage analysis in a visual manner. Download this PPT slide for quick decision-making.
Pie Chart With Icons For Business Analysis Powerpoint Slides
This dashboard template contains graphics of pie chart with icons. This dashboard PowerPoint template helps to display business analysis in a visual manner. Download this template to make impressive presentations.
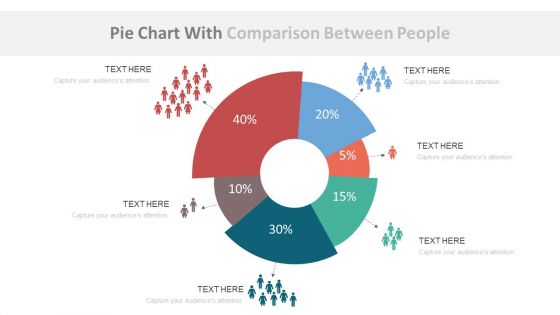
Pie Chart With Population Ratio Analysis Powerpoint Slides
This dashboard template contains graphics of pie chart with icons. This dashboard PowerPoint template helps to display population ratio analysis in a visual manner. Download this template to make impressive presentations.
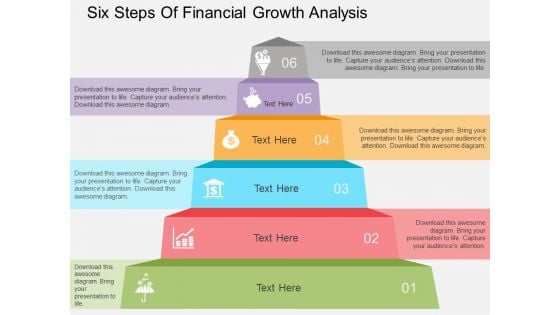
Six Steps Of Financial Growth Analysis Powerpoint Templates
Financial growth analysis can be defined with this business diagram slide. This PowerPoint template contains the graphic of six steps with business icons. Download this editable diagram slide to build unique presentations.
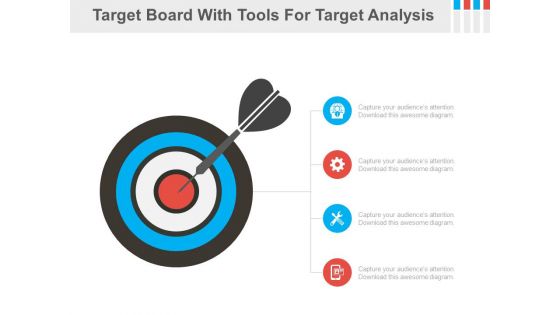
Four Tools For Marketing Target Analysis Powerpoint Slides
This PPT slide contains graphics of target board with four icons. You may download this PPT slide as tool for marketing target analysis. Impress your audiences by using this PPT slide.
Five Mountain Chart With Icons For Financial Analysis Powerpoint Slides
Our above PPT slide contains five mountains with icons and financial values. This PowerPoint template helps to exhibit financial analysis for business growth. Use this diagram to impart more clarity to subject and to create more sound impact on viewers.
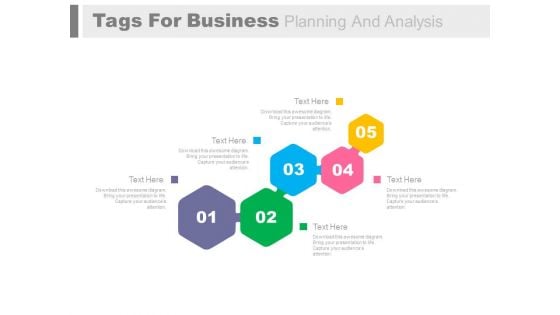
Five Steps For Business Process And Analysis Powerpoint Slides
Five steps process flow have been displayed in this business slide. This business diagram helps to exhibit business process and analysis. Use PowerPoint template to build an exclusive presentation.
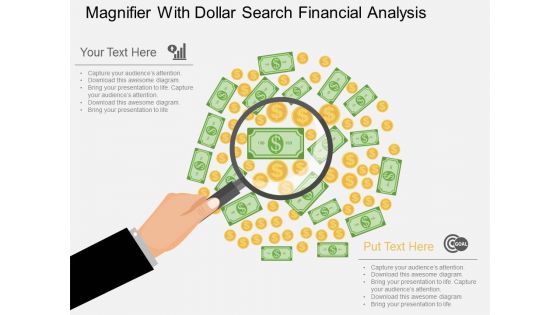
Magnifier With Dollar Search Financial Analysis Powerpoint Template
Our above business slide contains graphics of magnifier on dollar notes. This diagram can be used to display dollar search and financial analysis. Capture the attention of your audience with this professional slide.

Business Vision And Mission Strategy Analysis Powerpoint Slides
This PowerPoint template displays pictures of corporate team member. You may download this PPT slide to depict corporate vision, mission and strategy analysis. Add this slide to your presentation and impress your superiors.
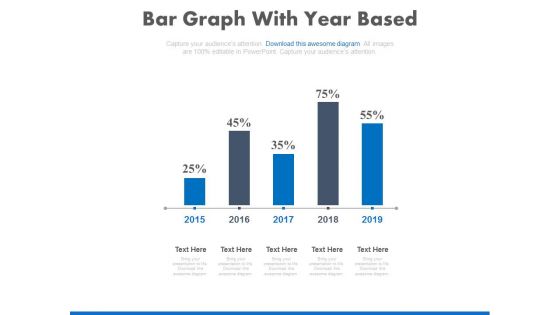
Bar Graph With Yearly Statistical Analysis Powerpoint Slides
This PowerPoint template contains diagram of bar graph with yearly percentage ratios. You may download this slide to display statistical analysis. You can easily customize this template to make it more unique as per your need.
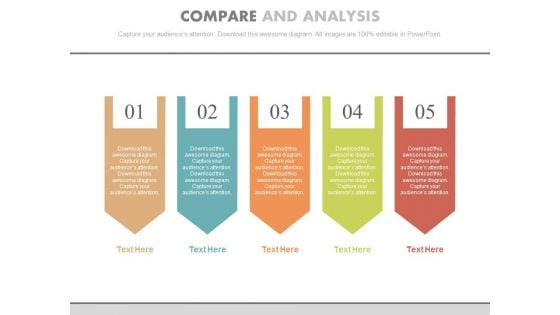
Five Steps For Data Compare And Analysis Powerpoint Template
Our above slide contains graphics of five steps chart. This PowerPoint template is useful for data compare and analysis. Use this diagram to impart more clarity to subject and to create more sound impact on viewers.
Four Steps And Icons For Business Analysis Powerpoint Template
Our above PPT slide contains four steps with icons. This PowerPoint template helps to display business strategy and analysis. Use this diagram to impart more clarity to subject and to create more sound impact on viewers.
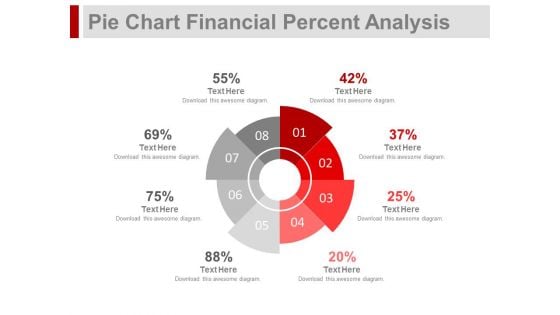
Pie Chart For Financial Ratio Analysis Powerpoint Slides
This PPT slide contains graphics of eight stage pie chart. Download this PowerPoint template slide for financial ratio analysis. This diagram is editable you can edit text, color, shade and style as per you need.
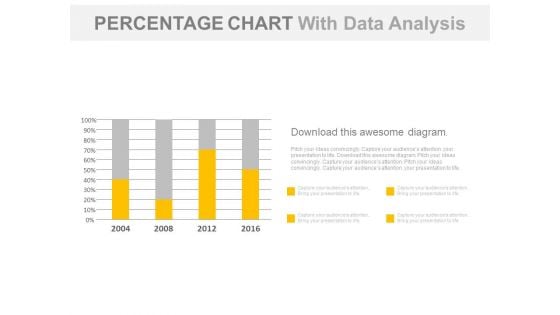
Year Based Chart With Percentage Data Analysis Powerpoint Slides
Our above business slide contains year based statistical chart. This PowerPoint template can be used to display percentage data analysis. Capture the attention of your audience with this slide.
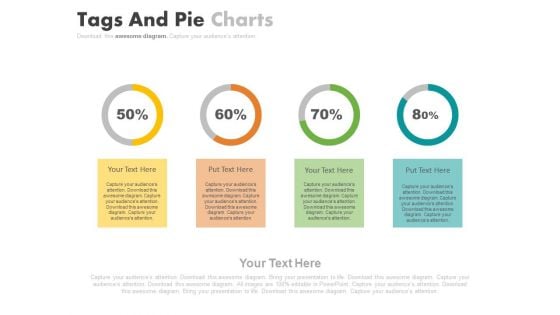
Four Steps For Financial Data Analysis Powerpoint Slides
This PowerPoint contains four circles with percentage values. Download this diagram slide to display financial data analysis. This template is editable, You can edit text, color, shade and style of this diagram as per you need.
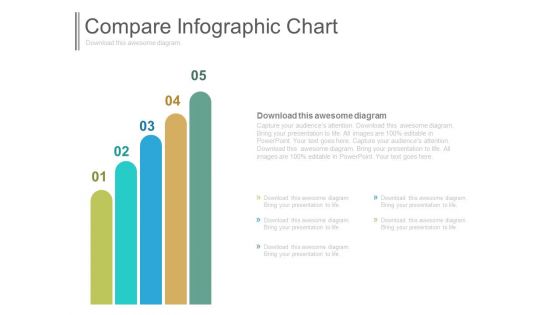
Five Bars For Marketing Research And Analysis Powerpoint Template
This business slide contains diagram of five colorful bars. This diagram provides schematic representation of marketing research and analysis. Visual effect this slide helps in maintaining the flow of the discussion and provides more clarity to the subject.
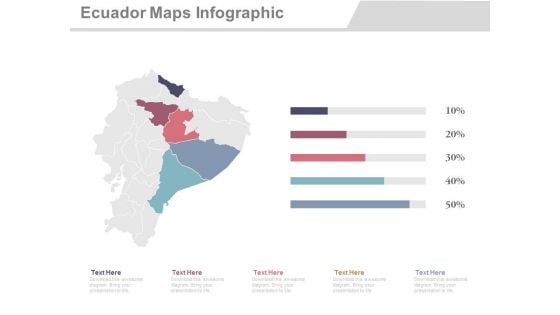
Ecuador Map With States Economic Analysis Powerpoint Slides
This PowerPoint template displays graphics of Ecuador map with different locations and percentage values. This Map template can be used in business presentations to depict economic analysis. This slide can also be used by school students for educational projects.
Four Arrows With Icons For Business Analysis Powerpoint Slides
This professional slide contains graphics of four arrows with icons. You may use this PowerPoint template for business analysis. Add this PPT slide to your presentation and impress your superiors.
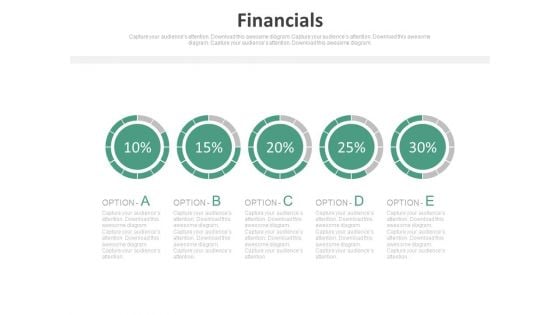
Pie Charts For Percentage Value Analysis Powerpoint Slides
Our above PPT slide displays graphics of Pie charts. This PowerPoint template may be used to display percentage value analysis. Download this template to leave permanent impression on your audience.
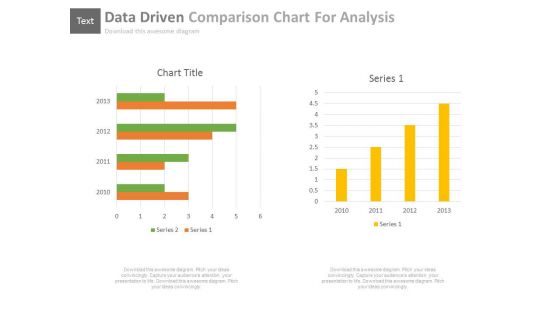
Data Driven Comparison Charts For Analysis Powerpoint Slides
You can download this PowerPoint template to display statistical data and analysis. This PPT slide contains data driven comparison charts. Draw an innovative business idea using this professional diagram.
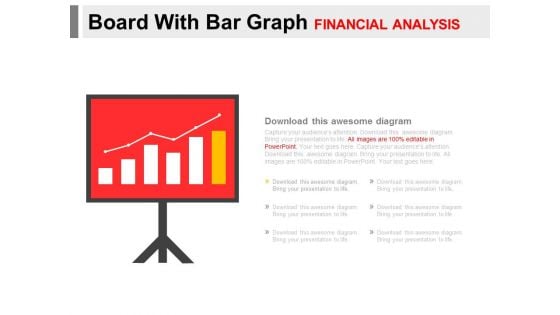
Board With Bar Graph For Financial Analysis Powerpoint Slides
You can download this PowerPoint template to display statistical data and analysis. This PPT slide contains display board with bar graph. Draw an innovative business idea using this professional diagram.
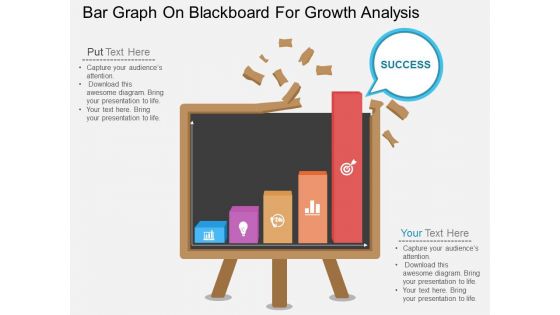
Bar Graph On Blackboard For Growth Analysis Powerpoint Template
Visually support your presentation with our above template containing bar graph on blackboard. This PowerPoint template helps to display growth analysis. Etch your views in the brains of your audience with this diagram slide.
Banners With Business Growth Analysis And Deal Icons Powerpoint Template
This PowerPoint slide contains graphics of text banners with icons. This professional slide helps to exhibit business growth, analysis and deals. Use this professional template to make impressive presentations.

Four Banners For Business Growth Analysis Powerpoint Template
This PPT slide contains graphics of four banners with icons. Download this diagram slide to display business growth analysis. This diagram is editable you can edit text, color, shade and style as per you need.
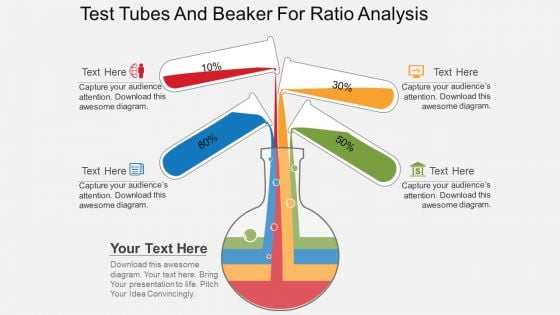
Test Tubes And Beaker For Ratio Analysis Powerpoint Template
Visually support your presentation with our above template containing diagram of test tubes and beaker. This diagram is excellent visual tools for explaining ratio analysis. Use this diagram to make interactive presentations.
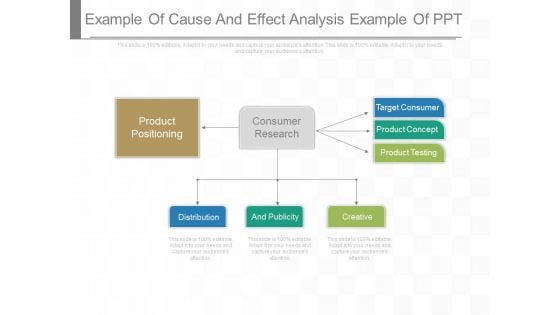
Example Of Cause And Effect Analysis Example Of Ppt
This is an example of cause and effect analysis example of ppt. This is a one stage process. The stages in this process are product positioning, consumer research, target consumer, product concept, product testing, distribution, and publicity, creative.\n\n
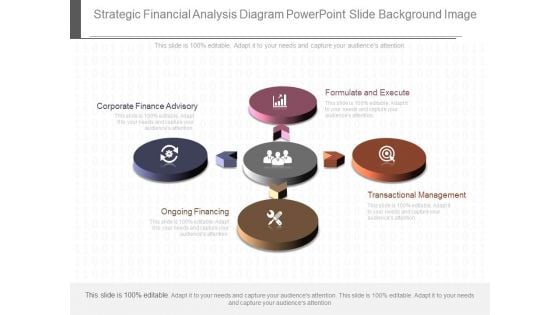
Strategic Financial Analysis Diagram Powerpoint Slide Background Image
This is a strategic financial analysis diagram powerpoint slide background image. This is a four stage process. The stages in this process are formulate and execute, transactional management, ongoing financing, corporate finance advisory.
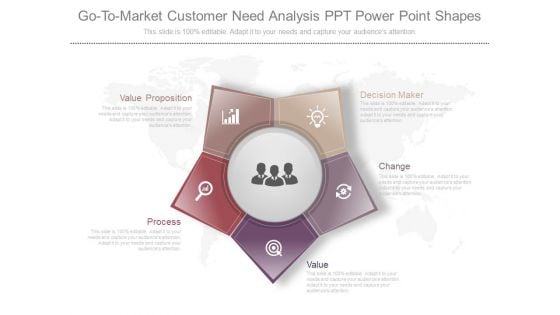
Go To Market Customer Need Analysis Ppt Powerpoint Shapes
This is a go to market customer need analysis ppt powerpoint shapes. This is a five stage process. The stages in this process are decision maker, change, value, process, value proposition.
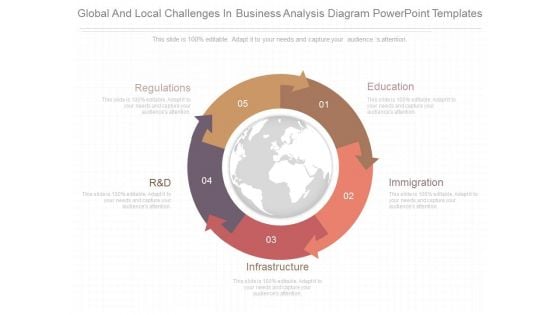
Global And Local Challenges In Business Analysis Diagram Powerpoint Templates
This is a global and local challenges in business analysis diagram powerpoint templates. This is a four stage process. The stages in this process are regulations, education, immigration, infrastructure, r and d.
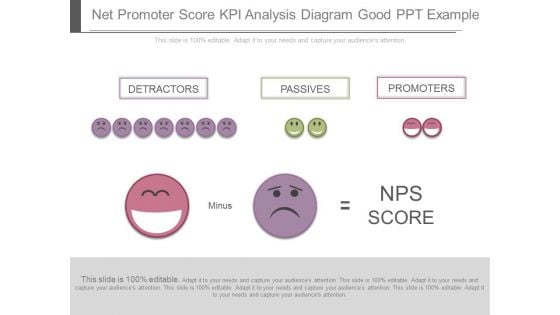
Net Promoter Score Kpi Analysis Diagram Good Ppt Example
This is a net promoter score kpi analysis diagram good ppt example. This is a three stage process. The stages in this process are detractors, passives, promoters, minus, nps score.
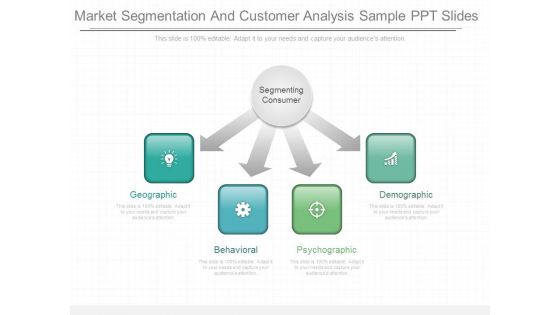
Market Segmentation And Customer Analysis Sample Ppt Slides
This is a market segmentation and customer analysis sample ppt slides. This is a four stage process. The stages in this process are segmenting consumer, geographic, behavioral, psychographic, demographic.
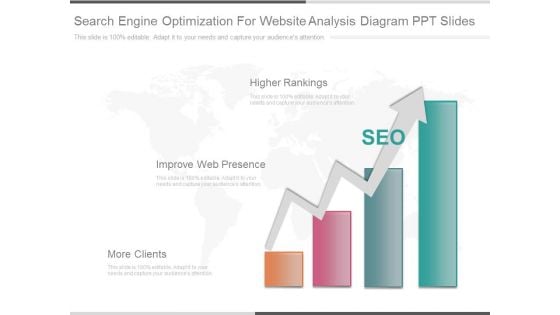
Search Engine Optimization For Website Analysis Diagram Ppt Slides
This is a search engine optimization for website analysis diagram ppt slides. This is a four stage process. The stages in this process are higher rankings, improve web presence, more clients.
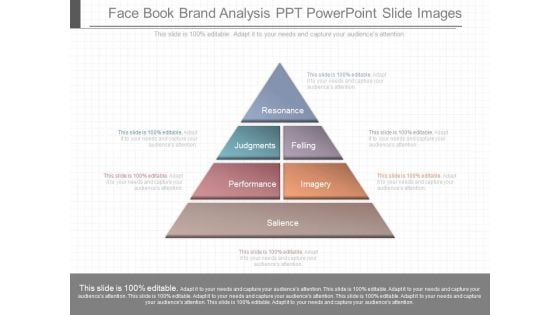
Face Book Brand Analysis Ppt Powerpoint Slide Images
This is a face book brand analysis ppt powerpoint slide images. This is a four stage process. The stages in this process are resonance, judgments, felling, performance, imagery, salience.\n\n\n\n\n \n
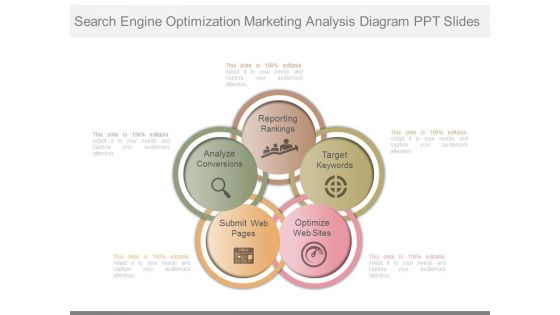
Search Engine Optimization Marketing Analysis Diagram Ppt Slides
This is a search engine optimization marketing analysis diagram ppt slides. This is a five stage process. The stages in this process are reporting rankings, analyze conversions, submit web pages, optimize web sites, target keywords.
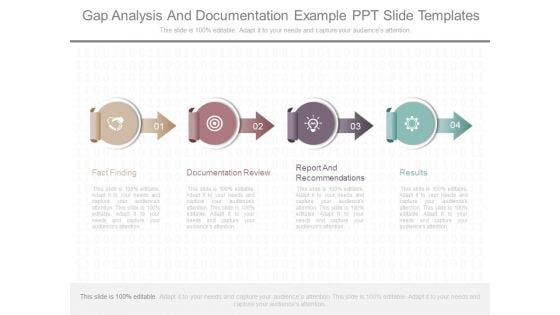
Gap Analysis And Documentation Example Ppt Slide Templates
This is a gap analysis and documentation example ppt slide templates. This is a four stage process. The stages in this process are fact finding, documentation review, report and recommendations, results.
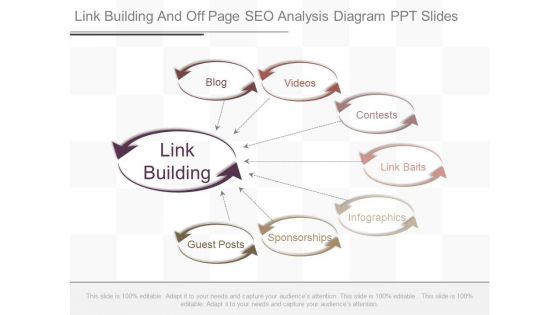
Link Building And Off Page Seo Analysis Diagram Ppt Slides
This is a link building and off page seo analysis diagram ppt slides. This is a seven stage process. The stages in this process are link building, blog, videos, contests, link baits, infographics, sponsorships, guest posts.\n\n\n\n\n\n
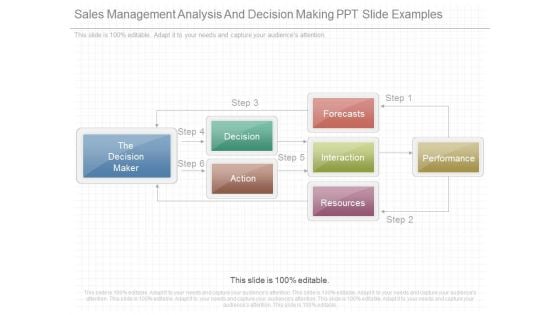
Sales Management Analysis And Decision Making Ppt Slide Examples
This is a sales management analysis and decision making ppt slide examples. This is a six stage process. The stages in this process are the decision maker, decision, action, forecasts, interaction, resources, performance.
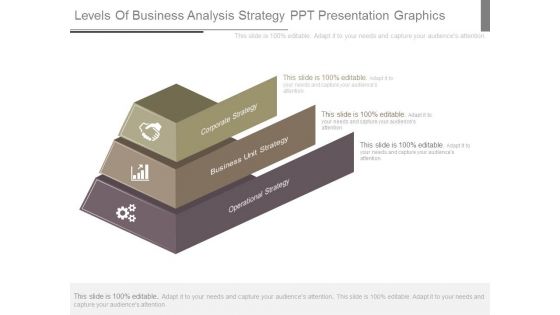
Levels Of Business Analysis Strategy Ppt Presentation Graphics
This is a levels of business analysis strategy ppt presentation graphics. This is a three stage process. The stages in this process are corporate strategy, business unit strategy, operational strategy.
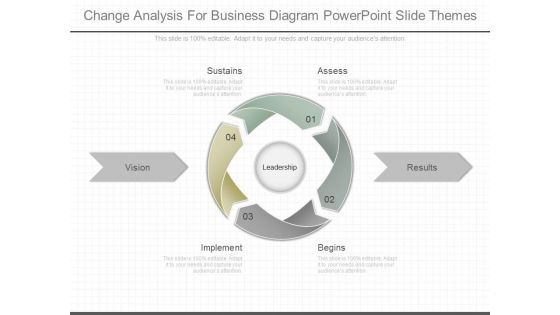
Change Analysis For Business Diagram Powerpoint Slide Themes
This is a change analysis for business diagram powerpoint slide themes. This is a four stage process. The stages in this process are sustains, assess, implement, begins, vision, results.
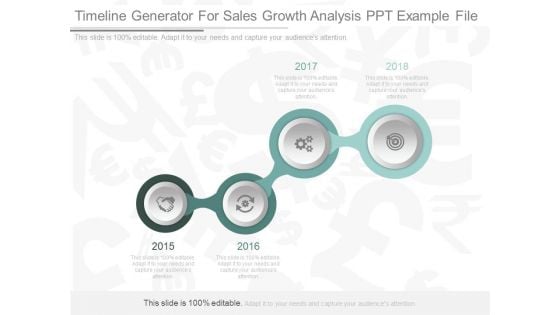
Timeline Generator For Sales Growth Analysis Ppt Example File
This is a timeline generator for sales growth analysis ppt example file. This is a four stage process. The stages in this process are business, management, strategy, marketing, year.
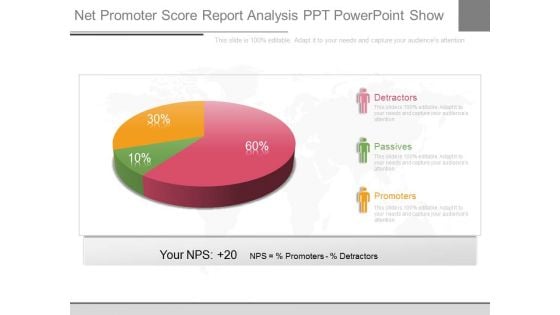
Net Promoter Score Report Analysis Ppt Powerpoint Show
This is a net promoter score report analysis ppt powerpoint show. This is a three stage process. The stages in this process are detractors, passives, promoters, your nps, nps, percentage promoters, percentage detractors.
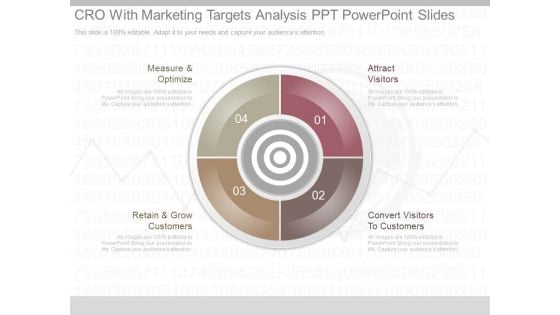
Cro With Marketing Targets Analysis Ppt Powerpoint Slides
This is a cro with marketing targets analysis ppt powerpoint slides. This is a four stage process. The stages in this process are measure and optimize, retain and grow customers, attract visitors, convert visitors to customers.
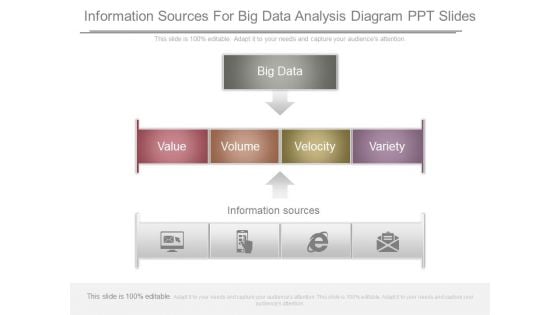
Information Sources For Big Data Analysis Diagram Ppt Slides
This is a information sources for big data analysis diagram ppt slides. This is a three stage process. The stages in this process are big data, value, volume, velocity, variety, information sources.
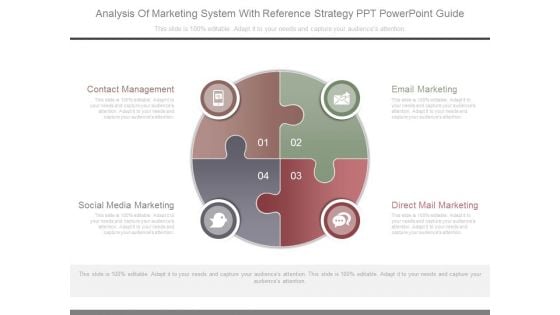
Analysis Of Marketing System With Reference Strategy Ppt Powerpoint Guide
This is a analysis of marketing system with reference strategy ppt powerpoint guide. This is a four stage process. The stages in this process are email marketing, direct mail marketing, social media marketing, contact management.
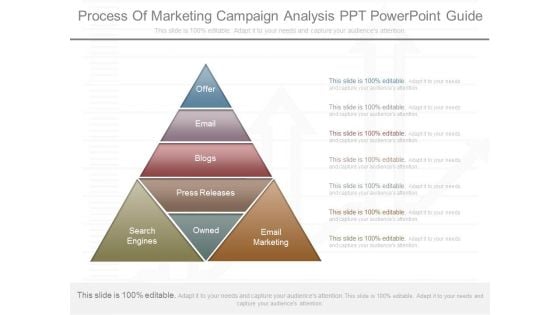
Process Of Marketing Campaign Analysis Ppt Powerpoint Guide
This is a process of marketing campaign analysis ppt powerpoint guide. This is a seven stage process. The stages in this process are offer, email, blogs, press releases, search engines, owned, email marketing.
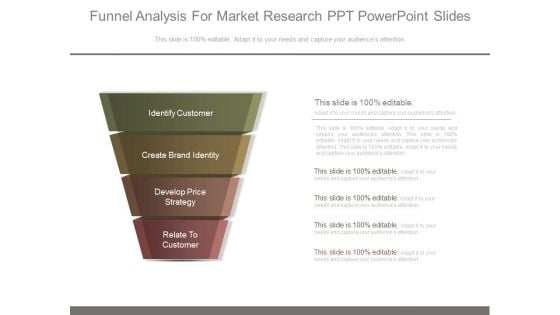
Funnel Analysis For Market Research Ppt Powerpoint Slides
This is a funnel analysis for market research ppt powerpoint slides. This is a four stage process. The stages in this process are identify customer, create brand identity, develop price strategy, relate to customer.
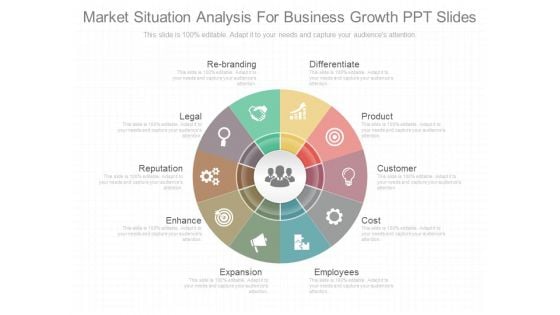
Market Situation Analysis For Business Growth Ppt Slides
This is a market situation analysis for business growth ppt slides. This is a ten stage process. The stages in this process are rebranding, legal, reputation, enhance, expansion, employees, cost, customer, product, differentiate.


 Continue with Email

 Home
Home


