Risk Meter
Key Metrics To Measure Current Evaluation And Deployment Of Enhanced Professional Pdf
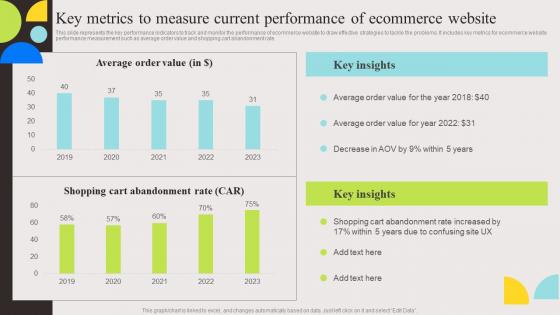
This slide represents the key performance indicators to track and monitor the performance of ecommerce website to draw effective strategies to tackle the problems. It includes key metrics for ecommerce website performance measurement such as average order value and shopping cart abandonment rate. Are you searching for a Key Metrics To Measure Current Evaluation And Deployment Of Enhanced Professional Pdf that is uncluttered, straightforward, and original It is easy to edit, and you can change the colors to suit your personal or business branding. For a presentation that expresses how much effort you have put in, this template is ideal With all of its features, including tables, diagrams, statistics, and lists, it is perfect for a business plan presentation. Make your ideas more appealing with these professional slides. Download Key Metrics To Measure Current Evaluation And Deployment Of Enhanced Professional Pdf from Slidegeeks today. This slide represents the key performance indicators to track and monitor the performance of ecommerce website to draw effective strategies to tackle the problems. It includes key metrics for ecommerce website performance measurement such as average order value and shopping cart abandonment rate.
Information Technology Security KPI With Cost Estimation Of Industry Topics PDF
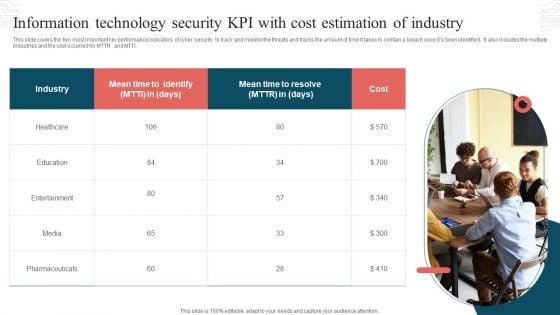
This slide covers the two most important key performance indicators of cyber security to track and monitor the threats and tracks the amount of time it takes to contain a breach once its been identified. It also includes the multiple industries and the cost occurred for MTTR and MTTI. Persuade your audience using this Information Technology Security KPI With Cost Estimation Of Industry Topics PDF. This PPT design covers one stages, thus making it a great tool to use. It also caters to a variety of topics including Industry, Mean Time, Cost. Download this PPT design now to present a convincing pitch that not only emphasizes the topic but also showcases your presentation skills.
Ppt Display Of Marketing Process Using 8 Power Point Stage PowerPoint Templates
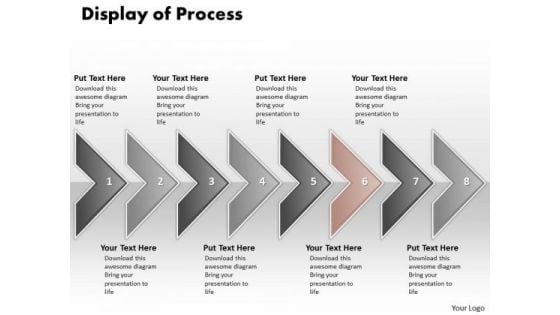
PPT display of marketing process using 8 power point stage PowerPoint Templates-This Diagram is used to illustrate how information will move between interrelated systems in the accomplishment of a given function, task or process. The visual description of this information flow with each given level showing how data is fed into a given process step and subsequently passed along at the completion of that step.-PPT display of marketing process using 8 power point stage PowerPoint Templates-Aim, Arrow, Badge, Border, Color, Connection, Curve, Design, Direction, Download, Icon, Illustration, Indicator, Internet, Label, Link, Magenta, Mark, Next, Object, Orientation, Paper, Peeling, Pointer, Rounded, Set, Shadow, Shape, Sign Solve problems with our Ppt Display Of Marketing Process Using 8 Power Point Stage PowerPoint Templates. Download without worries with our money back guaranteee.
Flow Ppt Theme Linear Arrows 12 Phase Diagram Time Management PowerPoint 4 Image
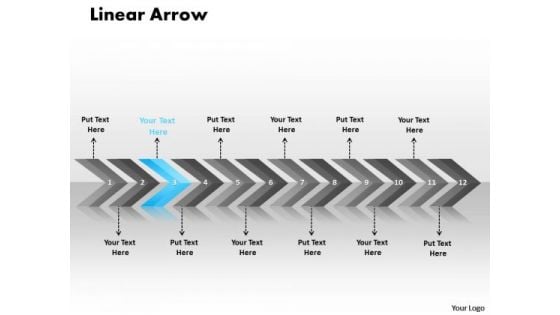
flow PPT Theme linear arrows 12 phase diagram time management powerpoint 4 Image-This diagram can be used as an analysis graph designed to help you understand the cause-and-effect relationships of your key processes. It provides a specialist tool to resolve problems and define the appropriate actions for the responsible team.-flow PPT Theme linear arrows 12 phase diagram time management powerpoint 4 Image-Aim, Angle, Arrow, Arrowheads, Badge, Banner, Connection, Curve, Design, Direction, Download, Element, Fuchsia, Icon, Illustration, Indicator, Internet, Label, Link, Magenta, Mark, Marker, Next, Object, Orange, Orientation, Pointer, Shadow, Shape, Signs Symbol Surpass your colleagues with our Flow Ppt Theme Linear Arrows 12 Phase Diagram Time Management PowerPoint 4 Image. Download without worries with our money back guaranteee.
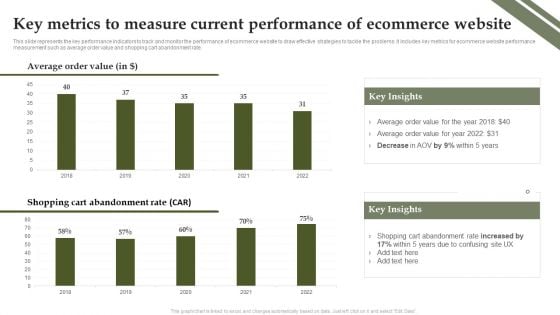
Analyzing And Deploying Effective CMS Key Metrics To Measure Current Performance Of Ecommerce Website Infographics PDF
This slide represents the key performance indicators to track and monitor the performance of ecommerce website to draw effective strategies to tackle the problems. It includes key metrics for ecommerce website performance measurement such as average order value and shopping cart abandonment rate. Do you know about Slidesgeeks Analyzing And Deploying Effective CMS Key Metrics To Measure Current Performance Of Ecommerce Website Infographics PDF These are perfect for delivering any kind od presentation. Using it, create PowerPoint presentations that communicate your ideas and engage audiences. Save time and effort by using our pre designed presentation templates that are perfect for a wide range of topic. Our vast selection of designs covers a range of styles, from creative to business, and are all highly customizable and easy to edit. Download as a PowerPoint template or use them as Google Slides themes.
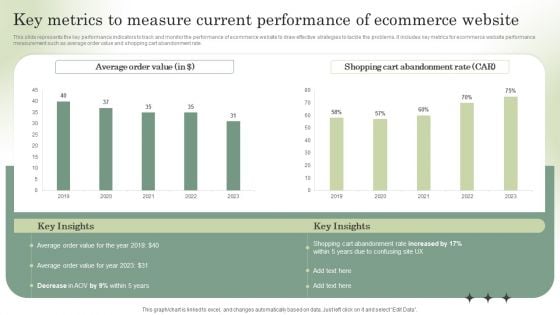
Optimizing Online Stores Key Metrics To Measure Current Performance Download PDF
This slide represents the key performance indicators to track and monitor the performance of ecommerce website to draw effective strategies to tackle the problems. It includes key metrics for ecommerce website performance measurement such as average order value and shopping cart abandonment rate. The Optimizing Online Stores Key Metrics To Measure Current Performance Download PDF is a compilation of the most recent design trends as a series of slides. It is suitable for any subject or industry presentation, containing attractive visuals and photo spots for businesses to clearly express their messages. This template contains a variety of slides for the user to input data, such as structures to contrast two elements, bullet points, and slides for written information. Slidegeeks is prepared to create an impression.
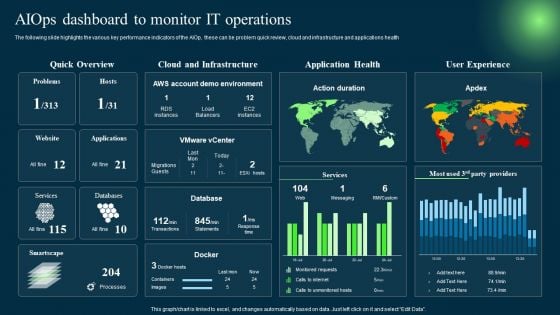
Introduction To Artificial Intelligence In Operation Management Industry Aiops Dashboard To Monitor IT Operations Clipart PDF
The following slide highlights the various key performance indicators of the AIOp, these can be problem quick review, cloud and infrastructure and applications health. Create an editable Introduction To Artificial Intelligence In Operation Management Industry Aiops Dashboard To Monitor IT Operations Clipart PDF that communicates your idea and engages your audience. Whether you are presenting a business or an educational presentation, pre-designed presentation templates help save time. Introduction To Artificial Intelligence In Operation Management Industry Aiops Dashboard To Monitor IT Operations Clipart PDF is highly customizable and very easy to edit, covering many different styles from creative to business presentations. Slidegeeks has creative team members who have crafted amazing templates. So, go and get them without any delay.
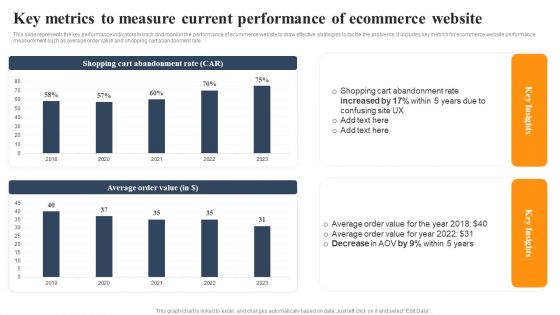
Implementing An Effective Ecommerce Management Framework Key Metrics Current Performance Of Ecommerce Website Slides PDF
This slide represents the key performance indicators to track and monitor the performance of ecommerce website to draw effective strategies to tackle the problems. It includes key metrics for ecommerce website performance measurement such as average order value and shopping cart abandonment rate. The Implementing An Effective Ecommerce Management Framework Key Metrics Current Performance Of Ecommerce Website Slides PDF is a compilation of the most recent design trends as a series of slides. It is suitable for any subject or industry presentation, containing attractive visuals and photo spots for businesses to clearly express their messages. This template contains a variety of slides for the user to input data, such as structures to contrast two elements, bullet points, and slides for written information. Slidegeeks is prepared to create an impression.
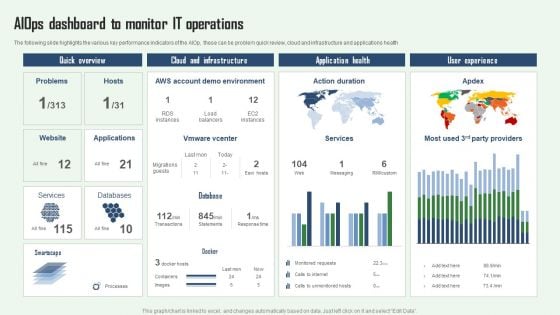
Aiops Dashboard To Monitor IT Operations Aiops Integration Summary Report Clipart PDF
The following slide highlights the various key performance indicators of the AIOp, these can be problem quick review, cloud and infrastructure and applications health. If you are looking for a format to display your unique thoughts, then the professionally designed Aiops Dashboard To Monitor IT Operations Aiops Integration Summary Report Clipart PDF is the one for you. You can use it as a Google Slides template or a PowerPoint template. Incorporate impressive visuals, symbols, images, and other charts. Modify or reorganize the text boxes as you desire. Experiment with shade schemes and font pairings. Alter, share or cooperate with other people on your work. Download Aiops Dashboard To Monitor IT Operations Aiops Integration Summary Report Clipart PDF and find out how to give a successful presentation. Present a perfect display to your team and make your presentation unforgettable.
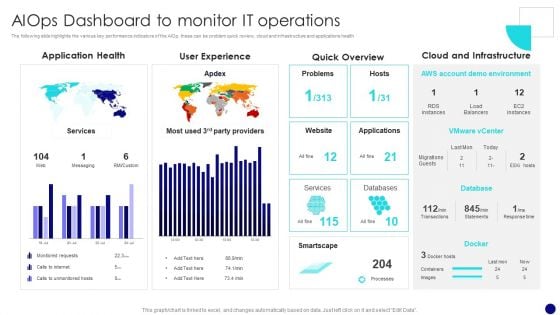
Information Technology Operations Administration With ML Aiops Dashboard To Monitor Diagrams PDF
The following slide highlights the various key performance indicators of the AIOp, these can be problem quick review, cloud and infrastructure and applications health. If you are looking for a format to display your unique thoughts, then the professionally designed Information Technology Operations Administration With ML Aiops Dashboard To Monitor Diagrams PDF is the one for you. You can use it as a Google Slides template or a PowerPoint template. Incorporate impressive visuals, symbols, images, and other charts. Modify or reorganize the text boxes as you desire. Experiment with shade schemes and font pairings. Alter, share or cooperate with other people on your work. Download Information Technology Operations Administration With ML Aiops Dashboard To Monitor Diagrams PDF and find out how to give a successful presentation. Present a perfect display to your team and make your presentation unforgettable.

Operational Strategy For ML In IT Sector Aiops Dashboard To Monitor IT Operations Diagrams PDF
The following slide highlights the various key performance indicators of the AIOps, these can be problem quick review, cloud and infrastructure and applications health If you are looking for a format to display your unique thoughts, then the professionally designed Operational Strategy For ML In IT Sector Aiops Dashboard To Monitor IT Operations Diagrams PDF is the one for you. You can use it as a Google Slides template or a PowerPoint template. Incorporate impressive visuals, symbols, images, and other charts. Modify or reorganize the text boxes as you desire. Experiment with shade schemes and font pairings. Alter, share or cooperate with other people on your work. Download Operational Strategy For ML In IT Sector Aiops Dashboard To Monitor IT Operations Diagrams PDF and find out how to give a successful presentation. Present a perfect display to your team and make your presentation unforgettable.
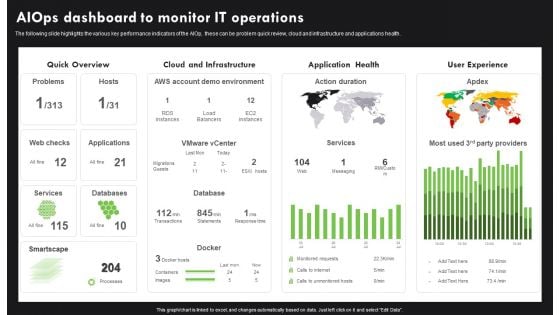
AI Deployment In IT Process Aiops Dashboard To Monitor IT Operations Infographics PDF
The following slide highlights the various key performance indicators of the AIOp, these can be problem quick review, cloud and infrastructure and applications health. If you are looking for a format to display your unique thoughts, then the professionally designed AI Deployment In IT Process Aiops Dashboard To Monitor IT Operations Infographics PDF is the one for you. You can use it as a Google Slides template or a PowerPoint template. Incorporate impressive visuals, symbols, images, and other charts. Modify or reorganize the text boxes as you desire. Experiment with shade schemes and font pairings. Alter, share or cooperate with other people on your work. Download AI Deployment In IT Process Aiops Dashboard To Monitor IT Operations Infographics PDF and find out how to give a successful presentation. Present a perfect display to your team and make your presentation unforgettable.
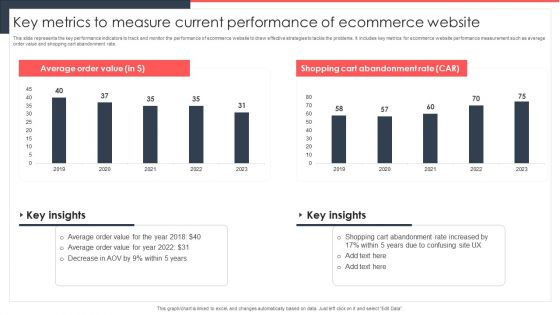
Implementing Management System To Enhance Ecommerce Processes Key Metrics To Measure Current Performance Themes PDF
This slide represents the key performance indicators to track and monitor the performance of ecommerce website to draw effective strategies to tackle the problems. It includes key metrics for ecommerce website performance measurement such as average order value and shopping cart abandonment rate. Do you know about Slidesgeeks Implementing Management System To Enhance Ecommerce Processes Key Metrics To Measure Current Performance Themes PDF. These are perfect for delivering any kind od presentation. Using it, create PowerPoint presentations that communicate your ideas and engage audiences. Save time and effort by using our pre designed presentation templates that are perfect for a wide range of topic. Our vast selection of designs covers a range of styles, from creative to business, and are all highly customizable and easy to edit. Download as a PowerPoint template or use them as Google Slides themes.
Implementing Effective Ecommerce Managemnet Platform Key Metrics To Measure Current Performance Clipart PDF
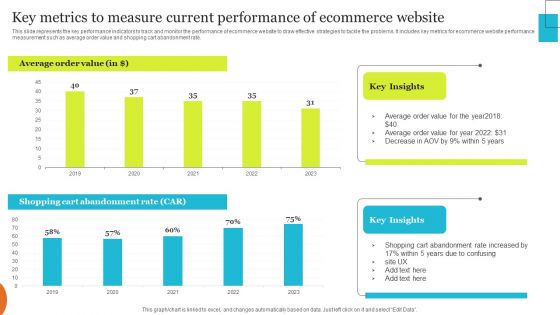
This slide represents the key performance indicators to track and monitor the performance of ecommerce website to draw effective strategies to tackle the problems. It includes key metrics for ecommerce website performance measurement such as average order value and shopping cart abandonment rate. Want to ace your presentation in front of a live audience Our Implementing Effective Ecommerce Managemnet Platform Key Metrics To Measure Current Performance Clipart PDF can help you do that by engaging all the users towards you. Slidegeeks experts have put their efforts and expertise into creating these impeccable powerpoint presentations so that you can communicate your ideas clearly. Moreover, all the templates are customizable, and easy to edit and downloadable. Use these for both personal and commercial use.
Ml And Big Data In Information Technology Processes Aiops Dashboard To Monitor IT Operations Sample PDF
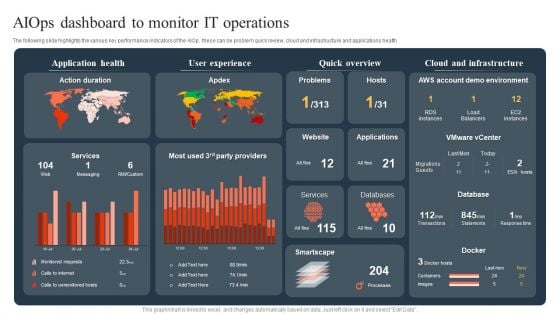
The following slide highlights the various key performance indicators of the AIOp, these can be problem quick review, cloud and infrastructure and applications health If you are looking for a format to display your unique thoughts, then the professionally designed Ml And Big Data In Information Technology Processes Aiops Dashboard To Monitor IT Operations Sample PDF is the one for you. You can use it as a Google Slides template or a PowerPoint template. Incorporate impressive visuals, symbols, images, and other charts. Modify or reorganize the text boxes as you desire. Experiment with shade schemes and font pairings. Alter, share or cooperate with other people on your work. Download Ml And Big Data In Information Technology Processes Aiops Dashboard To Monitor IT Operations Sample PDF and find out how to give a successful presentation. Present a perfect display to your team and make your presentation unforgettable.
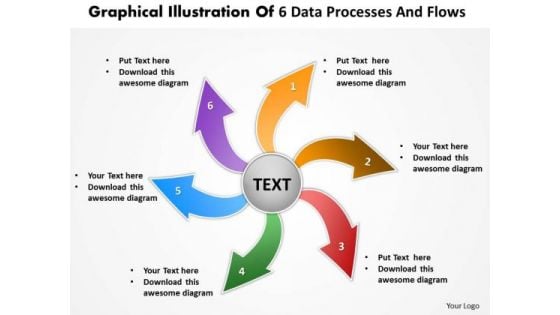
Illustration Of 6 Data Processes And Flows Circular Chart PowerPoint Templates
We present our illustration of 6 data processes and flows Circular Chart PowerPoint templates.Present our Arrows PowerPoint Templates because they are the indicators of the path you have in mind. Download our Circle Charts PowerPoint Templates because the ideas and plans are on your finger tips. Present our Shapes PowerPoint Templates because it shows how one can contribute to the overall feeling of well-being. Download our Business PowerPoint Templates because it will demonstrate the strength of character under severe stress. Shine the torch ahead and bring the light to shine on all. Present our Flow Charts PowerPoint Templates because you know what it takes to keep it fit and healthy.Use these PowerPoint slides for presentations relating to achievement, aim, around, arrow, blue, center, chart, circle, circular, connection, cursor, cycle, cyclic, decisions, direction, flow, graph, graphic, group, icon, illustration, isolated, loop, motion, movement, point, pointer, recycle, recycling, reuse, ring, rotation, round, sign, spin, symbol, target, team, teamwork, technology, turn, wheel, white. The prominent colors used in the PowerPoint template are Red, Green, Blue. Presenters tell us our illustration of 6 data processes and flows Circular Chart PowerPoint templates are Perfect. You can be sure our arrow PowerPoint templates and PPT Slides are Ultra. Professionals tell us our illustration of 6 data processes and flows Circular Chart PowerPoint templates are Nifty. People tell us our center PowerPoint templates and PPT Slides are Handsome. People tell us our illustration of 6 data processes and flows Circular Chart PowerPoint templates are Youthful. Professionals tell us our around PowerPoint templates and PPT Slides are Fancy. Address problems with our Illustration Of 6 Data Processes And Flows Circular Chart PowerPoint Templates. Download without worries with our money back guaranteee.
Presentation Diverging Process Arrow Chart 4 Steps Cycle PowerPoint Slides
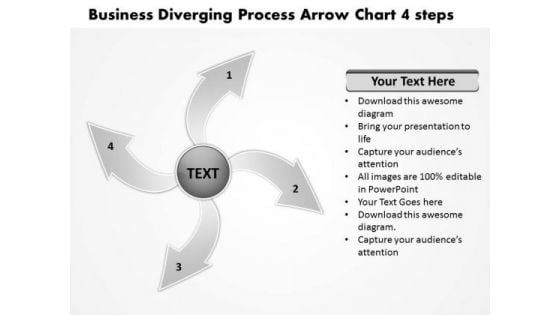
We present our presentation diverging process arrow chart 4 steps Cycle PowerPoint Slides.Present our Arrows PowerPoint Templates because this PPt slide highlights any anticipated problems, shortfalls or weak areas. Use our Flow charts PowerPoint Templates because displaying your ideas and highlighting your ability will accelerate the growth of your company and yours. Use our Process and Flows PowerPoint Templates because the fruit of your labour is about to ripen. Download and present our Business PowerPoint Templates because the great Bald headed Eagle embodies your personality. the eagle eye to seize upon the smallest of opportunities. Use our Shapes PowerPoint Templates because the ideas and plans are on your finger tips.Use these PowerPoint slides for presentations relating to Button,cerulean, circle, circulation, cobalt,colorful,cycle, element,emblem, grayshadow, green,icon, indicator, interface, internet, label,link, load, marker, motion, movement,navigationpanel, next, orientation, pagsite, pink, pointer, previous, process, reload, rotation, satined, sign, signpost,smooth, sticker, sticky, symbol. The prominent colors used in the PowerPoint template are Gray, Black, White. Customers tell us our presentation diverging process arrow chart 4 steps Cycle PowerPoint Slides are Zippy. We assure you our cobalt PowerPoint templates and PPT Slides are Pleasant. PowerPoint presentation experts tell us our presentation diverging process arrow chart 4 steps Cycle PowerPoint Slides are Fancy. People tell us our cycle PowerPoint templates and PPT Slides are Striking. We assure you our presentation diverging process arrow chart 4 steps Cycle PowerPoint Slides are Romantic. Use our circle PowerPoint templates and PPT Slides are Awesome. Our Presentation Diverging Process Arrow Chart 4 Steps Cycle PowerPoint Slides fall in step with your thought. They will go through the drill with you.
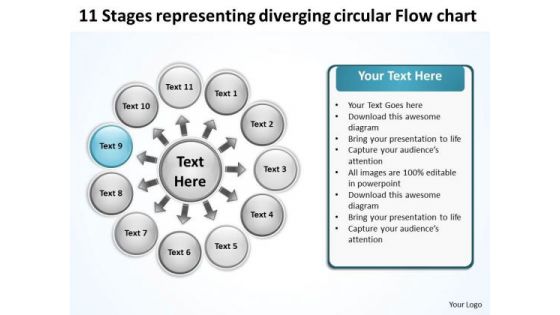
Representing Diverging Circular Flow Chart Process PowerPoint Slides
We present our representing diverging circular flow chart Process PowerPoint Slides.Use our Ring charts PowerPoint Templates because the lessons have been analyzed, studied and conclusions drawn. Present our Circle charts PowerPoint Templates because you will be able to Highlight these individual targets and the paths to their achievement. Use our Process and Flows PowerPoint Templates because this unique template give you an enthusiastic response and a purposeful Aye- Aye Sir. Download and present our Business PowerPoint Templates because you have had a great year or so business wise. It is time to celebrate the efforts of your team. Download our Marketing PowerPoint Templates because networking is an imperative in todays world. You need to access the views of others. Similarly you need to give access to them of your abilities.Use these PowerPoint slides for presentations relating to Cerulean, circle, circulation, cobalt,colorful, cyan, cycle, element,emblem, grayshadow, green,icon, indicator, interface, internet, label,link, load, marker, motion, movement,navigationpanel, next, orientation, pagsite, pink, pointer, previous, process, reload, rotation, satined, sign, signpost,smooth, sticker, sticky, symbol. The prominent colors used in the PowerPoint template are Blue light, Black, White. Customers tell us our representing diverging circular flow chart Process PowerPoint Slides are Lush. We assure you our cyan PowerPoint templates and PPT Slides are Adorable. PowerPoint presentation experts tell us our representing diverging circular flow chart Process PowerPoint Slides are Sparkling. People tell us our circulation PowerPoint templates and PPT Slides are Luxurious. We assure you our representing diverging circular flow chart Process PowerPoint Slides are Wistful. Use our element PowerPoint templates and PPT Slides are Handsome. Cure your organization's problems with our Representing Diverging Circular Flow Chart Process PowerPoint Slides. You will come out on top.


 Continue with Email

 Home
Home


