Risk Table
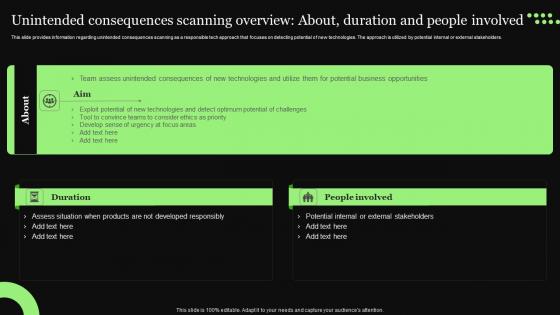
Ethical Technology Utilization Unintended Consequences Scanning Overview Designs Pdf
This slide provides information regarding unintended consequences scanning as a responsible tech approach that focuses on detecting potential of new technologies. The approach is utilized by potential internal or external stakeholders. From laying roadmaps to briefing everything in detail, our templates are perfect for you. You can set the stage with your presentation slides. All you have to do is download these easy to edit and customizable templates. Ethical Technology Utilization Unintended Consequences Scanning Overview Designs Pdf will help you deliver an outstanding performance that everyone would remember and praise you for. Do download this presentation today. This slide provides information regarding unintended consequences scanning as a responsible tech approach that focuses on detecting potential of new technologies. The approach is utilized by potential internal or external stakeholders.
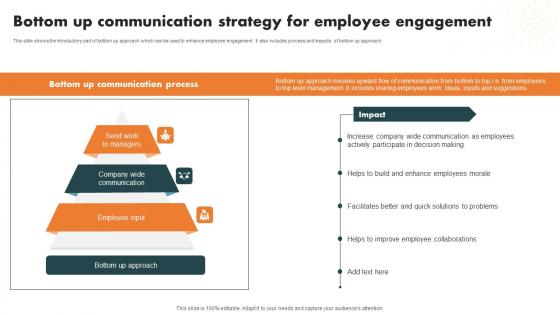
Bottom Up Communication Strategy Internal Branding Strategy Enhanced Advocacy Portrait Pdf
This slide shows the introductory part of bottom up approach which can be used to enhance employee engagement. It also includes process and impacts of bottom up approach. Want to ace your presentation in front of a live audience Our Bottom Up Communication Strategy Internal Branding Strategy Enhanced Advocacy Portrait Pdf can help you do that by engaging all the users towards you. Slidegeeks experts have put their efforts and expertise into creating these impeccable powerpoint presentations so that you can communicate your ideas clearly. Moreover, all the templates are customizable, and easy to edit and downloadable. Use these for both personal and commercial use. This slide shows the introductory part of bottom up approach which can be used to enhance employee engagement. It also includes process and impacts of bottom up approach.
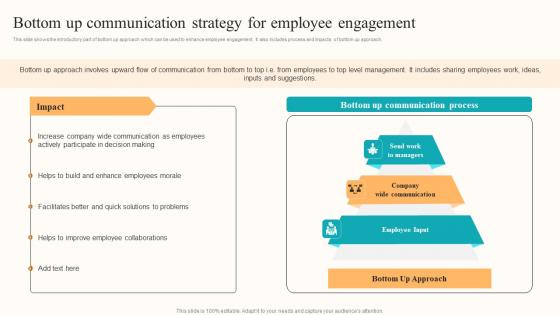
Bottom Up Communication Strategy Developing Employee Centric Marketing Graphics Pdf
This slide shows the introductory part of bottom up approach which can be used to enhance employee engagement. It also includes process and impacts of bottom up approach. Want to ace your presentation in front of a live audience Our Bottom Up Communication Strategy Developing Employee Centric Marketing Graphics Pdf can help you do that by engaging all the users towards you. Slidegeeks experts have put their efforts and expertise into creating these impeccable powerpoint presentations so that you can communicate your ideas clearly. Moreover, all the templates are customizable, and easy to edit and downloadable. Use these for both personal and commercial use. This slide shows the introductory part of bottom up approach which can be used to enhance employee engagement. It also includes process and impacts of bottom up approach.
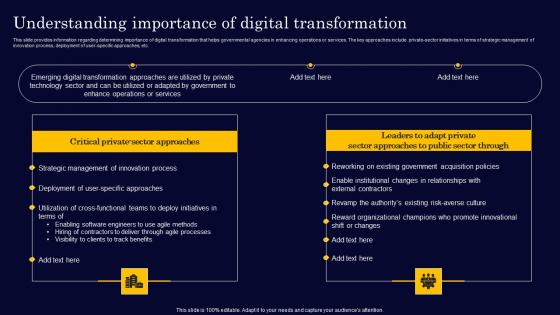
Understanding Importance Of Digital Transformation Gen Tech Stack Playbook Microsoft Pdf
This slide provides information regarding determining importance of digital transformation that helps governmental agencies in enhancing operations or services. The key approaches include private-sector initiatives in terms of strategic management of innovation process, deployment of user-specific approaches, etc. Take your projects to the next level with our ultimate collection of Understanding Importance Of Digital Transformation Gen Tech Stack Playbook Microsoft Pdf. Slidegeeks has designed a range of layouts that are perfect for representing task or activity duration, keeping track of all your deadlines at a glance. Tailor these designs to your exact needs and give them a truly corporate look with your own brand colors they will make your projects stand out from the rest This slide provides information regarding determining importance of digital transformation that helps governmental agencies in enhancing operations or services. The key approaches include private-sector initiatives in terms of strategic management of innovation process, deployment of user-specific approaches, etc.
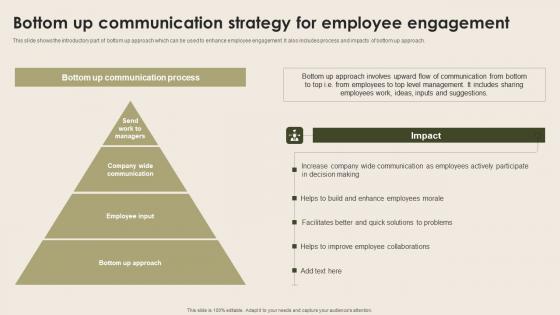
Bottom Up Communication Strategy For Employee Nurturing Positive Work Culture Structure Pdf
This slide shows the introductory part of bottom up approach which can be used to enhance employee engagement. It also includes process and impacts of bottom up approach. Want to ace your presentation in front of a live audience Our Bottom Up Communication Strategy For Employee Nurturing Positive Work Culture Structure Pdf can help you do that by engaging all the users towards you. Slidegeeks experts have put their efforts and expertise into creating these impeccable powerpoint presentations so that you can communicate your ideas clearly. Moreover, all the templates are customizable, and easy-to-edit and downloadable. Use these for both personal and commercial use. This slide shows the introductory part of bottom up approach which can be used to enhance employee engagement. It also includes process and impacts of bottom up approach.
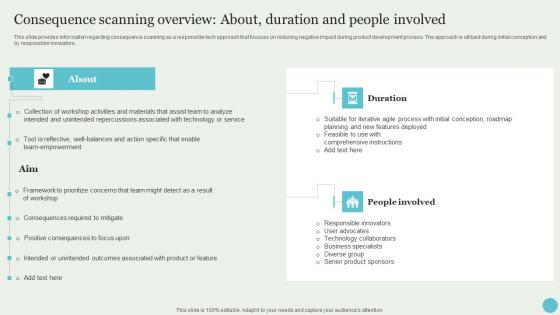
Consequence Scanning Overview About Duration And Crafting A Sustainable Company Background Pdf
This slide provides information regarding consequence scanning as a responsible tech approach that focuses on reducing negative impact during product development process. The approach is utilized during initial conception and by responsible innovators. There are so many reasons you need a Consequence Scanning Overview About Duration And Crafting A Sustainable Company Background Pdf. The first reason is you can not spend time making everything from scratch, Thus, Slidegeeks has made presentation templates for you too. You can easily download these templates from our website easily. This slide provides information regarding consequence scanning as a responsible tech approach that focuses on reducing negative impact during product development process. The approach is utilized during initial conception and by responsible innovators.
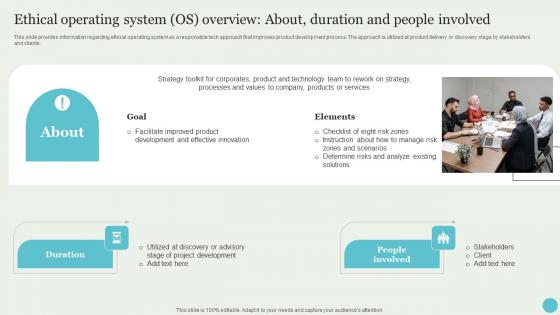
Ethical Operating System OS Overview About Duration Crafting A Sustainable Company Summary Pdf
This slide provides information regarding ethical operating system as a responsible tech approach that improves product development process. The approach is utilized at product delivery or discovery stage by stakeholders and clients. If your project calls for a presentation, then Slidegeeks is your go-to partner because we have professionally designed, easy-to-edit templates that are perfect for any presentation. After downloading, you can easily edit Ethical Operating System OS Overview About Duration Crafting A Sustainable Company Summary Pdf and make the changes accordingly. You can rearrange slides or fill them with different images. Check out all the handy templates This slide provides information regarding ethical operating system as a responsible tech approach that improves product development process. The approach is utilized at product delivery or discovery stage by stakeholders and clients.
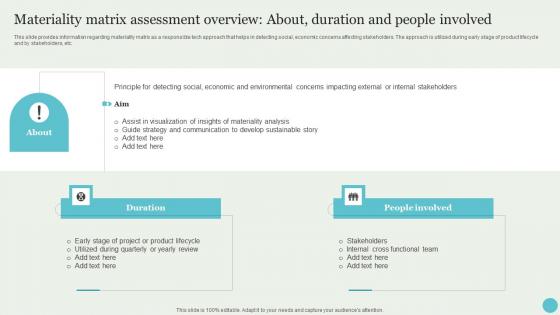
Materiality Matrix Assessment Overview About Duration Crafting A Sustainable Company Themes Pdf
This slide provides information regarding materiality matrix as a responsible tech approach that helps in detecting social, economic concerns affecting stakeholders. The approach is utilized during early stage of product lifecycle and by stakeholders, etc. Take your projects to the next level with our ultimate collection of Materiality Matrix Assessment Overview About Duration Crafting A Sustainable Company Themes Pdf. Slidegeeks has designed a range of layouts that are perfect for representing task or activity duration, keeping track of all your deadlines at a glance. Tailor these designs to your exact needs and give them a truly corporate look with your own brand colors they will make your projects stand out from the rest This slide provides information regarding materiality matrix as a responsible tech approach that helps in detecting social, economic concerns affecting stakeholders. The approach is utilized during early stage of product lifecycle and by stakeholders, etc.
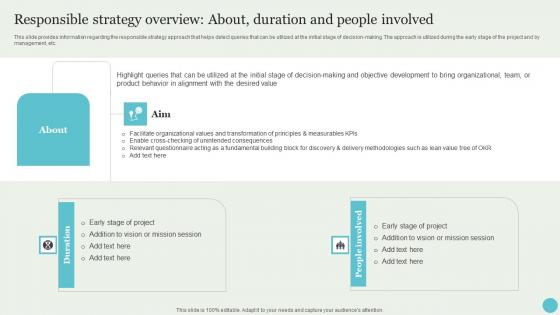
Responsible Strategy Overview About Duration And Crafting A Sustainable Company Template Pdf
This slide provides information regarding the responsible strategy approach that helps detect queries that can be utilized at the initial stage of decision-making. The approach is utilized during the early stage of the project and by management, etc. Find a pre-designed and impeccable Responsible Strategy Overview About Duration And Crafting A Sustainable Company Template Pdf. The templates can ace your presentation without additional effort. You can download these easy-to-edit presentation templates to make your presentation stand out from others. So, what are you waiting for Download the template from Slidegeeks today and give a unique touch to your presentation. This slide provides information regarding the responsible strategy approach that helps detect queries that can be utilized at the initial stage of decision-making. The approach is utilized during the early stage of the project and by management, etc.
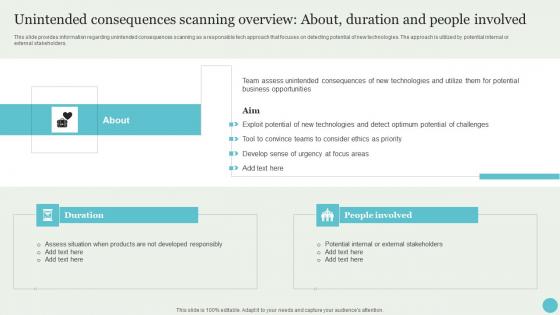
Unintended Consequences Scanning Overview About Crafting A Sustainable Company Topics Pdf
This slide provides information regarding unintended consequences scanning as a responsible tech approach that focuses on detecting potential of new technologies. The approach is utilized by potential internal or external stakeholders. Slidegeeks is here to make your presentations a breeze with Unintended Consequences Scanning Overview About Crafting A Sustainable Company Topics Pdf With our easy-to-use and customizable templates, you can focus on delivering your ideas rather than worrying about formatting. With a variety of designs to choose from, you are sure to find one that suits your needs. And with animations and unique photos, illustrations, and fonts, you can make your presentation pop. So whether you are giving a sales pitch or presenting to the board, make sure to check out Slidegeeks first This slide provides information regarding unintended consequences scanning as a responsible tech approach that focuses on detecting potential of new technologies. The approach is utilized by potential internal or external stakeholders.
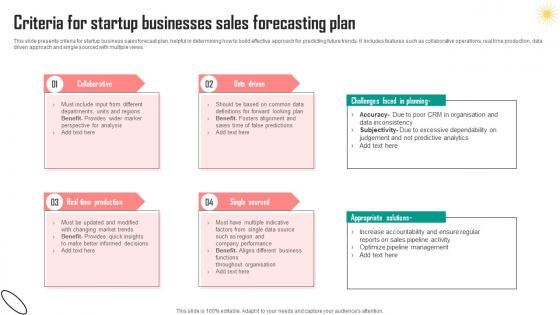
Criteria For Startup Businesses Sales Forecasting Plan Sample Pdf
This slide presents criteria for startup business sales forecast plan, helpful in determining how to build effective approach for predicting future trends. It includes features such as collaborative operations, real time production, data driven approach and single sourced with multiple views Pitch your topic with ease and precision using this Criteria For Startup Businesses Sales Forecasting Plan Sample Pdf. This layout presents information on Collaborative, Time Production, Data Driven. It is also available for immediate download and adjustment. So, changes can be made in the color, design, graphics or any other component to create a unique layout. This slide presents criteria for startup business sales forecast plan, helpful in determining how to build effective approach for predicting future trends. It includes features such as collaborative operations, real time production, data driven approach and single sourced with multiple views
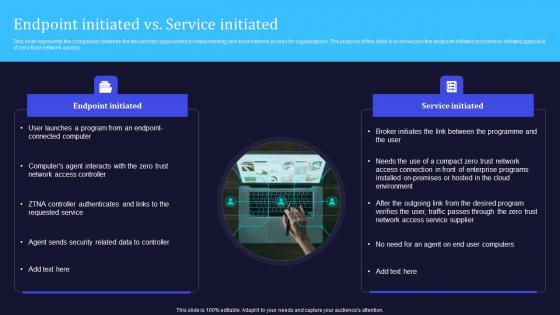
Zero Trust Model Endpoint Initiated Vs Service Initiated
This slide represents the comparison between the two primary approaches to implementing zero-trust network access for organizations. The purpose of this slide is to showcase the endpoint-initiated and service-initiated approach of zero-trust network access. Crafting an eye-catching presentation has never been more straightforward. Let your presentation shine with this tasteful yet straightforward Zero Trust Model Endpoint Initiated Vs Service Initiated template. It offers a minimalistic and classy look that is great for making a statement. The colors have been employed intelligently to add a bit of playfulness while still remaining professional. Construct the ideal Zero Trust Model Endpoint Initiated Vs Service Initiated that effortlessly grabs the attention of your audience Begin now and be certain to wow your customers. This slide represents the comparison between the two primary approaches to implementing zero-trust network access for organizations. The purpose of this slide is to showcase the endpoint-initiated and service-initiated approach of zero-trust network access.

Zero Trust Network Access Endpoint Initiated Vs Service Initiated
This slide represents the comparison between the two primary approaches to implementing zero-trust network access for organizations. The purpose of this slide is to showcase the endpoint-initiated and service-initiated approach of zero-trust network access. The Zero Trust Network Access Endpoint Initiated Vs Service Initiated is a compilation of the most recent design trends as a series of slides. It is suitable for any subject or industry presentation, containing attractive visuals and photo spots for businesses to clearly express their messages. This template contains a variety of slides for the user to input data, such as structures to contrast two elements, bullet points, and slides for written information. Slidegeeks is prepared to create an impression. This slide represents the comparison between the two primary approaches to implementing zero-trust network access for organizations. The purpose of this slide is to showcase the endpoint-initiated and service-initiated approach of zero-trust network access.

Integration Methods Plug And Play Overview Data Integration Strategies For Business
This slide discusses the second common approach to data integration which is plug and play. The purpose of this slide is to explain the approach and highlights its benefits and limitation including ideal for small to medium-sized businesses, limited functionality can hinder business growth respectively, and so on. There are so many reasons you need a Integration Methods Plug And Play Overview Data Integration Strategies For Business. The first reason is you can not spend time making everything from scratch, Thus, Slidegeeks has made presentation templates for you too. You can easily download these templates from our website easily. This slide discusses the second common approach to data integration which is plug and play. The purpose of this slide is to explain the approach and highlights its benefits and limitation including ideal for small to medium-sized businesses, limited functionality can hinder business growth respectively, and so on.

Navigating B2B Sales Solution Selling Overview Core Principles And Benefits SA SS V
This slide provide a brief overview of B2B solution selling approach along with benefits. It includes core principles such as customer centric focus, value proposition, consultative approach and long term relationship. Slidegeeks is here to make your presentations a breeze with Navigating B2B Sales Solution Selling Overview Core Principles And Benefits SA SS V With our easy-to-use and customizable templates, you can focus on delivering your ideas rather than worrying about formatting. With a variety of designs to choose from, you are sure to find one that suits your needs. And with animations and unique photos, illustrations, and fonts, you can make your presentation pop. So whether you are giving a sales pitch or presenting to the board, make sure to check out Slidegeeks first This slide provide a brief overview of B2B solution selling approach along with benefits. It includes core principles such as customer centric focus, value proposition, consultative approach and long term relationship.
Navigating B2B Sales Steps Involved In B2B Transactional Selling Process SA SS V
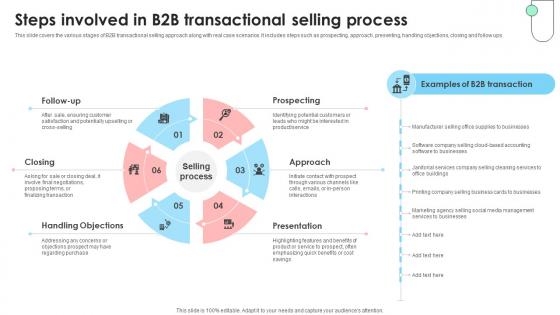
This slide covers the various stages of B2B transactional selling approach along with real case scenarios. It includes steps such as prospecting, approach, presenting, handling objections, closing and follow ups. If your project calls for a presentation, then Slidegeeks is your go-to partner because we have professionally designed, easy-to-edit templates that are perfect for any presentation. After downloading, you can easily edit Navigating B2B Sales Steps Involved In B2B Transactional Selling Process SA SS V and make the changes accordingly. You can rearrange slides or fill them with different images. Check out all the handy templates This slide covers the various stages of B2B transactional selling approach along with real case scenarios. It includes steps such as prospecting, approach, presenting, handling objections, closing and follow ups.
Employee Relations In Human Resource Bottom Up Communication Strategy For Employee Engagement
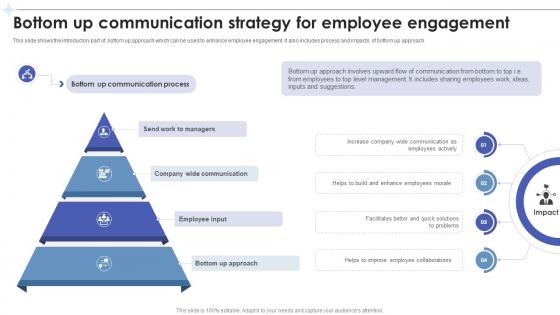
This slide shows the introductory part of bottom up approach which can be used to enhance employee engagement. It also includes process and impacts of bottom up approach. Want to ace your presentation in front of a live audience Our Employee Relations In Human Resource Bottom Up Communication Strategy For Employee Engagement can help you do that by engaging all the users towards you. Slidegeeks experts have put their efforts and expertise into creating these impeccable powerpoint presentations so that you can communicate your ideas clearly. Moreover, all the templates are customizable, and easy-to-edit and downloadable. Use these for both personal and commercial use. This slide shows the introductory part of bottom up approach which can be used to enhance employee engagement. It also includes process and impacts of bottom up approach.
Business Diagram 3d Bulb Graphic For Data Driven And Idea Generation PowerPoint Slide
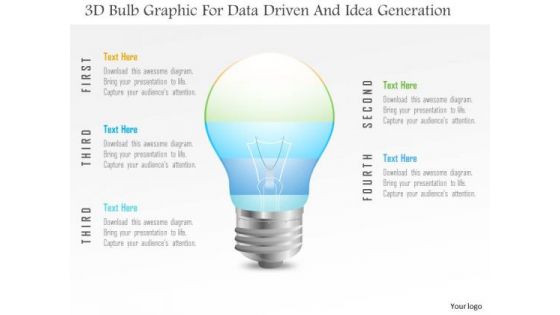
This Power Point template has been designed with 3d bulb graphic. Use this slide to represent technology idea and strategy concepts. Download this diagram for your business presentations and get exclusive comments on your efforts.
Business Diagram 3d Colorful Pie Graph With Magnifier Data Search PowerPoint Slide
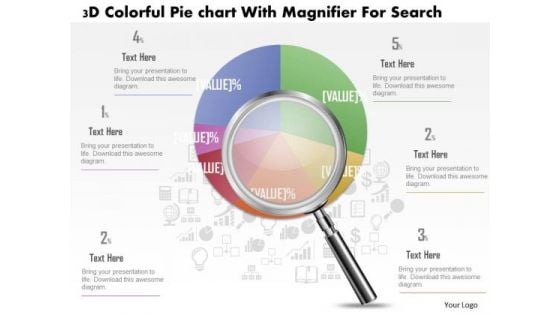
This business slide displays 3d colorful pie graph with magnifier. This diagram is a data visualization tool that gives you a simple way to present statistical information. This slide helps your audience examine and interpret the data you present.
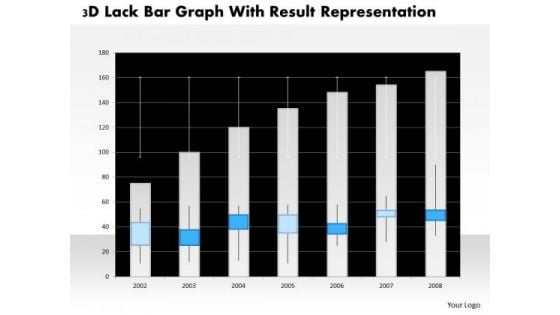
Business Diagram 3d Lack Bar Graph With Result Representation PowerPoint Slide
This business diagram has graphic of 3d lack bar graph. This diagram is a data visualization tool that gives you a simple way to present statistical information. This slide helps your audience examine and interpret the data you present.
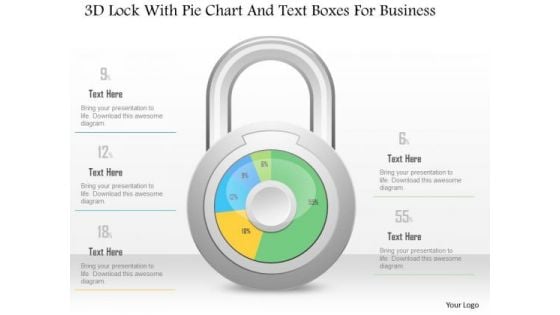
Business Diagram 3d Lock With Pie Chart And Text Boxes For Business PowerPoint Slide
This Power Point diagram has been crafted with pie chart in shape of lock. It contains diagram of lock pie chart to compare and present data in an effective manner. Use this diagram to build professional presentations for your viewers.
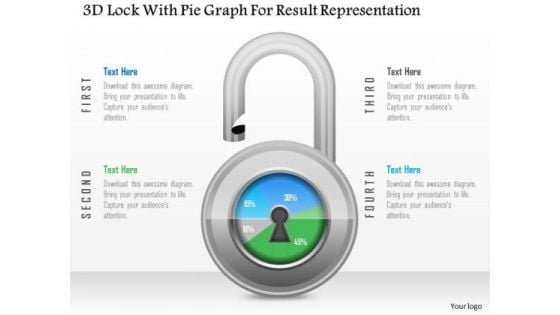
Business Diagram 3d Lock With Pie Graph For Result Representation PowerPoint Slide
This Power Point diagram has been crafted with pie chart in shape of lock. It contains diagram of lock pie chart to compare and present data in an effective manner. Use this diagram to build professional presentations for your viewers.
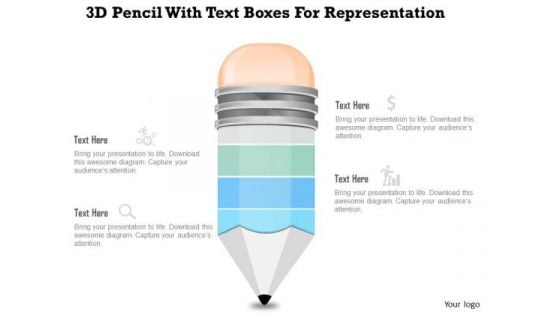
Business Diagram 3d Pencil With Text Boxes For Representation PowerPoint Slide
This Power Point diagram displays graphic of pencil with icons and text spaces. It contains diagram of colorful pencil for data display. Use this diagram to build professional presentations for your viewers.
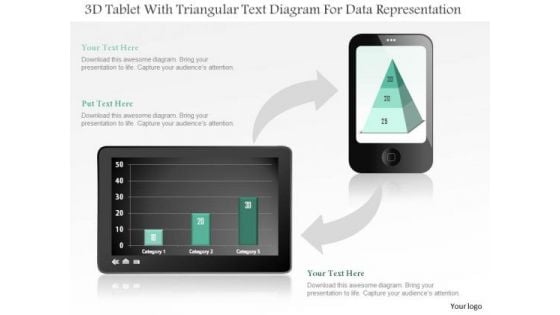
Business Diagram 3d Tablet With Triangular Text Diagram For Data Representation PowerPoint Slide
This business diagram displays bar graph on tablet and pyramid chart on mobile phone. Use this diagram, to make reports for interactive business presentations. Create professional presentations using this diagram.
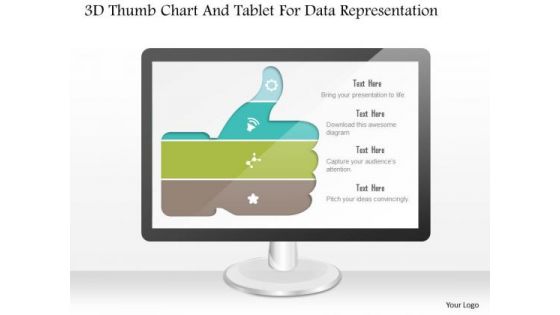
Business Diagram 3d Thumb Chart And Tablet For Data Representation PowerPoint Slide
This business diagram displays graphic of 3d thumb up chart with icons on computer screen. This business slide contains the concept of business data representation. Use this diagram to build professional presentations for your viewers.
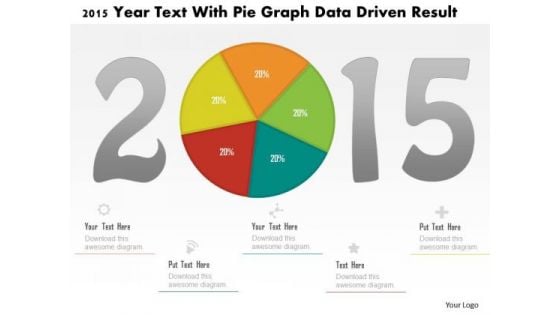
Business Diagram 2015 Year Text With Pie Graph Data Driven Result PowerPoint Slide
This business diagram displays 2015 year numbers with pie chart. This diagram is suitable to display business strategy for year 2015. Download this professional slide to present information in an attractive manner
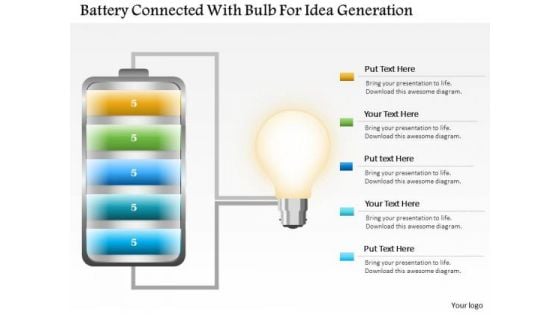
Business Diagram Battery Connected With Bulb For Idea Generation PowerPoint Slide
This business slide displays battery icon connected with bulb. This diagram is a data visualization tool that gives you a simple way to present statistical information. This slide helps your audience examine and interpret the data you present.
Business Diagram Battery Icon With Power Icons Energy Technology PowerPoint Slide
This business diagram displays battery icon with power charging. Use this diagram, in your presentations to display energy saving, battery and technology. Create professional presentations using this diagram slide.
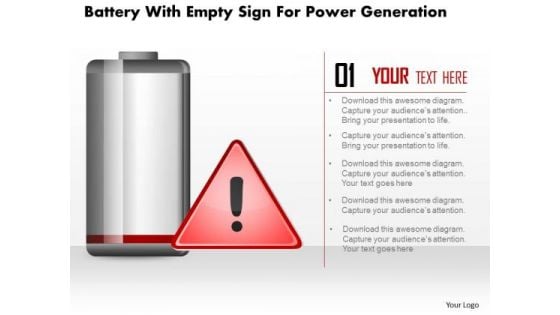
Business Diagram Battery With Empty Sign For Power Generation PowerPoint Slide
This business diagram displays empty sign alert on battery icon. Use this diagram, in your presentations to display energy saving, battery and technology. Create professional presentations using this diagram slide.

Business Diagram Data Driven Pie Chart Inside The Magnifier PowerPoint Slide
This business slide displays 3d colorful pie graph with magnifier. This diagram is a data visualization tool that gives you a simple way to present statistical information. This slide helps your audience examine and interpret the data you present.
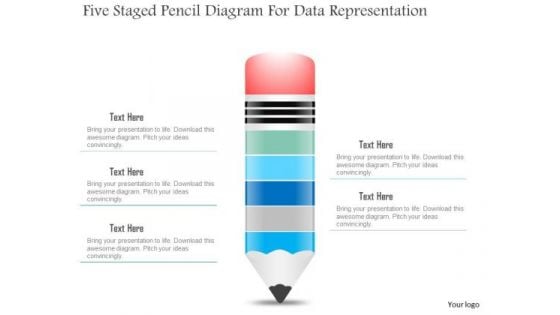
Business Diagram Five Staged Pencil Diagram For Data Representation PowerPoint Slide
This business slide displays five staged pencil diagram. It contains pencil graphic divided into five parts. This diagram slide depicts processes, stages, steps, points, options and education information display. Use this diagram, in your presentations to express your views innovatively.
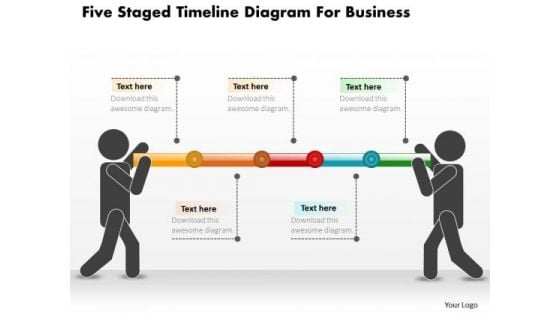
Business Diagram Five Staged Timeline Diagram For Business PowerPoint Slide
This PowerPoint template displays five points timeline diagram. This business diagram has been designed with graphic of timeline with five points, text space and start, end points. Use this diagram, in your presentations to display process steps, stages, timelines and business management. Make wonderful presentations using this business slide.
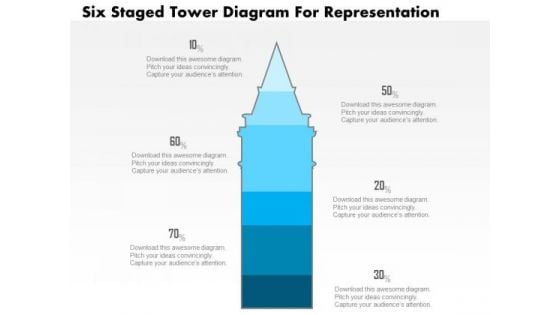
Business Diagram Five Staged Tower Diagram For Representation PowerPoint Slide
This business slide displays five staged tower diagram. It contains blue tower graphic divided into five parts. This diagram slide depicts processes, stages, steps, points, options information display. Use this diagram, in your presentations to express your views innovatively.
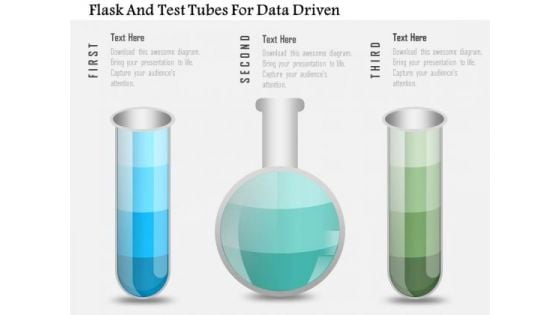
Business Diagram Flask And Test Tubes For Data Driven PowerPoint Slide
This data driven diagram has been designed with flask and test tubes. Download this diagram to give your presentations more effective look. It helps in clearly conveying your message to clients and audience.
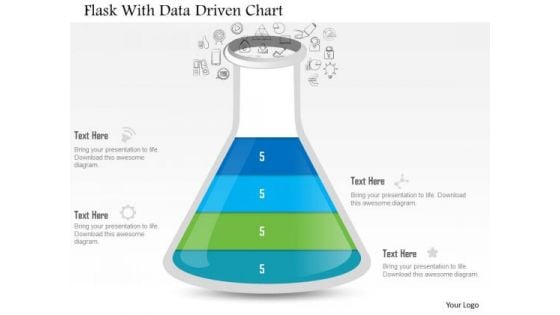
Business Diagram Flask With Data Driven Chart PowerPoint Slide
This data driven diagram has been designed with flask graphics. Download this diagram to give your presentations more effective look. It helps in clearly conveying your message to clients and audience.
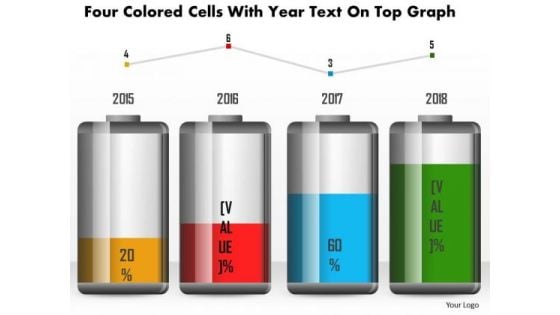
Business Diagram Four Colored Cells With Year Text On Top Graph PowerPoint Slide
This business diagram has been designed with battery cell graphic for business timeline. This slide can be used for business planning and management. Use this diagram for your business and success milestones related presentations.
Business Diagram Green Battery Cell With Full Charging Symbol PowerPoint Slide
This business diagram displays full battery charge icon. Use this diagram, in your presentations to display energy saving, battery and technology. Create professional presentations using this diagram slide.
Business Diagram Hour Glass With 3d Man And Icons PowerPoint Slide
This diagram displays 3d man with hour glass and icons. This diagram contains concept of communication and technology. Use this diagram to display business process workflows in any presentations.
Business Diagram Human Icons With Bubbles And Different Icons Inside PowerPoint Slide
This diagram displays graph with percentage value growth. This business slide is suitable to present and compare business data. Use this diagram to build professional presentations for your viewers.
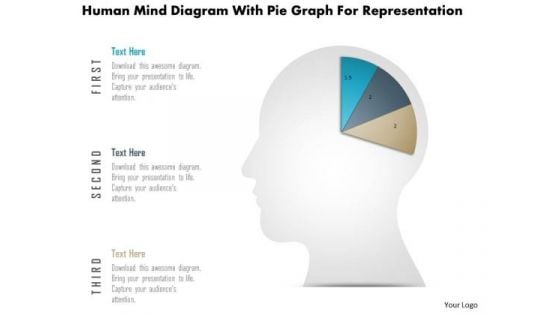
Business Diagram Human Mind Diagram With Pie Graph For Representation PowerPoint Slide
This diagram displays human face graphic divided into sections. This section can be used for data display. Use this diagram to build professional presentations for your viewers.
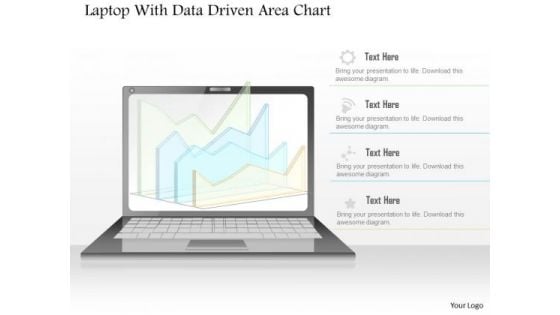
Business Diagram Laptop With Data Driven Area Chart PowerPoint Slide
This diagram has been designed with laptop and data driven area chart. Download this diagram to give your presentations more effective look. It helps in clearly conveying your message to clients and audience.

Business Diagram Six Staged Pie Charts For Text Representation PowerPoint Slide
This slide displays graphic six staged pie charts. Download this diagram to present and compare business data. Use this diagram to display business process workflows in any presentation.

Business Diagram Three Heads With Pie For Data Driven Technology PowerPoint Slide
This business diagram displays three human faces with pie charts. This Power Point template has been designed to compare and present business data. You may use this diagram to impart professional appearance to your presentations.

Business Diagram Three Staged Pencil Diagram For Graph Formation PowerPoint Slide
This business diagram displays set of pencils. This Power Point template has been designed to compare and present business data. Download this diagram to represent stages of business growth.
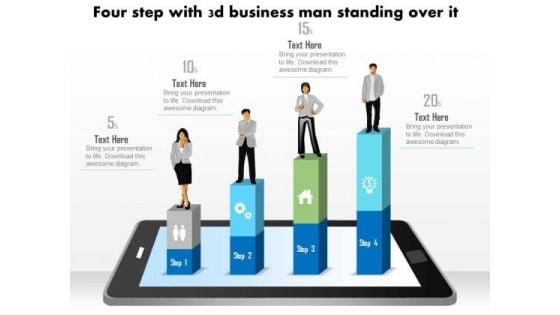
Business Diagram Four Steps With 3d Business Person Standing Over It PowerPoint Slide
This business diagram displays bar graph with business person standing on it. This Power Point template has been designed to display personal growth. You may use this diagram to impart professional appearance to your presentations.
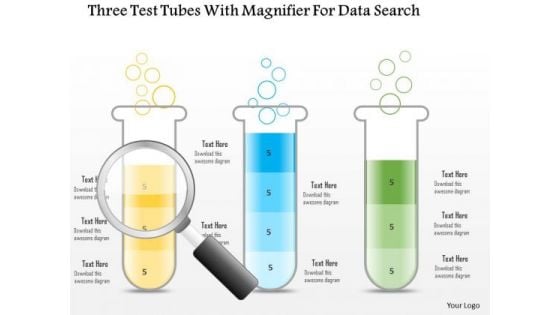
Business Diagram Three Test Tubes With Magnifier For Data Search PowerPoint Slide
This business diagram displays three test tubes with magnifying glass. This diagram is suitable to depict flow of business activities or steps. Download this professional slide to present information in an attractive manner.
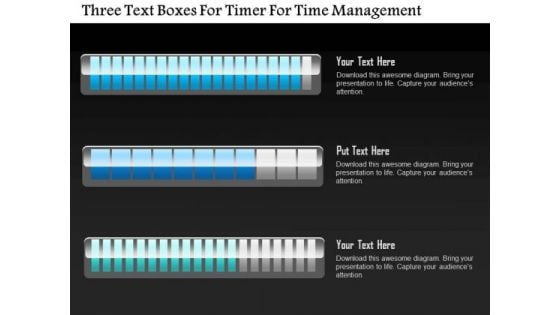
Business Diagram Three Text Boxes For Timer For Time Management PowerPoint Slide
This business diagram displays three text boxes. This diagram contains text boxes for data representation. Use this diagram to display business process workflows in any presentations.
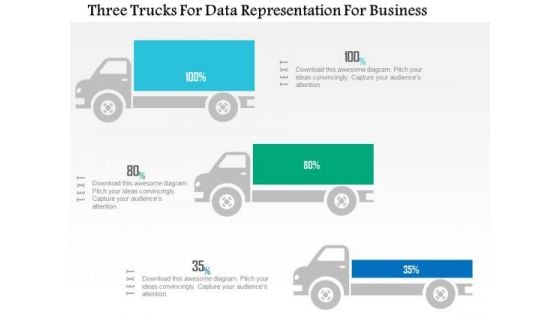
Business Diagram Three Trucks For Data Representation For Business PowerPoint Slide
This business diagram displays three trucks graphic. This diagram contains trucks for percentage value growth. Use this diagram to display business growth over a period of time.
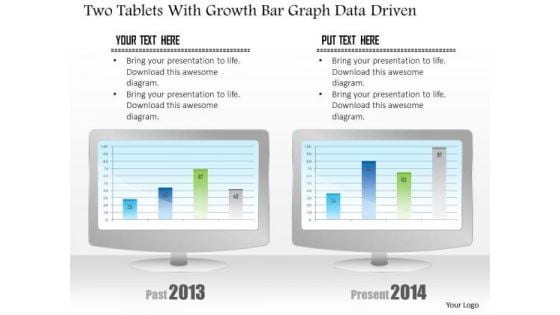
Business Diagram Two Tablets With Growth Bar Graph Data Driven PowerPoint Slide
This business diagram has been designed with comparative charts on tablets. This slide suitable for data representation. You can also use this slide to present business reports and information. Use this diagram to present your views in a wonderful manner.
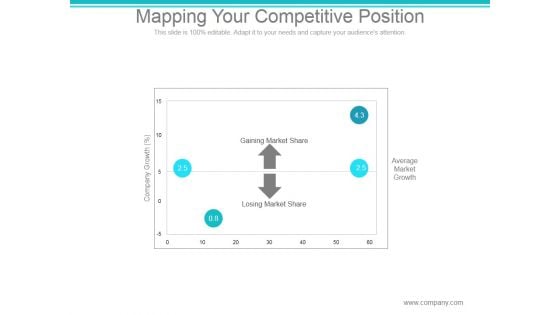
Mapping Your Competitive Position Ppt PowerPoint Presentation Files
This is a mapping your competitive position ppt powerpoint presentation files. This is a four stage process. The stages in this process are gaining market share, losing market share, company growth, average market growth.
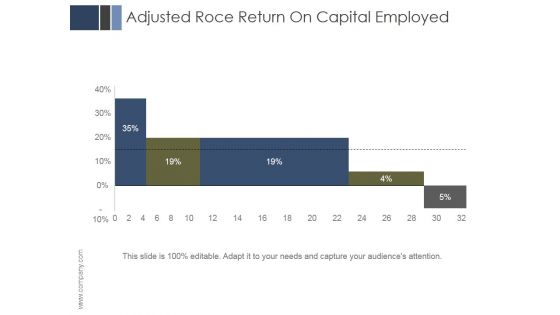
Adjusted Roce Return On Capital Employed Ppt PowerPoint Presentation Samples
This is a adjusted roce return on capital employed ppt powerpoint presentation samples. This is a five stage process. The stages in this process are business, marketing, management, finance, return.
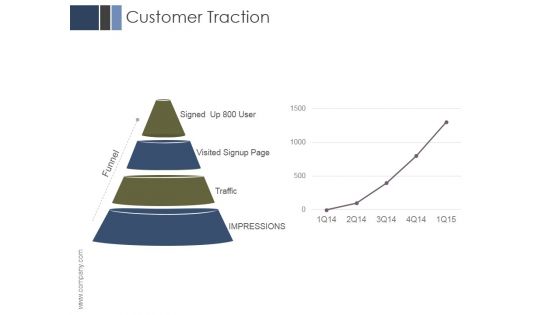
Customer Traction Ppt PowerPoint Presentation Information
This is a customer traction ppt powerpoint presentation information. This is a four stage process. The stages in this process are signed up, visited signup page, traffic, impressions, funnel.
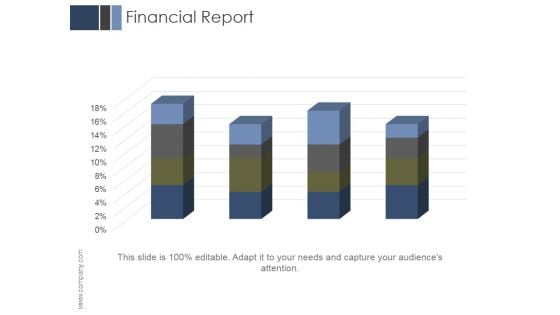
Financial Report Ppt PowerPoint Presentation Templates
This is a financial report ppt powerpoint presentation templates. This is a four stage process. The stages in this process are business, marketing, management, finance, report.
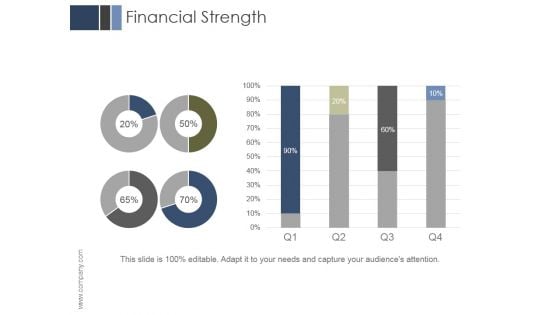
Financial Strength Ppt PowerPoint Presentation Graphics
This is a financial strength ppt powerpoint presentation graphics. This is a four stage process. The stages in this process are business, marketing, management, finance, strength.
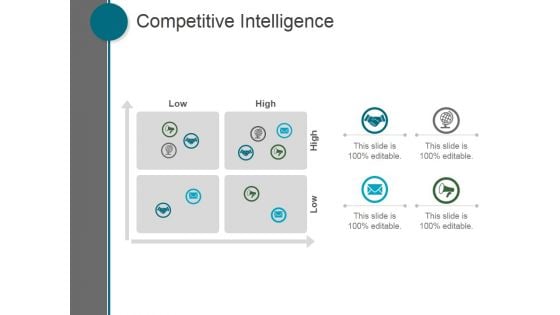
Competitive Intelligence Ppt PowerPoint Presentation Example 2015
This is a competitive intelligence ppt powerpoint presentation example 2015. This is a four stage process. The stages in this process are business, marketing, management, matrix, planning.
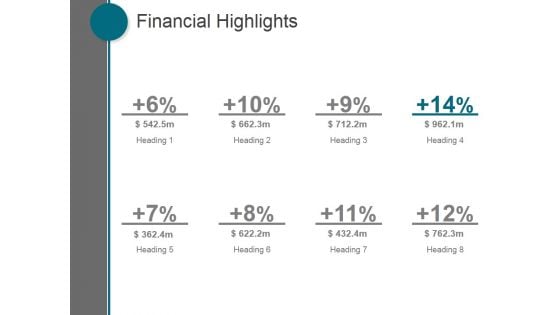
Financial Highlights Ppt PowerPoint Presentation Visual Aids
This is a financial highlights ppt powerpoint presentation visual aids. This is a eight stage process. The stages in this process are business, marketing, management, finance, strategy.
Newspaper Ppt PowerPoint Presentation Background Images
This is a newspaper ppt powerpoint presentation background images. This is a one stage process. The stages in this process are business, marketing, newspaper, advertisement, management.
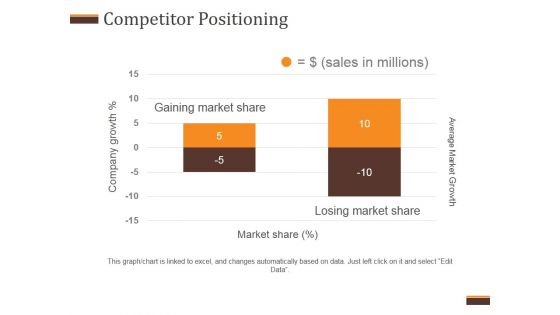
Competitor Positioning Ppt PowerPoint Presentation Summary
This is a competitor positioning ppt powerpoint presentation summary. This is a two stage process. The stages in this process are average market growth, gaining market share, losing market share, company growth.

Budgeting Planned Actual Comparison Ppt PowerPoint Presentation Shapes
This is a budgeting planned actual comparison ppt powerpoint presentation shapes. This is a three stage process. The stages in this process are planned cost, actual cost, value difference, finance, timeline.
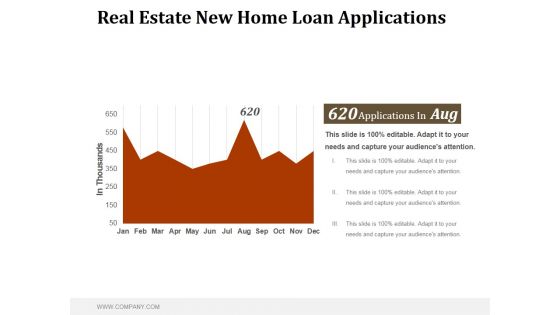
Real Estate New Home Loan Applications Ppt PowerPoint Presentation Samples
This is a real estate new home loan applications ppt powerpoint presentation samples. This is a one stage process. The stages in this process are business, marketing, finance, management, applications.


 Continue with Email

 Home
Home


