Road Icon
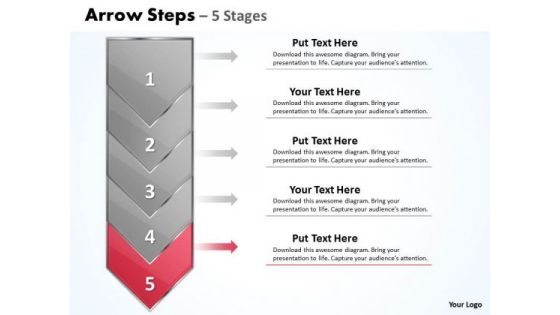
Marketing PowerPoint Template Hierarchical State Diagram Ppt Represented By Arrow 6 Design
We present our marketing PowerPoint template hierarchical state diagram ppt represented by arrow 6 design. Use our Advertising PowerPoint Templates because; Ring them out loud with your brilliant ideas. Use our Arrows PowerPoint Templates because, Puzzles or Jigsaw Template: - It is all there in bits and pieces. Use our Shapes PowerPoint Templates because, our presentation designs are for those on the go. Use our Business PowerPoint Templates because, Marketing Strategy Business Template: - maximizing sales of your product is the intended destination. Use our Process and Flows PowerPoint Templates because, It is in your DNA to analyze possible causes to the minutest detail. Use these PowerPoint slides for presentations relating to advertising, arrow, background, banner, blue, bookmark, card, choice, concept, creative, design, direction, flow, label, manual, marketing, modern, next, number, offer, page, paper, pointer, process, product, promotion, sequence, simple, step, symbol. The prominent colors used in the PowerPoint template are Red, Gray, and Black Interpret plans with our Marketing PowerPoint Template Hierarchical State Diagram Ppt Represented By Arrow 6 Design. Download without worries with our money back guaranteee.
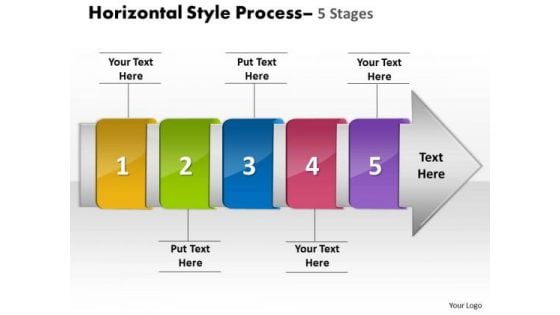
Ppt Horizontal Flow Of 5 Stage Free Fishbone Diagram PowerPoint Template 1 Design
We present our PPT horizontal flow of 5 stage free fishbone diagram PowerPoint template 1 design. Use our Design PowerPoint Templates because, your quicksilver ideas are the arrows in your quiver. Use our Shapes PowerPoint Templates because, All elements of the venture are equally critical. Use our Business PowerPoint Templates because, Profit fairly earned is what you believe in. Use our Process and Flows PowerPoint Templates because, transmit your thoughts via our slides and prod your team to action. Use our Arrows PowerPoint Templates because, Business Template: - There is a vision, a need you can meet. Use these PowerPoint slides for presentations relating to accent, advertisement, aqua, arrow, blank, business, button, collection, color, decoration, design, direction, element, empty, financial, flow, graph, green, grey, horizontal, instruction, isolated, placard, process, promo, promotion, sale, set, shape, shiny, silver, steps, symbol. The prominent colors used in the PowerPoint template are Red, Green, and Blue navy Define growth with our Ppt Horizontal Flow Of 5 Stage Free Fishbone Diagram PowerPoint Template 1 Design. Download without worries with our money back guaranteee.
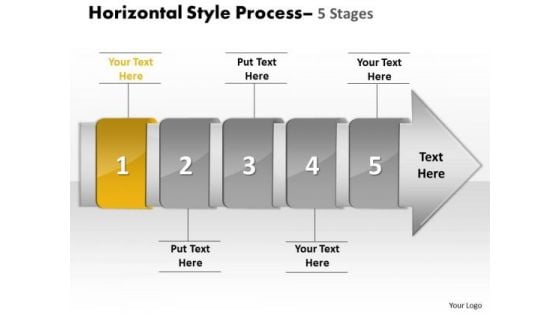
Ppt Horizontal Flow Of 5 Stage Free Fishbone Diagram PowerPoint Template 2 Design
We present our PPT horizontal flow of 5 stage free fishbone diagram PowerPoint template 2 design. Use our Design PowerPoint Templates because; enlighten others on your team with your views. Use our Shapes PowerPoint Templates because; amplify on this basic corporate concept and forefront the benefits of overlapping processes to arrive at common goals. Use our Business PowerPoint Templates because, Marketing Strategy Business Template: - Maximizing sales of your product is the intended destination. Use our Process and Flows PowerPoint Templates because, organize your thoughts and illuminate your ideas accordingly. Use our Arrows PowerPoint Templates because, you have some excellent plans to spread some more of it across your community. Use these PowerPoint slides for presentations relating to accent, advertisement, aqua, arrow, blank, business, button, collection, color, decoration, design, direction, element, empty, financial, flow, graph, green, grey, horizontal, instruction, isolated, placard, process, promo, promotion, sale, set, shape, shiny, silver, steps, symbol. The prominent colors used in the PowerPoint template are Yellow, Gray, and White Win awards with our Ppt Horizontal Flow Of 5 Stage Free Fishbone Diagram PowerPoint Template 2 Design. You will come out on top.
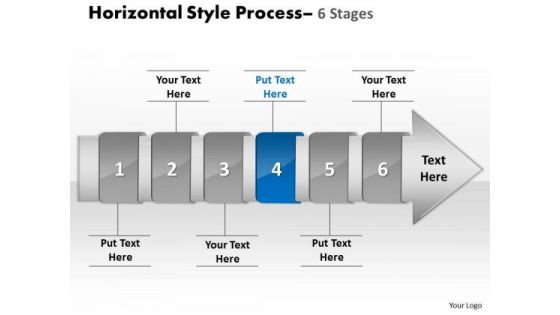
Ppt Horizontal Flow Of 6 Stage Cause And Effect Diagram PowerPoint Template 5 Graphic
We present our PPT horizontal flow of 6 stage cause and effect diagram PowerPoint template 5 Graphic. Use our Design PowerPoint Templates because, you have made significant headway in this field. Use our Shapes PowerPoint Templates because, are the tools that helped most of us evolve. Use our Business PowerPoint Templates because, Marketing Strategy Business Template: - Maximizing sales of your product is the intended destination. Use our Process and Flows PowerPoint Templates because, However there is a key aspect to be emphasized. Use our Arrows PowerPoint Templates because; in any endeavor people matter most. Use these PowerPoint slides for presentations relating to accent, advertisement, aqua, arrow, blank, business, button, collection, color, decoration, design, direction, element, empty, financial, flow, graph, green, grey, horizontal, instruction, isolated, placard, process, promo, promotion, sale, set, shape, shiny, silver, steps, symbol. The prominent colors used in the PowerPoint template are Blue navy, White, Gray Let the audience experience the beauty of our Ppt Horizontal Flow Of 6 Stage Cause And Effect Diagram PowerPoint Template 5 Graphic. They will be beholden to you.
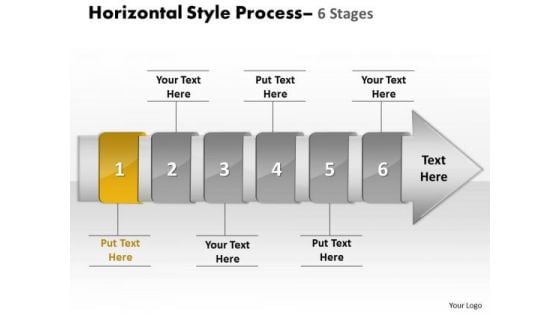
Ppt Horizontal Flow Of 6 Stage Diagram Marketing Presentation PowerPoint 2 Graphic
We present our PPT horizontal flow of 6 stage diagram marketing presentation PowerPoint 2 Graphic. Use our Arrows PowerPoint Templates because, Signpost your preferred roadmap to your eager co- travelers and demonstrate clearly how you intend to navigate them towards the desired corporate goal. Use our Shapes PowerPoint Templates because, you have the plans to increase the strength of your business relationships. Use our Business PowerPoint Templates because, But you have an idea of which you are sure. Use our Process and Flows PowerPoint Templates because, Brilliant ideas popping up all over the place. Use our Arrows PowerPoint Templates because, explain the relevance of the different layers and stages in getting down to your core competence, ability and desired result. Use these PowerPoint slides for presentations relating to accent, advertisement, aqua, arrow, blank, business, button, collection, color, decoration, design, direction, element, empty, financial, flow, graph, green, grey, horizontal, instruction, isolated, placard, process, promo, promotion, sale, set, shape, shiny, silver, steps, symbol. The prominent colors used in the PowerPoint template are Yellow, Gray, and White Feature your views with our Ppt Horizontal Flow Of 6 Stage Diagram Marketing Presentation PowerPoint 2 Graphic. They will get the desired exposure.
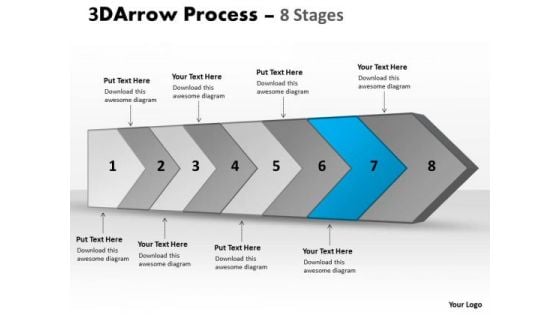
Ppt Template Continous Custom Sample Presentation PowerPoint Download Flow Diagram 8 Image
We present our PPT template continuous custom sample presentation PowerPoint download flow diagram 8 Image. Use our Success PowerPoint Templates because, Targets: - You have a handle on all the targets, a master of the game, the experienced and consummate juggler. Use our Arrows PowerPoint Templates because, are the stepping stones of our journey till date. Use our Business PowerPoint Templates because; Show them how to churn out fresh ideas. Use our Shapes PowerPoint Templates because, Harness these opportunities, celebrate your performance till date and focus on greater growth and expansion in coming years. Use our Symbol PowerPoint Templates because, you have some great folks working with you, thinking with you. Use these PowerPoint slides for presentations relating to Advertisement, Arrow, Badge, Bread, Crumbs, Business, Button, Collection, Decoration, Design, Direction, Financial, Flow, Gradient, Graph, Green, Grey, Label, Menu, Message, Nobody, Placard, Process, Push, Retail, Round, Sale, Set, Shape, Shiny, Silver, Steps, Symbol. The prominent colors used in the PowerPoint template are Blue, Gray, and White Marry great content with great graphics with our Ppt Template Continous Custom Sample Presentation PowerPoint Download Flow Diagram 8 Image. You will be at the top of your game.
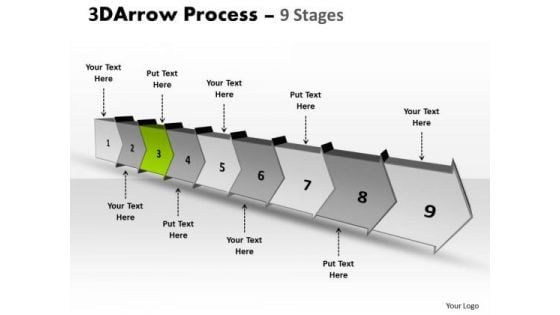
Ppt Template Continous New Business Representation Resources Flow Process Diagram 4 Design
We present our PPT template continuous new business representation resources flow process diagram 4 design. Use our Success PowerPoint Templates because, The Venn graphic comprising interlinking circles geometrically demonstrate how various functions operating independently, to a large extent, are essentially interdependent. Use our Arrows PowerPoint Templates because, Timelines Template:- Getting it done may not be enough. Use our Business PowerPoint Templates because, Ideas roll along in your mind like billiard balls. Use our Shapes PowerPoint Templates because; Use our creative template to lay down your views. Use our Symbol PowerPoint Templates because; Use this template to explain the value of its wellness to human life. Use these PowerPoint slides for presentations relating to Advertisement, Arrow, Badge, Bread, Crumbs, Business, Button, Collection, Decoration, Design, Direction, Financial, Flow, Gradient, Graph, Green, Grey, Label, Menu, Message, Nobody, Placard, Process, Push, Retail, Round, Sale, Set, Shape, Shiny, Silver, Steps, Symbol. The prominent colors used in the PowerPoint template are Green, Gray, and White Advertise attributes on our Ppt Template Continous New Business Representation Resources Flow Process Diagram 4 Design. Your campaign for your brand will get a boost.
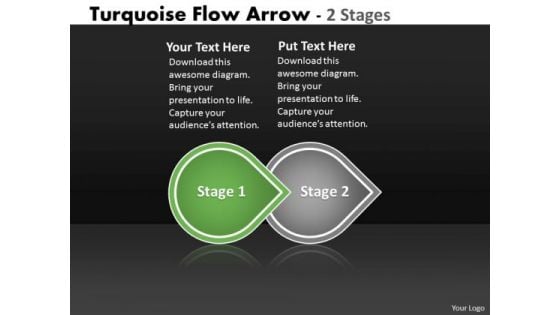
Ppt Beeline Two Stages Arrow Diagram Comment Faire Une Presentation PowerPoint 2 Design
We present our PPT beeline two stages arrow diagram comment faire one presentation PowerPoint 2 design. Use our Business PowerPoint Templates because; enlighten them with your brilliant understanding of mental health. Use our Design PowerPoint Templates because, various threads are joining up and being stitched together providing necessary strength Now you have to take the last leap. Use our Arrows PowerPoint Templates because, The Venn graphic comprising interlinking circles geometrically demon state how various functions operating independently, to a large extent, are essentially interdependent. Use our Shapes PowerPoint Templates because; heighten the anticipation of your audience with this slide listing. Use our Process and Flows PowerPoint Templates because; See the smiles of happiness spread as they realize the value of your words. Use these PowerPoint slides for presentations relating to advertising, arrow, background, banner, bookmark, choice, concept, creative, design, direction, flow, label, layout, manual, marketing, modern, process, product, promotion, sequence, simple, special, step, symbol, tab, tag, turquoise, tutorial, two, vector, . The prominent colors used in the PowerPoint template are Green, Gray, and White Affect a country with our Ppt Beeline Two Stages Arrow Diagram Comment Faire Une Presentation PowerPoint 2 Design. Just download, type and present.
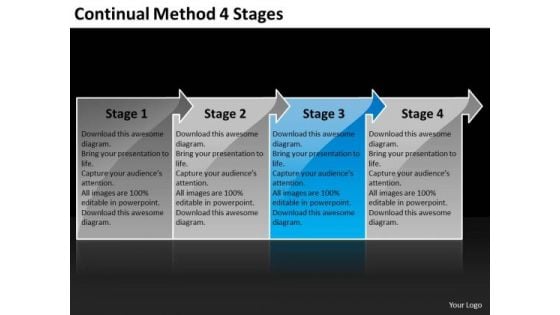
Continual Method 4 Stages Ppt Diagram Of Business Plan PowerPoint Templates
We present our continual method 4 stages ppt diagram of business plan PowerPoint templates. Use our Marketing PowerPoint Templates because, The Venn graphic comprising interlinking circles geometrically demonstrate how various functions operating independently, to a large extent, are essentially interdependent. Use our Arrows PowerPoint Templates because, Be the cynosure of all eyes with our template depicting. Use our Business PowerPoint Templates because, Profit fairly earned is what you believe in. Use our Process and Flows PowerPoint Templates because; illustrate your plans on using the many social media modes available to inform society at large of the benefits of your product. Use our Leadership PowerPoint Templates because, If making a mark is your obsession,. Use these PowerPoint slides for presentations relating to Advertising, arrow, background, banner, bookmark, card, choice, concept, creative, design, direction, flow, idea, illustration, info graphic, instruction, label, layout, marketing, modern, next, options, process, product, promotion, sequence, simple, step, symbol, template, triangle. The prominent colors used in the PowerPoint template are Blue, Black, and Gray Arouse the excitement with our Continual Method 4 Stages Ppt Diagram Of Business Plan PowerPoint Templates. Stir up the audience with your views.
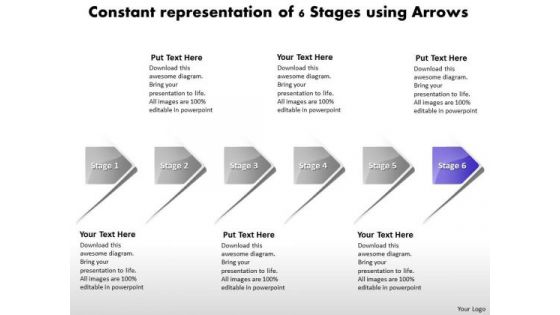
Constant Representation Of 6 Stages Using Arrows Manufacturing Process Diagram PowerPoint Templates
We present our constant representation of 6 stages using arrows manufacturing process diagram PowerPoint templates.Use our Arrows PowerPoint Templates because, Business ethics is an essential element in your growth. Use our Marketing PowerPoint Templates because,They help to focus the thoughts of your listeners. Use our Success PowerPoint Templates because, The success of your venture depends on the performance of every team member. Use our Design PowerPoint Templates because,The structure of our templates allows you to effectively highlight the key issues concerning the growth of your business. Use our Process and Flows PowerPoint Templates because,They are Designed to attract the attention of your audience.Use these PowerPoint slides for presentations relating to 3d, Abstract, Around, Arrows, Blue, Border, Business, Center, Circle, Circular, Concept, Connections, Copy, Curve, Cycle, Directions, Distribution, Illustration, Management, Middle, Objects, Pieces, Plan, Pointing, Process, Recycle, Rounded, Shadows, Space, System. The prominent colors used in the PowerPoint template are Purple, Gray, White Attract attention with our Constant Representation Of 6 Stages Using Arrows Manufacturing Process Diagram PowerPoint Templates. You will come out on top.
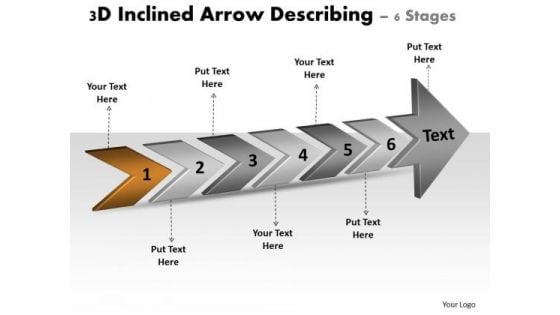
3d Inclined Arrow Describing 6 Stages Diagram Of Business Plan PowerPoint Templates
We present our 3d inclined arrow describing 6 stages diagram of business plan PowerPoint templates.Use our Finance PowerPoint Templates because,You envisage some areas of difficulty in the near future. The overall financial situation could be a source of worry. Use our Process and Flows PowerPoint Templates because, It helps you to satiate the brains of your team with a taste of the final product. Use our Arrows PowerPoint Templates because,You have a clear vision of the cake you want. Use our Shapes PowerPoint Templates because, You have the plans ready for them to absorb and understand. Use our Business PowerPoint Templates because, Spell out your advertising plans to increase market share. The feedback has been positive and productiveUse these PowerPoint slides for presentations relating to Advertising, arrow, background, banner, bookmark, card, choice, concept, creative, design, direction, flow, idea, illustration, infographic, instruction, label, layout, manual, marketing, modern, next, number, offer, options, order, paper, process, product, promotion, sequence, simple, step, symbol, template, triangle, tutorial, vector, version, web. The prominent colors used in the PowerPoint template are Brown, Gray, Black Play your cards well with our 3d Inclined Arrow Describing 6 Stages Diagram Of Business Plan PowerPoint Templates. Give your thoughts a good deal.
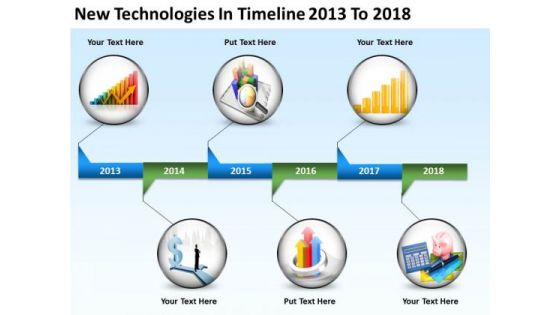
Business Life Cycle Diagram Timeline 2013 To 2018 PowerPoint Templates Ppt Backgrounds For Slides
We present our business life cycle diagram timeline 2013 to 2018 PowerPoint templates PPT backgrounds for slides.Download and present our Arrows PowerPoint Templates because It can Bubble and burst with your ideas. Use our Technology PowerPoint Templates because It will mark the footprints of your journey. Illustrate how they will lead you to your desired destination. Use our Targets PowerPoint Templates because Our PowerPoint Templates and Slides will steer your racing mind. Hit the right buttons and spur on your audience. Use our Finance PowerPoint Templates because You will get more than you ever bargained for. Download and present our Shapes PowerPoint Templates because Our PowerPoint Templates and Slides will Embellish your thoughts. They will help you illustrate the brilliance of your ideas.Use these PowerPoint slides for presentations relating to Abstract, Advertising, Arrow, Background, Billboard, Bio, Border, Bright, Bulb, Business, Circular, Color, Colorful, Concept, Corporate, Creative, Design, Direction, Eco, Electricity, Energy, Fresh, Green, Idea, Illumination, Illustration, Image, Innovation, Inspiration, Internet, Lamp, Light, Mark, Modern, Organic, Power, Process, Progress, Shadow, Sign, Symbol, Teamwork, Technology, Template, Text, Texture, Vector, Watt, Way, Wire. The prominent colors used in the PowerPoint template are Red, Yellow, Blue. Our Business Life Cycle Diagram Timeline 2013 To 2018 PowerPoint Templates Ppt Backgrounds For Slides amplify your erudition. You will be earmarked for your brilliance.

Diagram 5 Stages Ppt What Is An Executive In Business Plan PowerPoint Templates
We present our diagram 5 stages ppt what is an executive in business plan PowerPoint templates.Download our Arrows PowerPoint Templates because It can Bubble and burst with your ideas. Download our Shapes PowerPoint Templates because Our PowerPoint Templates and Slides will provide weight to your words. They will bring out the depth of your thought process. Download our Signs PowerPoint Templates because Our PowerPoint Templates and Slides are effectively colour coded to prioritise your plans They automatically highlight the sequence of events you desire. Use our Process and Flows PowerPoint Templates because Our PowerPoint Templates and Slides are effectively colour coded to prioritise your plans They automatically highlight the sequence of events you desire. Download and present our Business PowerPoint Templates because Our PowerPoint Templates and Slides ensures Effective communication. They help you put across your views with precision and clarity.Use these PowerPoint slides for presentations relating to tab, number, step, label, background, layout, order, arrow, vector, design, product, website, sequence, page, manual, offer, special, tutorial, flow, tag, concept, symbol, template, card, vertical, pointer, one, simple, modern, creative, illustration, options, instruction, web, direction, blue, paper, choice, infographic, banner, version, progress, advertising, webdesign, promotion, bookmark. The prominent colors used in the PowerPoint template are Blue, Gray, Black. Extract the essence with our Diagram 5 Stages Ppt What Is An Executive In Business Plan PowerPoint Templates. Your thoughts will highlight the key conditions.
Vertical Process Diagram Sample Mission Statements For Business Plan PowerPoint Templates
We present our vertical process diagram sample mission statements for business plan PowerPoint templates.Download and present our Leadership PowerPoint Templates because Our PowerPoint Templates and Slides are effectively colour coded to prioritise your plans They automatically highlight the sequence of events you desire. Download and present our Advertising PowerPoint Templates because It will get your audience in sync. Download and present our Arrows PowerPoint Templates because You have the co-ordinates for your destination of success. Let our PowerPoint Templates and Slides map out your journey. Present our Business PowerPoint Templates because It will get your audience in sync. Present our Process and Flows PowerPoint Templates because It is Aesthetically crafted by artistic young minds. Our PowerPoint Templates and Slides are designed to display your dexterity.Use these PowerPoint slides for presentations relating to Process, graph, flow, steps, arrow, banner, vector, sale, button, business, design, menu, advertisement, decoration, nobody, bread-crumbs, symbol, template, element, push, vertical, shape, label, round, shiny, collection, direction, badge, empty, set, variation, elegance, placard, message, gradient, silver, financial. The prominent colors used in the PowerPoint template are Red, Black, Gray. Present like a pro with our Vertical Process Diagram Sample Mission Statements For Business Plan PowerPoint Templates. You will come out on top.
Vertical Process Sequence Diagram 5 Stages How To Develop Business Plan PowerPoint Templates
We present our vertical process sequence diagram 5 stages how to develop business plan PowerPoint templates.Download and present our Leadership PowerPoint Templates because You can Inspire your team with our PowerPoint Templates and Slides. Let the force of your ideas flow into their minds. Present our Advertising PowerPoint Templates because Our PowerPoint Templates and Slides will give good value for money. They also have respect for the value of your time. Download and present our Arrows PowerPoint Templates because Our PowerPoint Templates and Slides team portray an attitude of elegance. Personify this quality by using them regularly. Present our Business PowerPoint Templates because Our PowerPoint Templates and Slides will let you Leave a lasting impression to your audiences. They possess an inherent longstanding recall factor. Use our Process and Flows PowerPoint Templates because Our PowerPoint Templates and Slides are topically designed to provide an attractive backdrop to any subject.Use these PowerPoint slides for presentations relating to Process, graph, flow, steps, arrow, banner, vector, sale, button, business, design, menu, advertisement, decoration, nobody, bread-crumbs, symbol, template, element, push, vertical, shape, label, round, shiny, collection, direction, badge, empty, set, variation, elegance, placard, message, gradient, silver, financial. The prominent colors used in the PowerPoint template are Blue, Black, Gray. Do not doubt the effect of your plans. Positive outcomes are a fait accompli with our Vertical Process Sequence Diagram 5 Stages How To Develop Business Plan PowerPoint Templates.
Business Development Layered Diagram 3 Stages Sales Plan Outline PowerPoint Slides
We present our business development layered diagram 3 stages sales plan outline PowerPoint Slides.Download and present our Process and Flows PowerPoint Templates because Our PowerPoint Templates and Slides will fulfill your every need. Use them and effectively satisfy the desires of your audience. Download our Arrows PowerPoint Templates because Our PowerPoint Templates and Slides are focused like a searchlight beam. They highlight your ideas for your target audience. Download and present our Success PowerPoint Templates because It will Give impetus to the hopes of your colleagues. Our PowerPoint Templates and Slides will aid you in winning their trust. Download and present our Business PowerPoint Templates because Our PowerPoint Templates and Slides are the chords of your song. String them along and provide the lilt to your views. Download and present our Marketing PowerPoint Templates because Our PowerPoint Templates and Slides team portray an attitude of elegance. Personify this quality by using them regularly.Use these PowerPoint slides for presentations relating to Arrow, vector, element, web, banner, design, layout, graphic, sign, background, business, modern, three, abstract, two, one, website, isolated, decoration, white, blank, concept, success, presentation, bright, symbol, brochure, clean, marketing, striped, shape, creative, illustration, number, decorative, direction, color, trendy, growth, transparent, motion, composition, elegance, style. The prominent colors used in the PowerPoint template are Orange, Black, Gray. Capture emerging international markets with our Business Development Layered Diagram 3 Stages Sales Plan Outline PowerPoint Slides. They will make you look good.
Sample Business Model Diagram Of Vertical Arrows Developing Strategy Ppt PowerPoint Slides
We present our sample business model diagram of vertical arrows developing strategy ppt PowerPoint Slides.Present our Finance PowerPoint Templates because Our PowerPoint Templates and Slides will effectively help you save your valuable time. They are readymade to fit into any presentation structure. Download our Arrows PowerPoint Templates because Our PowerPoint Templates and Slides are innately eco-friendly. Their high recall value negate the need for paper handouts. Download and present our Sales PowerPoint Templates because Our PowerPoint Templates and Slides offer you the widest possible range of options. Download our Process and Flows PowerPoint Templates because Our PowerPoint Templates and Slides provide you with a vast range of viable options. Select the appropriate ones and just fill in your text. Use our Business PowerPoint Templates because Our PowerPoint Templates and Slides ensures Effective communication. They help you put across your views with precision and clarity.Use these PowerPoint slides for presentations relating to Process, Graph, Flow, Steps, Arrow, Banner, Vector, Sale, Button, Business, Design, Menu, Advertisement, Isolated, Decoration, Nobody, Bread-Crumbs, Green, Retail, Blank, Yellow, Symbol, Template, Orange, Element, Push, Vertical, Shape, Label, Grey, Illustration, Shiny, Collection, Direction, Badge, Empty, Set, Variation, Elegance, Placard, Message, Gradient, Silver, Financial. The prominent colors used in the PowerPoint template are Blue, Gray, White. Our Sample Business Model Diagram Of Vertical Arrows Developing Strategy Ppt PowerPoint Slides will soon be your favourites. They will delight you with their charm.
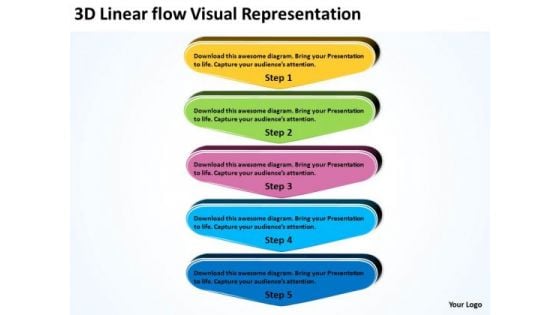
3d Linear Flow Visual Representation Business Tech Support PowerPoint Slides
We present our 3d linear flow visual representation business tech support PowerPoint Slides.Use our Arrows PowerPoint Templates because this diagram helps you to develop your marketing strategy and communicate your enthusiasm and motivation to raise the bar. Download and present our Business PowerPoint Templates because your fledgling career is in the chrysallis stage. Nurture it and watch it grow into a beautiful butterfly. Download our Shapes PowerPoint Templates because they will Amplify your plans to have dedicated sub groups working on related but distinct tasks. Download our Leadership PowerPoint Templates because this diagram can be used to illustrate the logical path or system. Download our Marketing PowerPoint Templates because you can outline your targets to your team.Use these PowerPoint slides for presentations relating to Abstract, Arrow, Arrows, Business, Chart, Design, Development, Diagram, Direction, Element, Flow, Flowchart, Graph, Linear, Management, Model, Motion, Organization, Plan, Process, Program, Section, Segment, Set, Sign, Solution, Strategy, Symbol, Technology. The prominent colors used in the PowerPoint template are Yellow, Green, Pink. Customers tell us our 3d linear flow visual representation business tech support PowerPoint Slides will impress their bosses and teams. The feedback we get is that our Diagram PowerPoint templates and PPT Slides are Romantic. Professionals tell us our 3d linear flow visual representation business tech support PowerPoint Slides are Clever. People tell us our Chart PowerPoint templates and PPT Slides are the best it can get when it comes to presenting. Customers tell us our 3d linear flow visual representation business tech support PowerPoint Slides are Endearing. Professionals tell us our Business PowerPoint templates and PPT Slides are Clever. Test boundaries of presenting with our 3d Linear Flow Visual Representation Business Tech Support PowerPoint Slides. Download without worries with our money back guaranteee.
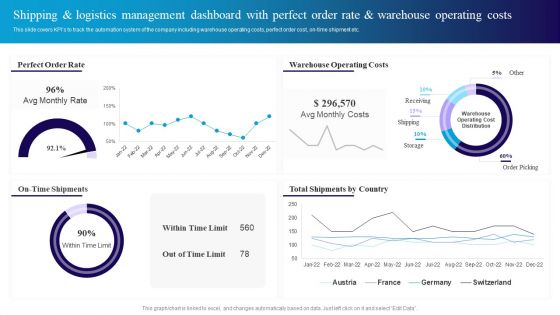
Shipping And Logistics Management Dashboard With Perfect Order Rate And Warehouse Sample PDF
This slide covers KPIs to track the automation system of the company including warehouse operating costs, perfect order cost, ontime shipment etc. This Shipping And Logistics Management Dashboard With Perfect Order Rate And Warehouse Sample PDF from Slidegeeks makes it easy to present information on your topic with precision. It provides customization options, so you can make changes to the colors, design, graphics, or any other component to create a unique layout. It is also available for immediate download, so you can begin using it right away. Slidegeeks has done good research to ensure that you have everything you need to make your presentation stand out. Make a name out there for a brilliant performance.
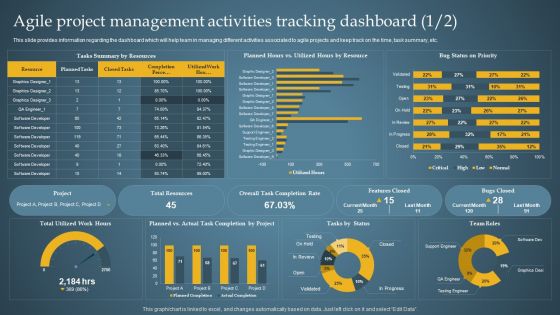
Agile Project Management Activities Product Administration Through Agile Playbook Infographics PDF
This slide provides information regarding the dashboard which will help team in managing different activities associated to agile projects and keep track on the time, task summary, etc. Do you have an important presentation coming up Are you looking for something that will make your presentation stand out from the rest Look no further than Agile Project Management Activities Product Administration Through Agile Playbook Infographics PDF. With our professional designs, you can trust that your presentation will pop and make delivering it a smooth process. And with Slidegeeks, you can trust that your presentation will be unique and memorable. So why wait Grab Agile Project Management Activities Product Administration Through Agile Playbook Infographics PDF today and make your presentation stand out from the rest
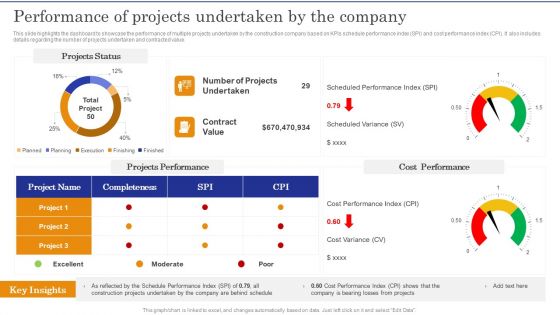
Construction Site Safety Measure Performance Of Projects Undertaken By The Company Slides PDF
This slide highlights the dashboard to showcase the performance of multiple projects undertaken by the construction company based on KPIs schedule performance index SPI and cost performance index CPI. It also includes details regarding the number of projects undertaken and contracted value.Take your projects to the next level with our ultimate collection of Construction Site Safety Measure Performance Of Projects Undertaken By The Company Slides PDF. Slidegeeks has designed a range of layouts that are perfect for representing task or activity duration, keeping track of all your deadlines at a glance. Tailor these designs to your exact needs and give them a truly corporate look with your own brand colors they all make your projects stand out from the rest.
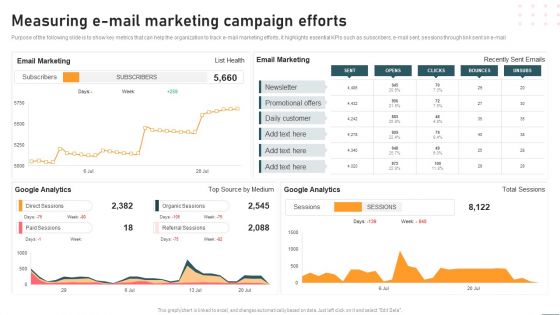
Measuring E Mail Marketing Campaign Efforts Structure PDF
Purpose of the following slide is to show key metrics that can help the organization to track e-mail marketing efforts, it highlights essential KPIs such as subscribers, e-mail sent, sessions through link sent on e mail. Slidegeeks is here to make your presentations a breeze with Measuring E Mail Marketing Campaign Efforts Structure PDF With our easy to use and customizable templates, you can focus on delivering your ideas rather than worrying about formatting. With a variety of designs to choose from, you are sure to find one that suits your needs. And with animations and unique photos, illustrations, and fonts, you can make your presentation pop. So whether you are giving a sales pitch or presenting to the board, make sure to check out Slidegeeks first.
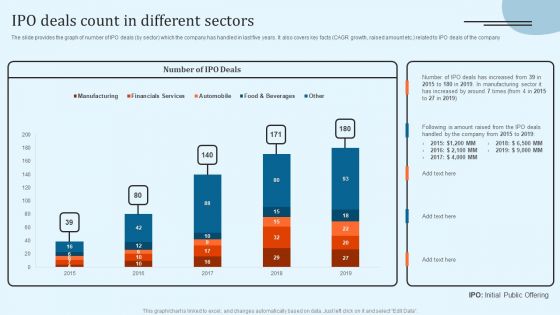
Equity Debt And Convertible Bond Investment Banking Pitch Book IPO Deals Count In Different Sectors Formats PDF
The slide provides the graph of number of IPO deals by sector which the company has handled in last five years. It also covers key facts CAGR growth, raised amount etc. related to IPO deals of the company. Take your projects to the next level with our ultimate collection of Equity Debt And Convertible Bond Investment Banking Pitch Book IPO Deals Count In Different Sectors Formats PDF. Slidegeeks has designed a range of layouts that are perfect for representing task or activity duration, keeping track of all your deadlines at a glance. Tailor these designs to your exact needs and give them a truly corporate look with your own brand colors they will make your projects stand out from the rest.
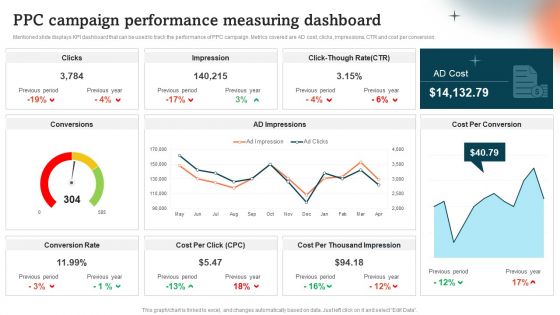
Ppc Campaign Performance Measuring Dashboard Guide To Personal Branding Pictures PDF
Mentioned slide displays KPI dashboard that can be used to track the performance of PPC campaign. Metrics covered are AD cost, clicks, impressions, CTR and cost per conversion.Presenting this PowerPoint presentation, titled Ppc Campaign Performance Measuring Dashboard Guide To Personal Branding Pictures PDF, with topics curated by our researchers after extensive research. This editable presentation is available for immediate download and provides attractive features when used. Download now and captivate your audience. Presenting this Ppc Campaign Performance Measuring Dashboard Guide To Personal Branding Pictures PDF. Our researchers have carefully researched and created these slides with all aspects taken into consideration. This is a completely customizable Ppc Campaign Performance Measuring Dashboard Guide To Personal Branding Pictures PDF that is available for immediate downloading. Download now and make an impact on your audience. Highlight the attractive features available with our PPTs.
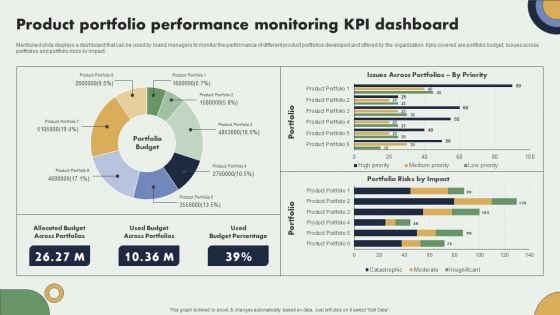
Product Portfolio Performance Monitoring Kpi Dashboard Brand Expansion Plan Slides PDF
Mentioned slide displays a dashboard that can be used by brand managers to monitor the performance of different product portfolios developed and offered by the organization. Kpis covered are portfolio budget, issues across portfolios and portfolio risks by impact.Take your projects to the next level with our ultimate collection of Product Portfolio Performance Monitoring Kpi Dashboard Brand Expansion Plan Slides PDF. Slidegeeks has designed a range of layouts that are perfect for representing task or activity duration, keeping track of all your deadlines at a glance. Tailor these designs to your exact needs and give them a truly corporate look with your own brand colors they all make your projects stand out from the rest.
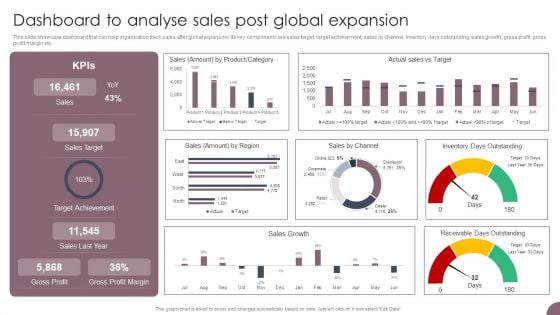
International Business Extension Dashboard To Analyse Sales Post Global Expansion Guidelines PDF
This slide showcase dashboard that can help organization track sales after global expansion. Its key components are sales target, target achievement, sales by channel, inventory days outstanding, sales growth, gross profit, gross profit margin etc. Are you in need of a template that can accommodate all of your creative concepts This one is crafted professionally and can be altered to fit any style. Use it with Google Slides or PowerPoint. Include striking photographs, symbols, depictions, and other visuals. Fill, move around, or remove text boxes as desired. Test out color palettes and font mixtures. Edit and save your work, or work with colleagues. Download International Business Extension Dashboard To Analyse Sales Post Global Expansion Guidelines PDF and observe how to make your presentation outstanding. Give an impeccable presentation to your group and make your presentation unforgettable.
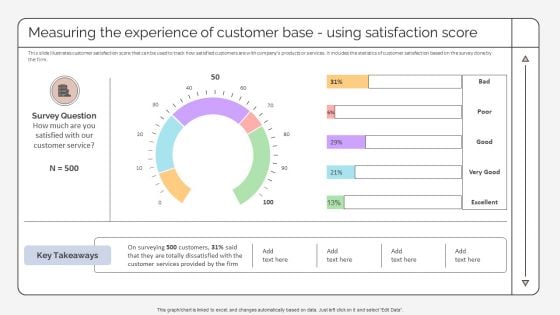
Measuring The Experience Of Customer Base Using Satisfaction Score Strategic Promotion Plan Rules PDF
This slide illustrates customer satisfaction score that can be used to track how satisfied customers are with companys products or services. It includes the statistics of customer satisfaction based on the survey done by the firm. Presenting this PowerPoint presentation, titled Measuring The Experience Of Customer Base Using Satisfaction Score Strategic Promotion Plan Rules PDF, with topics curated by our researchers after extensive research. This editable presentation is available for immediate download and provides attractive features when used. Download now and captivate your audience. Presenting this Measuring The Experience Of Customer Base Using Satisfaction Score Strategic Promotion Plan Rules PDF. Our researchers have carefully researched and created these slides with all aspects taken into consideration. This is a completely customizable Measuring The Experience Of Customer Base Using Satisfaction Score Strategic Promotion Plan Rules PDF that is available for immediate downloading. Download now and make an impact on your audience. Highlight the attractive features available with our PPTs.
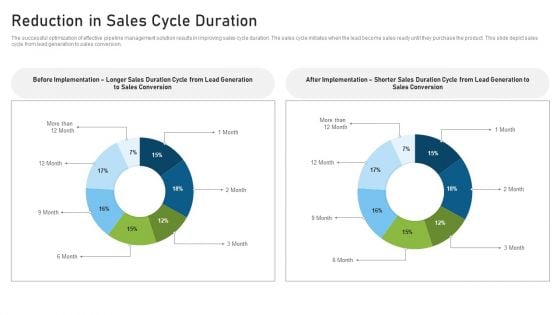
CRM Pipeline Administration Reduction In Sales Cycle Duration Formats PDF
The successful optimization of effective pipeline management solution results in improving sales cycle duration. The sales cycle initiates when the lead become sales ready until they purchase the product. This slide depict sales cycle from lead generation to sales conversion. Take your projects to the next level with our ultimate collection of CRM Pipeline Administration Reduction In Sales Cycle Duration Formats PDF. Slidegeeks has designed a range of layouts that are perfect for representing task or activity duration, keeping track of all your deadlines at a glance. Tailor these designs to your exact needs and give them a truly corporate look with your own brand colors theyll make your projects stand out from the rest.
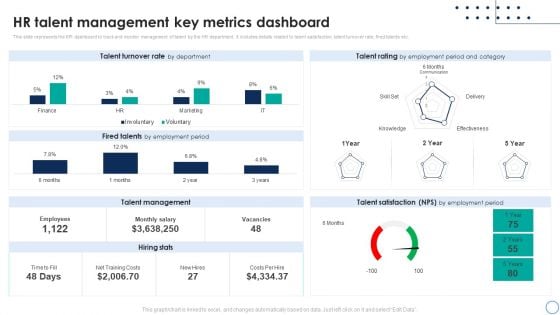
Business Analytics Application HR Talent Management Key Metrics Dashboard Rules PDF
This slide represents the KPI dashboard to track and monitor management of talent by the HR department. It includes details related to talent satisfaction, talent turnover rate, fired talents etc. This Business Analytics Application HR Talent Management Key Metrics Dashboard Rules PDF is perfect for any presentation, be it in front of clients or colleagues. It is a versatile and stylish solution for organizing your meetings. The Business Analytics Application HR Talent Management Key Metrics Dashboard Rules PDF features a modern design for your presentation meetings. The adjustable and customizable slides provide unlimited possibilities for acing up your presentation. Slidegeeks has done all the homework before launching the product for you. So, dont wait, grab the presentation templates today.
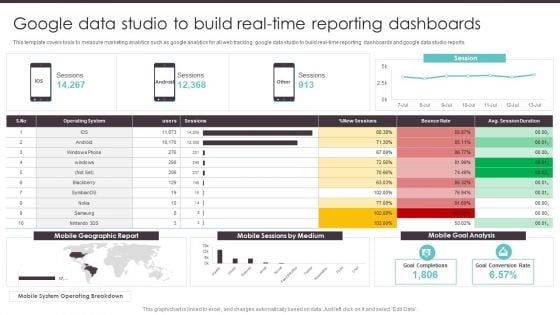
Business To Business Digital Google Data Studio To Build Real Time Reporting Summary PDF
This template covers tools to measure marketing analytics such as google analytics for all web tracking, google data studio to build real-time reporting dashboards and google data studio reports. Find highly impressive Business To Business Digital Google Data Studio To Build Real Time Reporting Summary PDF on Slidegeeks to deliver a meaningful presentation. You can save an ample amount of time using these presentation templates. No need to worry to prepare everything from scratch because Slidegeeks experts have already done a huge research and work for you. You need to download Business To Business Digital Google Data Studio To Build Real Time Reporting Summary PDF for your upcoming presentation. All the presentation templates are 100 percent editable and you can change the color and personalize the content accordingly. Download now.
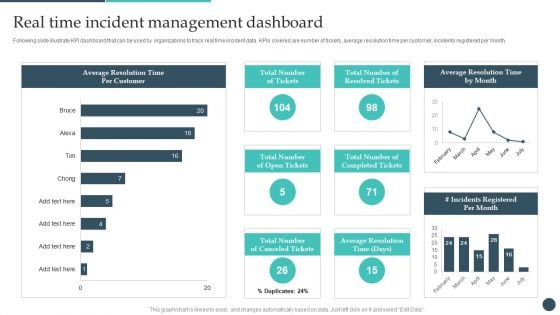
Safety Breach Response Playbook Real Time Incident Management Dashboard Formats PDF
Following slide illustrate KPI dashboard that can be used by organizations to track real time incident data. KPIs covered are number of tickets, average resolution time per customer, incidents registered per month. Find highly impressive Safety Breach Response Playbook Real Time Incident Management Dashboard Formats PDF on Slidegeeks to deliver a meaningful presentation. You can save an ample amount of time using these presentation templates. No need to worry to prepare everything from scratch because Slidegeeks experts have already done a huge research and work for you. You need to download Safety Breach Response Playbook Real Time Incident Management Dashboard Formats PDF for your upcoming presentation. All the presentation templates are 100 percent editable and you can change the color and personalize the content accordingly. Download now.
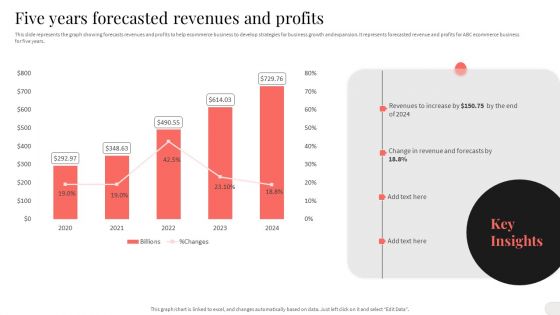
Analyzing And Implementing Effective CMS Five Years Forecasted Revenues And Profits Mockup PDF
This slide represents the graph showing forecasts revenues and profits to help ecommerce business to develop strategies for business growth and expansion. It represents forecasted revenue and profits for ABC ecommerce business for five years. Take your projects to the next level with our ultimate collection of Analyzing And Implementing Effective CMS Five Years Forecasted Revenues And Profits Mockup PDF. Slidegeeks has designed a range of layouts that are perfect for representing task or activity duration, keeping track of all your deadlines at a glance. Tailor these designs to your exact needs and give them a truly corporate look with your own brand colors they will make your projects stand out from the rest.

Organizing Security Awareness KPI Dashboard To Monitor Cyber Security Performance Ideas PDF
The purpose of this slide is to highlight key performance indicator KPI dashboard which can be used to track the performance of organization cyber security. The KPI metrics covered in the slide are asset type control, control issues by standard and regulation etc. This modern and well-arranged Organizing Security Awareness KPI Dashboard To Monitor Cyber Security Performance Ideas PDF provides lots of creative possibilities. It is very simple to customize and edit with the Powerpoint Software. Just drag and drop your pictures into the shapes. All facets of this template can be edited with Powerpoint, no extra software is necessary. Add your own material, put your images in the places assigned for them, adjust the colors, and then you can show your slides to the world, with an animated slide included.
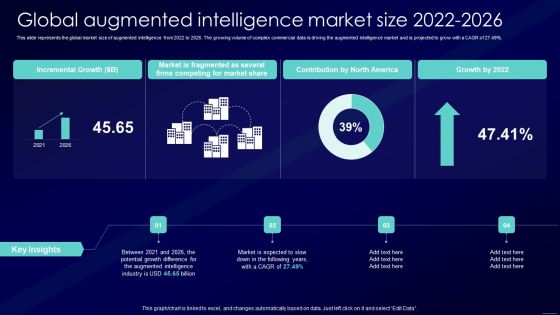
Augmented Intelligence Tools And Applications IT Global Augmented Intelligence Market Size 2022 2026 Summary PDF
This slide represents the global market size of augmented intelligence from 2022 to 2026. The growing volume of complex commercial data is driving the augmented intelligence market and is projected to grow with a CAGR of 27.49 percent. Take your projects to the next level with our ultimate collection of Augmented Intelligence Tools And Applications IT Global Augmented Intelligence Market Size 2022 2026 Summary PDF. Slidegeeks has designed a range of layouts that are perfect for representing task or activity duration, keeping track of all your deadlines at a glance. Tailor these designs to your exact needs and give them a truly corporate look with your own brand colors they will make your projects stand out from the rest.
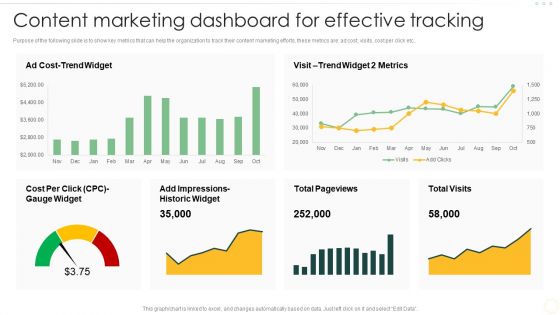
Effective Organizational B2B And B2C Content Marketing Dashboard For Effective Demonstration PDF
Purpose of the following slide is to show key metrics that can help the organization to track their content marketing efforts, these metrics are ad cost, visits, cost per click etc. This modern and well-arranged Effective Organizational B2B And B2C Content Marketing Dashboard For Effective Demonstration PDF provides lots of creative possibilities. It is very simple to customize and edit with the Powerpoint Software. Just drag and drop your pictures into the shapes. All facets of this template can be edited with Powerpoint, no extra software is necessary. Add your own material, put your images in the places assigned for them, adjust the colors, and then you can show your slides to the world, with an animated slide included.
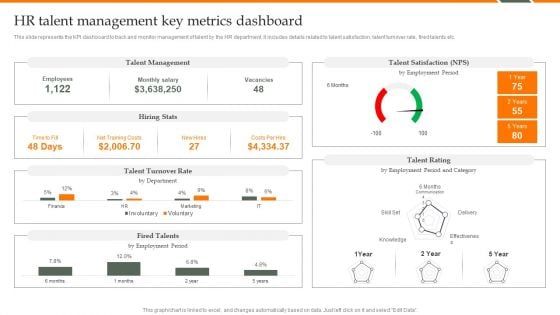
Human Resource Analytics HR Talent Management Key Metrics Dashboard Brochure PDF
This slide represents the KPI dashboard to track and monitor management of talent by the HR department. It includes details related to talent satisfaction, talent turnover rate, fired talents etc. Coming up with a presentation necessitates that the majority of the effort goes into the content and the message you intend to convey. The visuals of a PowerPoint presentation can only be effective if it supplements and supports the story that is being told. Keeping this in mind our experts created Human Resource Analytics HR Talent Management Key Metrics Dashboard Brochure PDF to reduce the time that goes into designing the presentation. This way, you can concentrate on the message while our designers take care of providing you with the right template for the situation.
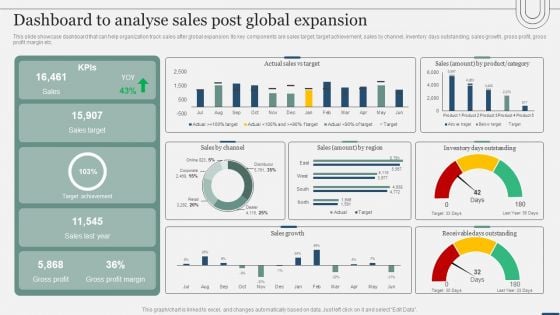
Assessing International Market Dashboard To Analyse Sales Post Global Expansion Elements PDF
This slide showcase dashboard that can help organization track sales after global expansion. Its key components are sales target, target achievement, sales by channel, inventory days outstanding, sales growth, gross profit, gross profit margin etc. Are you in need of a template that can accommodate all of your creative concepts This one is crafted professionally and can be altered to fit any style. Use it with Google Slides or PowerPoint. Include striking photographs, symbols, depictions, and other visuals. Fill, move around, or remove text boxes as desired. Test out color palettes and font mixtures. Edit and save your work, or work with colleagues. Download Assessing International Market Dashboard To Analyse Sales Post Global Expansion Elements PDF and observe how to make your presentation outstanding. Give an impeccable presentation to your group and make your presentation unforgettable.
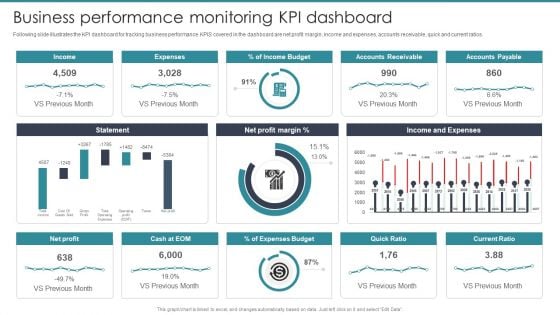
Guide To Mergers And Acquisitions Business Performance Monitoring KPI Dashboard Designs PDF
Following slide illustrates the KPI dashboard for tracking business performance. KPIS covered in the dashboard are net profit margin, income and expenses, accounts receivable, quick and current ratios. Here you can discover an assortment of the finest PowerPoint and Google Slides templates. With these templates, you can create presentations for a variety of purposes while simultaneously providing your audience with an eye catching visual experience. Download Guide To Mergers And Acquisitions Business Performance Monitoring KPI Dashboard Designs PDF to deliver an impeccable presentation. These templates will make your job of preparing presentations much quicker, yet still, maintain a high level of quality. Slidegeeks has experienced researchers who prepare these templates and write high quality content for you. Later on, you can personalize the content by editing the Guide To Mergers And Acquisitions Business Performance Monitoring KPI Dashboard Designs PDF.
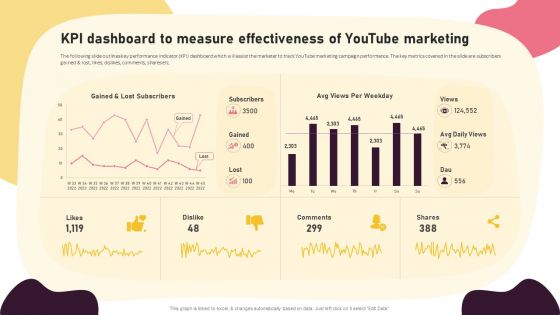
Video Promotion Techniques KPI Dashboard To Measure Effectiveness Of Youtube Pictures PDF
The following slide outlines key performance indicator KPI dashboard which will assist the marketer to track YouTube marketing campaign performance. The key metrics covered in the slide are subscribers gained and lost, likes, dislikes, comments, shares etc. Explore a selection of the finest Video Promotion Techniques KPI Dashboard To Measure Effectiveness Of Youtube Pictures PDF here. With a plethora of professionally designed and pre-made slide templates, you can quickly and easily find the right one for your upcoming presentation. You can use our Video Promotion Techniques KPI Dashboard To Measure Effectiveness Of Youtube Pictures PDF to effectively convey your message to a wider audience. Slidegeeks has done a lot of research before preparing these presentation templates. The content can be personalized and the slides are highly editable. Grab templates today from Slidegeeks.
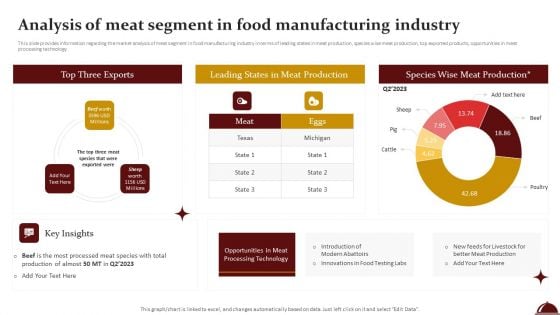
Food Processing Industry Latest Insights Trends And Analytics Analysis Of Meat Segment In Food Manufacturing Industry Inspiration PDF
This slide provides information regarding the market analysis of meat segment in food manufacturing industry in terms of leading states in meat production, species wise meat production, top exported products, opportunities in meat processing technology. Take your projects to the next level with our ultimate collection of Food Processing Industry Latest Insights Trends And Analytics Analysis Of Meat Segment In Food Manufacturing Industry Inspiration PDF. Slidegeeks has designed a range of layouts that are perfect for representing task or activity duration, keeping track of all your deadlines at a glance. Tailor these designs to your exact needs and give them a truly corporate look with your own brand colors they will make your projects stand out from the rest.
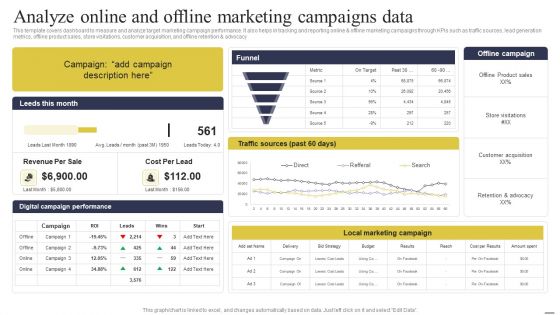
Defining Generic Target Marketing Techniques Analyze Online And Offline Marketing Campaigns Data Topics PDF
This template covers dashboard to measure and analyze target marketing campaign performance. It also helps in tracking and reporting online and offline marketing campaigns through KPIs such as traffic sources, lead generation metrics, offline product sales, store visitations, customer acquisition, and offline retention and advocacy. Create an editable Defining Generic Target Marketing Techniques Analyze Online And Offline Marketing Campaigns Data Topics PDF that communicates your idea and engages your audience. Whether you are presenting a business or an educational presentation, pre designed presentation templates help save time. Defining Generic Target Marketing Techniques Analyze Online And Offline Marketing Campaigns Data Topics PDF is highly customizable and very easy to edit, covering many different styles from creative to business presentations. Slidegeeks has creative team members who have crafted amazing templates. So, go and get them without any delay.
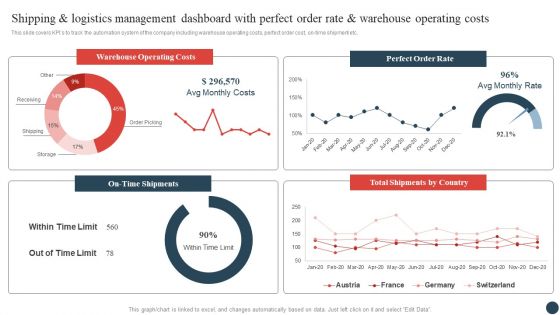
Shipping And Logistics Management Dashboard With Perfect Order Rate And Warehouse Operating Costs Topics PDF
This slide covers KPIs to track the automation system of the company including warehouse operating costs, perfect order cost, on-time shipment etc. Do you have to make sure that everyone on your team knows about any specific topic I yes, then you should give Shipping And Logistics Management Dashboard With Perfect Order Rate And Warehouse Operating Costs Topics PDF a try. Our experts have put a lot of knowledge and effort into creating this impeccable Shipping And Logistics Management Dashboard With Perfect Order Rate And Warehouse Operating Costs Topics PDF. You can use this template for your upcoming presentations, as the slides are perfect to represent even the tiniest detail. You can download these templates from the Slidegeeks website and these are easy to edit. So grab these today.
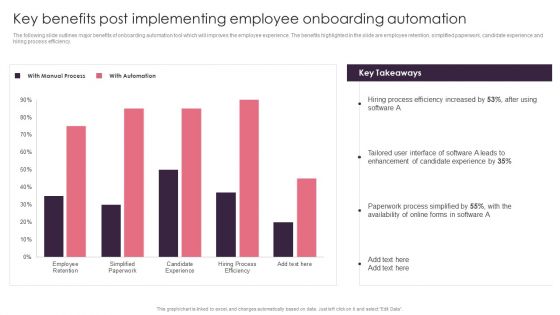
BPA Tools For Process Enhancement And Cost Minimization Key Benefits Post Implementing Employee Onboarding Automation Mockup PDF
The following slide outlines major benefits of onboarding automation tool which will improves the employee experience. The benefits highlighted in the slide are employee retention, simplified paperwork, candidate experience and hiring process efficiency. Take your projects to the next level with our ultimate collection of BPA Tools For Process Enhancement And Cost Minimization Key Benefits Post Implementing Employee Onboarding Automation Mockup PDF. Slidegeeks has designed a range of layouts that are perfect for representing task or activity duration, keeping track of all your deadlines at a glance. Tailor these designs to your exact needs and give them a truly corporate look with your own brand colors they will make your projects stand out from the rest.
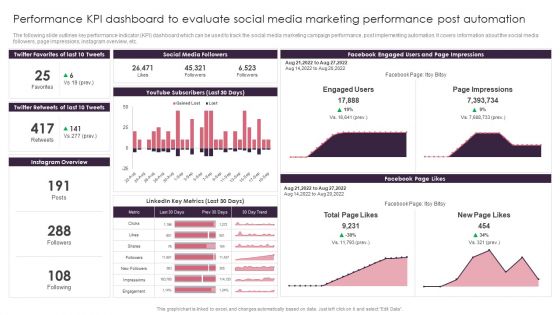
Performance KPI Dashboard To Evaluate Social Media Marketing Performance Post Automation Formats PDF
The following slide outlines key performance indicator KPI dashboard which can be used to track the social media marketing campaign performance, post implementing automation. It covers information about the social media followers, page impressions, instagram overview, etc. Slidegeeks is here to make your presentations a breeze with Performance KPI Dashboard To Evaluate Social Media Marketing Performance Post Automation Formats PDF With our easy to use and customizable templates, you can focus on delivering your ideas rather than worrying about formatting. With a variety of designs to choose from, you are sure to find one that suits your needs. And with animations and unique photos, illustrations, and fonts, you can make your presentation pop. So whether you are giving a sales pitch or presenting to the board, make sure to check out Slidegeeks first.
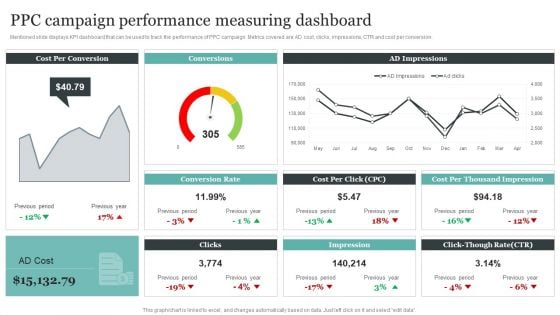
Comprehensive Personal Branding Guidelines Ppc Campaign Performance Measuring Dashboard Mockup PDF
Mentioned slide displays KPI dashboard that can be used to track the performance of PPC campaign. Metrics covered are AD cost, clicks, impressions, CTR and cost per conversion.This Comprehensive Personal Branding Guidelines Ppc Campaign Performance Measuring Dashboard Mockup PDF is perfect for any presentation, be it in front of clients or colleagues. It is a versatile and stylish solution for organizing your meetings. The Comprehensive Personal Branding Guidelines Ppc Campaign Performance Measuring Dashboard Mockup PDF features a modern design for your presentation meetings. The adjustable and customizable slides provide unlimited possibilities for acing up your presentation. Slidegeeks has done all the homework before launching the product for you. So, do not wait, grab the presentation templates today.
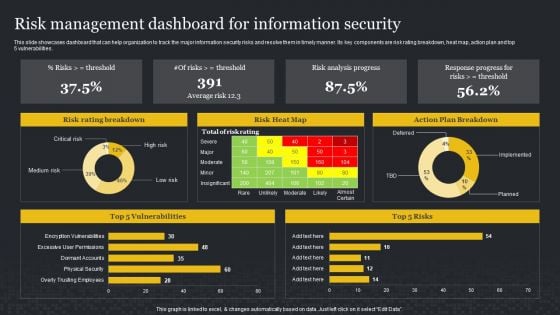
Risk Management Dashboard For Information Security Cybersecurity Risk Assessment Sample PDF
This slide showcases dashboard that can help organization to track the major information security risks and resolve them in timely manner. Its key components are risk rating breakdown, heat map, action plan and top 5 vulnerabilities. This Risk Management Dashboard For Information Security Cybersecurity Risk Assessment Sample PDF from Slidegeeks makes it easy to present information on your topic with precision. It provides customization options, so you can make changes to the colors, design, graphics, or any other component to create a unique layout. It is also available for immediate download, so you can begin using it right away. Slidegeeks has done good research to ensure that you have everything you need to make your presentation stand out. Make a name out there for a brilliant performance.
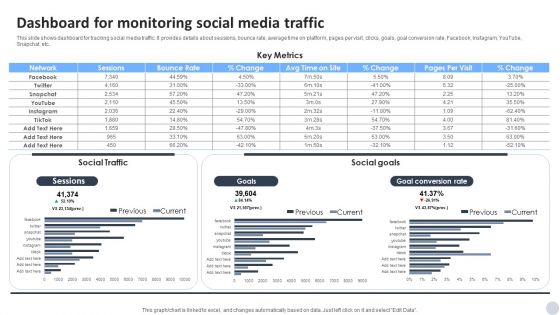
Social Media Marketing Strategies To Generate Lead Dashboard For Monitoring Social Media Traffic Guidelines PDF
This slide shows dashboard for tracking social media traffic. It provides details about sessions, bounce rate, average time on platform, pages per visit, clicks, goals, goal conversion rate, Facebook, Instagram, YouTube, Snapchat, etc. Slidegeeks is one of the best resources for PowerPoint templates. You can download easily and regulate Social Media Marketing Strategies To Generate Lead Dashboard For Monitoring Social Media Traffic Guidelines PDF for your personal presentations from our wonderful collection. A few clicks is all it takes to discover and get the most relevant and appropriate templates. Use our Templates to add a unique zing and appeal to your presentation and meetings. All the slides are easy to edit and you can use them even for advertisement purposes.
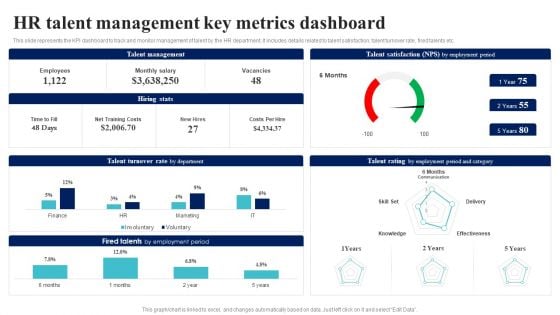
BI Implementation To Enhance Hiring Process Hr Talent Management Key Metrics Dashboard Brochure PDF
This slide represents the KPI dashboard to track and monitor management of talent by the HR department. It includes details related to talent satisfaction, talent turnover rate, fired talents etc.This BI Implementation To Enhance Hiring Process Hr Talent Management Key Metrics Dashboard Brochure PDF is perfect for any presentation, be it in front of clients or colleagues. It is a versatile and stylish solution for organizing your meetings. The BI Implementation To Enhance Hiring Process Hr Talent Management Key Metrics Dashboard Brochure PDF features a modern design for your presentation meetings. The adjustable and customizable slides provide unlimited possibilities for acing up your presentation. Slidegeeks has done all the homework before launching the product for you. So, do not wait, grab the presentation templates today.

Analyzing And Deploying Effective CMS Five Years Forecasted Revenues And Profits Demonstration PDF
This slide represents the graph showing forecasts revenues and profits to help ecommerce business to develop strategies for business growth and expansion. It represents forecasted revenue and profits for ABC ecommerce business for five years. Take your projects to the next level with our ultimate collection of Analyzing And Deploying Effective CMS Five Years Forecasted Revenues And Profits Demonstration PDF. Slidegeeks has designed a range of layouts that are perfect for representing task or activity duration, keeping track of all your deadlines at a glance. Tailor these designs to your exact needs and give them a truly corporate look with your own brand colors they will make your projects stand out from the rest.
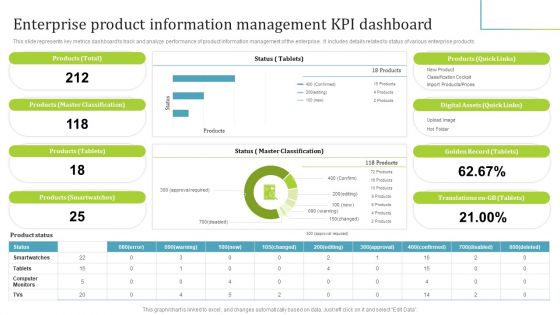
PIM Software Deployment To Enhance Conversion Rates Enterprise Product Information Management KPI Dashboard Infographics PDF
This slide represents key metrics dashboard to track and analyze performance of product information management of the enterprise. It includes details related to status of various enterprise products. Here you can discover an assortment of the finest PowerPoint and Google Slides templates. With these templates, you can create presentations for a variety of purposes while simultaneously providing your audience with an eye catching visual experience. Download PIM Software Deployment To Enhance Conversion Rates Enterprise Product Information Management KPI Dashboard Infographics PDF to deliver an impeccable presentation. These templates will make your job of preparing presentations much quicker, yet still, maintain a high level of quality. Slidegeeks has experienced researchers who prepare these templates and write high quality content for you. Later on, you can personalize the content by editing the PIM Software Deployment To Enhance Conversion Rates Enterprise Product Information Management KPI Dashboard Infographics PDF.
Elastic NLB Network Load Balancers Performance Tracker Dashboard Background PDF
This slide shows the dashboard for tracking the network load balancers performance by covering details of balancer status, balancer session, balancer throughput, etc. Coming up with a presentation necessitates that the majority of the effort goes into the content and the message you intend to convey. The visuals of a PowerPoint presentation can only be effective if it supplements and supports the story that is being told. Keeping this in mind our experts created Elastic NLB Network Load Balancers Performance Tracker Dashboard Background PDF to reduce the time that goes into designing the presentation. This way, you can concentrate on the message while our designers take care of providing you with the right template for the situation.

Integrating Logistics Automation Solution Shipping And Logistics Management Dashboard With Perfect Order Rate Ppt Infographics Files PDF
This slide covers KPIs to track the automation system of the company including warehouse operating costs, perfect order cost, on-time shipment etc. Crafting an eye-catching presentation has never been more straightforward. Let your presentation shine with this tasteful yet straightforward Integrating Logistics Automation Solution Shipping And Logistics Management Dashboard With Perfect Order Rate Ppt Infographics Files PDF template. It offers a minimalistic and classy look that is great for making a statement. The colors have been employed intelligently to add a bit of playfulness while still remaining professional. Construct the ideal Integrating Logistics Automation Solution Shipping And Logistics Management Dashboard With Perfect Order Rate Ppt Infographics Files PDF that effortlessly grabs the attention of your audience Begin now and be certain to wow your customers.
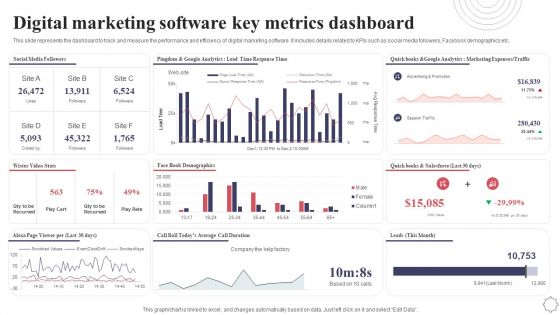
Digital Marketing Software Key Metrics Dashboard Application Deployment Project Plan Structure PDF
This slide represents the dashboard to track and measure the performance and efficiency of digital marketing software. It includes details related to KPIs such as social media followers, Facebook demographics etc. Slidegeeks is here to make your presentations a breeze with Digital Marketing Software Key Metrics Dashboard Application Deployment Project Plan Structure PDF With our easy to use and customizable templates, you can focus on delivering your ideas rather than worrying about formatting. With a variety of designs to choose from, you are sure to find one that suits your needs. And with animations and unique photos, illustrations, and fonts, you can make your presentation pop. So whether you are giving a sales pitch or presenting to the board, make sure to check out Slidegeeks first.
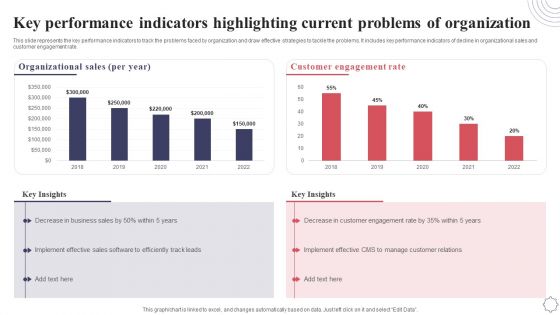
Key Performance Indicators Highlighting Current Problems Of Organization Application Deployment Project Plan Rules PDF
This slide represents the key performance indicators to track the problems faced by organization and draw effective strategies to tackle the problems. It includes key performance indicators of decline in organizational sales and customer engagement rate. Coming up with a presentation necessitates that the majority of the effort goes into the content and the message you intend to convey. The visuals of a PowerPoint presentation can only be effective if it supplements and supports the story that is being told. Keeping this in mind our experts created Key Performance Indicators Highlighting Current Problems Of Organization Application Deployment Project Plan Rules PDF to reduce the time that goes into designing the presentation. This way, you can concentrate on the message while our designers take care of providing you with the right template for the situation.
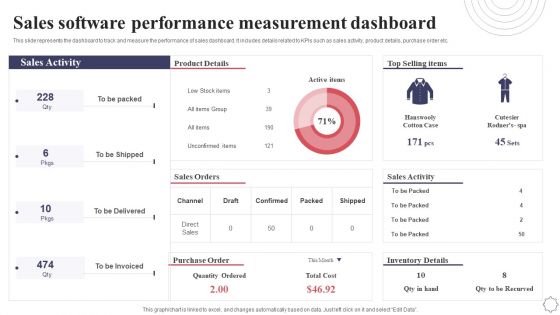
Sales Software Performance Measurement Dashboard Application Deployment Project Plan Introduction PDF
This slide represents the dashboard to track and measure the performance of sales dashboard. It includes details related to KPIs such as sales activity, product details, purchase order etc. Welcome to our selection of the Sales Software Performance Measurement Dashboard Application Deployment Project Plan Introduction PDF. These are designed to help you showcase your creativity and bring your sphere to life. Planning and Innovation are essential for any business that is just starting out. This collection contains the designs that you need for your everyday presentations. All of our PowerPoints are 100 percent editable, so you can customize them to suit your needs. This multi purpose template can be used in various situations. Grab these presentation templates today.
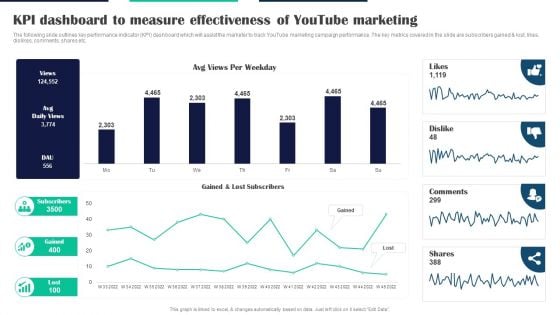
Executing Video Promotional KPI Dashboard To Measure Effectiveness Of Youtube Marketing Professional PDF
The following slide outlines key performance indicator KPI dashboard which will assist the marketer to track YouTube marketing campaign performance. The key metrics covered in the slide are subscribers gained and lost, likes, dislikes, comments, shares etc. Formulating a presentation can take up a lot of effort and time, so the content and message should always be the primary focus. The visuals of the PowerPoint can enhance the presenters message, so our Executing Video Promotional KPI Dashboard To Measure Effectiveness Of Youtube Marketing Professional PDF was created to help save time. Instead of worrying about the design, the presenter can concentrate on the message while our designers work on creating the ideal templates for whatever situation is needed. Slidegeeks has experts for everything from amazing designs to valuable content, we have put everything into Executing Video Promotional KPI Dashboard To Measure Effectiveness Of Youtube Marketing Professional PDF
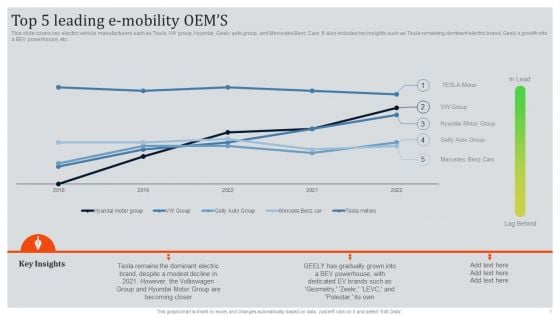
Global Automotive Industry Research And Analysis Top 5 Leading E Mobility OEMS Clipart PDF
This slide covers key electric vehicle manufacturers such as Tesla, VW group, Hyundai, Geely auto group, and Mercedes Benz Cars. It also includes key insights such as Tesla remaining dominant electric brand, Geelys growth into a BEV powerhouse, etc.Take your projects to the next level with our ultimate collection of Global Automotive Industry Research And Analysis Top 5 Leading E Mobility OEMS Clipart PDF. Slidegeeks has designed a range of layouts that are perfect for representing task or activity duration, keeping track of all your deadlines at a glance. Tailor these designs to your exact needs and give them a truly corporate look with your own brand colors they will make your projects stand out from the rest.
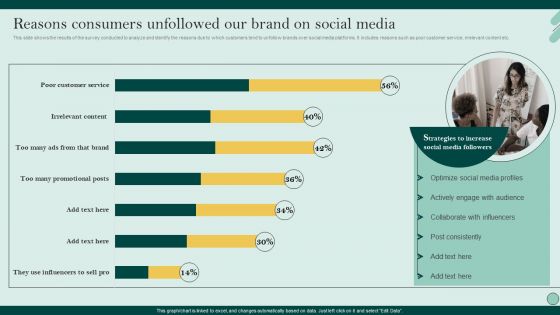
Social Networks Marketing To Improve Reasons Consumers Unfollowed Our Brand On Designs PDF
This slide shows the results of the survey conducted to analyze and identify the reasons due to which customers tend to unfollow brands over social media platforms. It includes reasons such as poor customer service, irrelevant content etc. Take your projects to the next level with our ultimate collection of Social Networks Marketing To Improve Reasons Consumers Unfollowed Our Brand On Designs PDF. Slidegeeks has designed a range of layouts that are perfect for representing task or activity duration, keeping track of all your deadlines at a glance. Tailor these designs to your exact needs and give them a truly corporate look with your own brand colors theyll make your projects stand out from the rest.
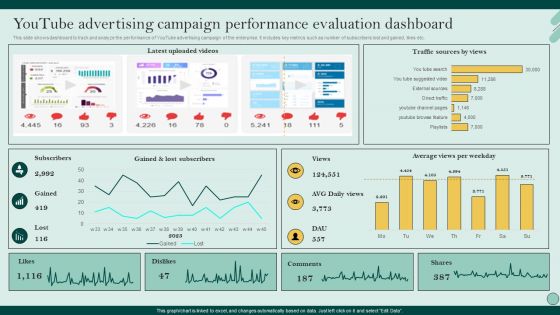
Social Networks Marketing To Improve Youtube Advertising Campaign Performance Microsoft PDF
This slide shows dashboard to track and analyze the performance of YouTube advertising campaign of the enterprise. It includes key metrics such as number of subscribers lost and gained, likes etc. Create an editable Social Networks Marketing To Improve Youtube Advertising Campaign Performance Microsoft PDF that communicates your idea and engages your audience. Whether youre presenting a business or an educational presentation, pre-designed presentation templates help save time. Social Networks Marketing To Improve Youtube Advertising Campaign Performance Microsoft PDF is highly customizable and very easy to edit, covering many different styles from creative to business presentations. Slidegeeks has creative team members who have crafted amazing templates. So, go and get them without any delay.
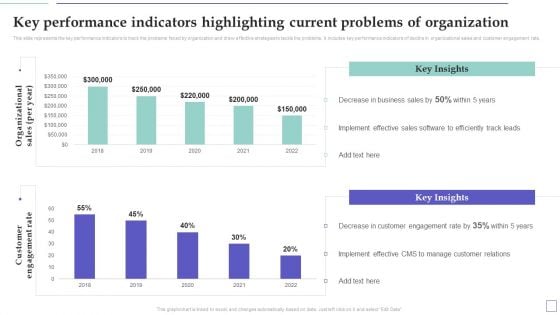
System Deployment Project Key Performance Indicators Highlighting Current Problems Information PDF
This slide represents the key performance indicators to track the problems faced by organization and draw effective strategies to tackle the problems. It includes key performance indicators of decline in organizational sales and customer engagement rate. Coming up with a presentation necessitates that the majority of the effort goes into the content and the message you intend to convey. The visuals of a PowerPoint presentation can only be effective if it supplements and supports the story that is being told. Keeping this in mind our experts created System Deployment Project Key Performance Indicators Highlighting Current Problems Information PDF to reduce the time that goes into designing the presentation. This way, you can concentrate on the message while our designers take care of providing you with the right template for the situation.


 Continue with Email

 Home
Home


