Road Icon
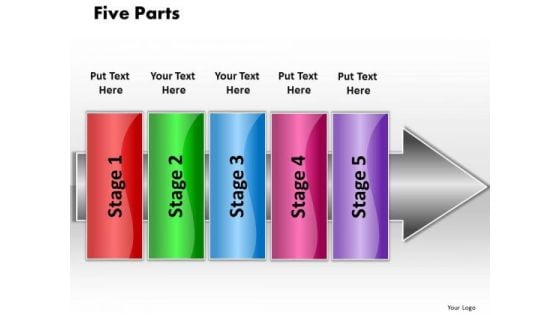
Ppt Linear Flow 5 Parts PowerPoint Templates
PPT linear flow 5 parts PowerPoint Templates-The above Diagram contains a graphic of Pointing Arrow containing stages. This image signifies the concept of different stages of a process. Adjust the above image in your PPT presentations to visually support your content in your Business, Process and Financial PPT slideshows. Add charm and personality to your presentations with this colorful PowerPoint Diagram. you can easily edit the size, position and text and change the colors as per your need.-PPT linear flow 5 parts PowerPoint Templates-Abstract, Arrow, Blank, Business, Chart, Circular, Circulation, Concepts, Conceptual, Design, Diagram, Executive, Icon, Idea, Illustration, Management, Model, Numbers, Organization, Procedure, Process, Progression, Points, Five Parts, Resource, Sequence, Sequential, Stages, Steps, Strategy Feuds can happen at the workplace. Settle them amicably with our Ppt Linear Flow 5 Parts PowerPoint Templates.
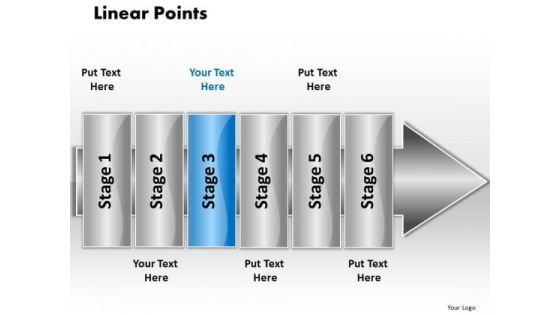
Ppt Linear Flow 6 Points PowerPoint Templates
PPT linear flow 6 points PowerPoint Templates-This continuous implementation diagram is a graphic representation of Pointing Arrow containing stages. This image signifies the concept of different stages of a process. This image has been conceived to enable you to emphatically communicate your ideas isyour Business PPT presentation. Add charm and personality to your presentations with this colorful PowerPoint Diagram. you can easily edit the size, position and text and change the colors as per your need.-PPT linear flow 6 points PowerPoint Templates-Linear Points, Abstract, Arrow, Blank, Business, Chart, Circular, Circulation, Concept, Conceptual, Design, Diagram, Executive, Icon, Idea, Illustration, Management, Model, Numbers, Organization, Procedure, Process, Progression, Resource, Sequence, Sequential, Stages, Steps, Strategy Take your thoughts for a wonderful joyride. Our Ppt Linear Flow 6 Points PowerPoint Templates will chauffeur them around.
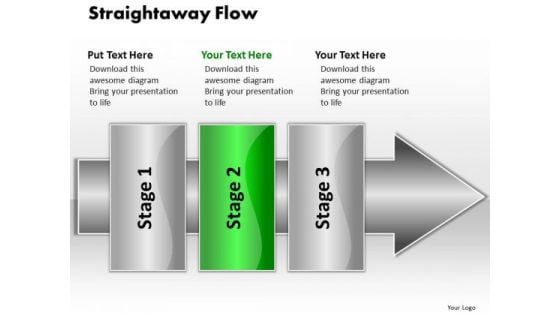
Ppt Straightaway Flow 3 Stages1 PowerPoint Templates
PPT straightaway flow 3 stages1 PowerPoint Templates-Use this Amazing PowerPoint Diagram to represent Pointing Arrow containing 3 stages .This image signifies the concept of different stages of a process. This image has been conceived to enable you to emphatically communicate your ideas in your Business PPT presentation. Add charm and personality to your presentations with this colorful PowerPoint Diagram. you can easily edit the size, position and text and change the colors as per your need.-PPT straightaway flow 3 stages1 PowerPoint Templates-Straightaway flow, Abstract, Arrow, Blank, Business, Chart, Circular, Circulation, Concepts, Conceptual, Design, Diagram, Executive, Icon, Idea, Illustration, Management, Model, Numbers, Organization, Procedure, Process, Progression, Resource, Sequence Connect the dots differently. Be daring with our Ppt Straightaway Flow 3 Stages1 PowerPoint Templates.
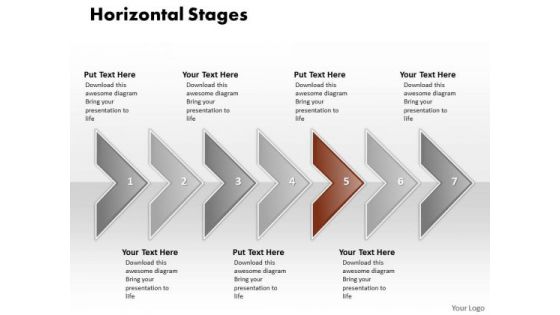
Ppt Correlated Arrows In Horizontal Create PowerPoint Macro 7 State Diagram Templates
PPT correlated arrows in horizontal create powerpoint macro 7 state diagram Templates-This Diagram is used to illustrate how information will move between interrelated systems in the accomplishment of a given function, task or process. The visual description of this information flow with each given level showing how data is fed into a given process step and subsequently passed along at the completion of that step.-PPT correlated arrows in horizontal create powerpoint macro 7 state diagram Templates-Aim, Arrow, Badge, Border, Color, Connection, Curve, Design, Direction, Download, Icon, Illustration, Indicator, Internet, Label, Link, Magenta, Mark, Next, Object, Orientation, Paper, Peeling, Pointer, Rounded, Set, Shadow, Shape, Sign Our Ppt Correlated Arrows In Horizontal Create PowerPoint Macro 7 State Diagram Templates are exceptionally adaptive. They will blend in with any scenario.
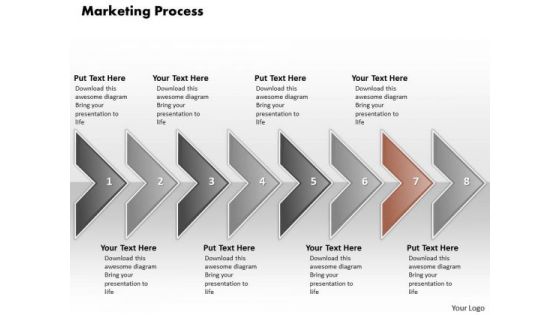
Ppt Illustration Of Marketing Process Using 8 State Diagram PowerPoint Templates
PPT illustration of marketing process using 8 state diagram PowerPoint Templates-This Diagram is used to illustrate how information will move between interrelated systems in the accomplishment of a given function, task or process. The visual description of this information flow with each given level showing how data is fed into a given process step and subsequently passed along at the completion of that step.-PPT illustration of marketing process using 8 state diagram PowerPoint Templates-Aim, Arrow, Badge, Border, Color, Connection, Curve, Design, Direction, Download, Icon, Illustration, Indicator, Internet, Label, Link, Magenta, Mark, Next, Object, Orientation, Paper, Peeling, Pointer, Rounded, Set, Shadow, Shape, Sign Have an exhilirating event with our Ppt Illustration Of Marketing Process Using 8 State Diagram PowerPoint Templates. Feel a surge of excitement in you.
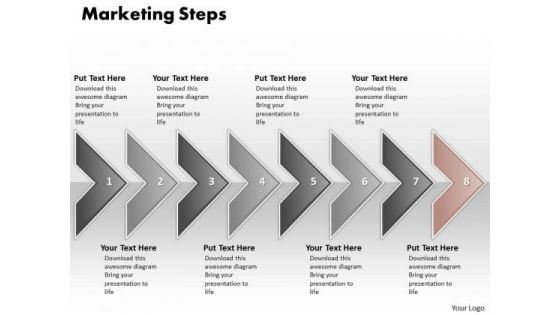
Ppt PowerPoint Slide Numbers Of Marketing Process Using 8 State Diagram Templates
PPT powerpoint slide numbers of marketing process using 8 state diagram Templates-Our compelling template consists of a design of arrow in straight line. This Diagram is used to illustrate how information will move between interrelated systems in the accomplishment of a given function, task or process. The visual description of this information flow with each given level showing how data is fed into a given process step and subsequently passed along at the completion of that step.-PPT powerpoint slide numbers of marketing process using 8 state diagram Templates-Aim, Arrow, Badge, Border, Color, Connection, Curve, Design, Direction, Download, Icon, Illustration, Indicator, Internet, Label, Link, Magenta, Mark, Next, Object, Orientation, Paper, Peeling, Pointer, Rounded, Set, Shadow, Shape, Sign Put in our Ppt PowerPoint Slide Numbers Of Marketing Process Using 8 State Diagram Templates as the catalyst. Churn out new equations with your ideas.
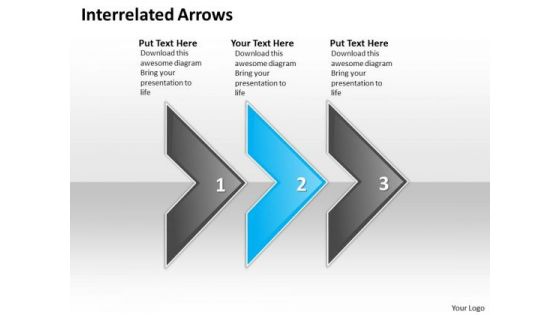
Ppt Interrelated Circular Arrows PowerPoint 2010 3 State Diagram Business Templates
PPT interrelated circular arrows powerpoint 2010 3 state diagram Business Templates-Most events and in every aspect of life are invariably interlinked. Use this graphic to outline your thoughts and their inherent interdependence to achieve the final outcome. Expand on your plans to overcome such obstacles and reassure the team that they shall continue to roll along merrily.-PPT interrelated circular arrows powerpoint 2010 3 state diagram Business Templates-Aim, Arrow, Arrowheads, Badge, Border, Click, Connection, Curve, Design, Direction, Download, Element, Fuchsia, Icon, Illustration, Indicator, Internet, Magenta, Mark, Object, Orientation, Pointer, Shadow, Shape, Sign Influence decision makers with our Ppt Interrelated Circular Arrows PowerPoint 2010 3 State Diagram Business Templates. Make sure your presentation gets the attention it deserves.
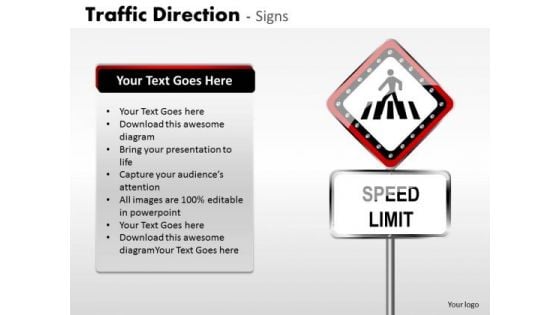
Strategy Diagram Traffic Direction Signs Business Finance Strategy Development
Get Out Of The Dock With Our Strategy Diagram Traffic Direction Signs Business Finance Strategy Development Powerpoint Templates. Your Mind Will Be Set Free.
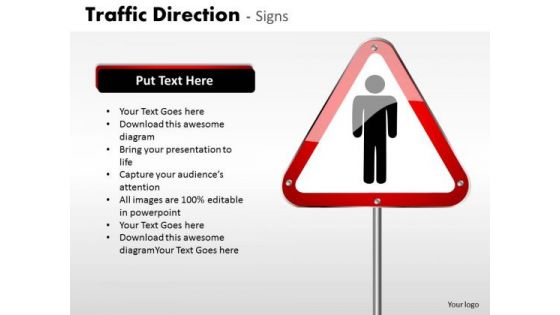
Marketing Diagram Traffic Direction Signs Business Finance Strategy Development
Our Marketing Diagram Traffic Direction Signs Business Finance Strategy Development Powerpoint Templates Deliver At Your Doorstep. Let Them In For A Wonderful Experience.
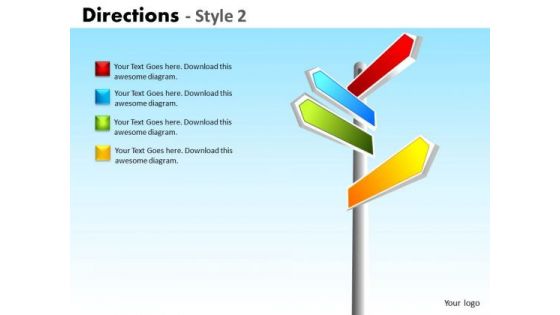
Marketing Diagram Directions Style 2 Business Framework Model
Connect The Dots With Our Marketing Diagram Directions Style 2 Business Framework Model Powerpoint Templates. Watch The Whole Picture Clearly Emerge.
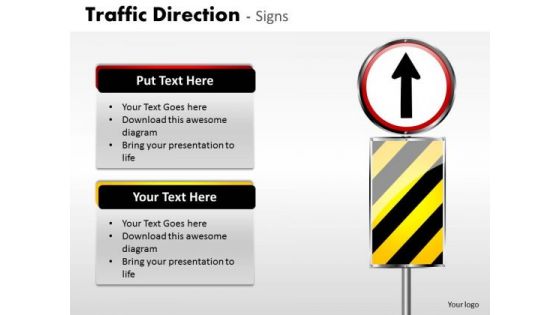
Consulting Diagram Traffic Direction Signs Business Finance Strategy Development
Double Up Our Consulting Diagram Traffic Direction Signs Business Finance Strategy Development Powerpoint Templates With Your Thoughts. They Will Make An Awesome Pair.
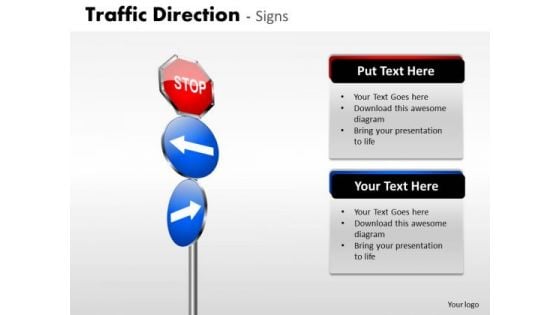
Business Framework Model Traffic Direction Signs Sales Diagram
Plan For All Contingencies With Our Business Framework Model Traffic Direction Signs Sales Diagram Powerpoint Templates. Douse The Fire Before It Catches.

Business Framework Model Directions Style 2 Strategy Diagram
Good Camaraderie Is A Key To Teamwork. Our Business Framework Model Directions Style 2 Strategy Diagram Powerpoint Templates Can Be A Cementing Force.
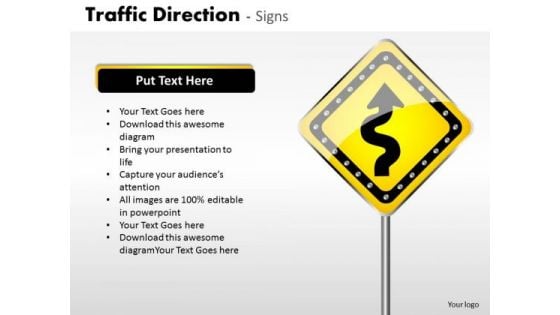
Business Finance Strategy Development Traffic Direction Signs Strategy Diagram
Your Grasp Of Economics Is Well Known. Help Your Audience Comprehend Issues With Our Business Finance Strategy Development Traffic Direction Signs Strategy Diagram Powerpoint Templates.
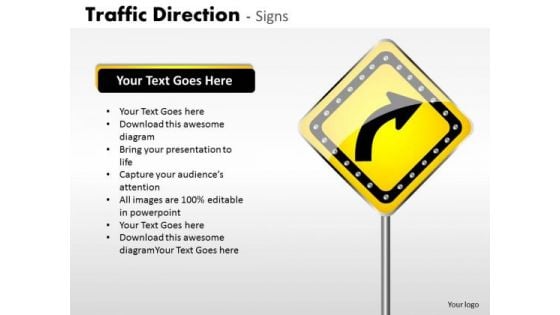
Business Finance Strategy Development Traffic Direction Signs Sales Diagram
Our Business Finance Strategy Development Traffic Direction Signs Sales Diagram Powerpoint Templates Heighten Concentration. Your Audience Will Be On The Edge.
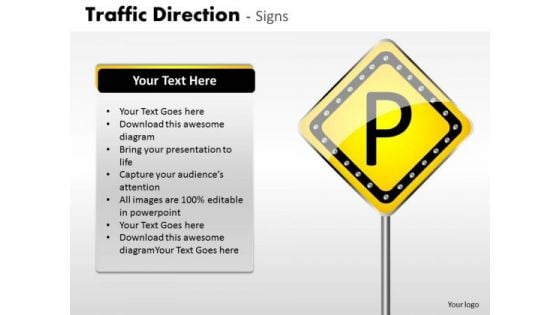
Business Finance Strategy Development Traffic Direction Signs Marketing Diagram
Edit Your Work With Our Business Finance Strategy Development Traffic Direction Signs Marketing Diagram Powerpoint Templates. They Will Help You Give The Final Form.
Business Finance Strategy Development Traffic Direction Signs Business Cycle Diagram
Land The Idea With Our Business Finance Strategy Development Traffic Direction Signs Business Cycle Diagram Powerpoint Templates. Help It Grow With Your Thoughts.
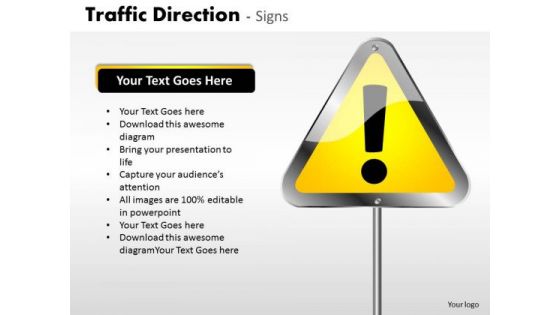
Business Diagram Traffic Direction Signs Mba Models And Frameworks
Put Them On The Same Page With Our Business Diagram Traffic Direction Signs MBA Models And Frameworks Powerpoint Templates. Your Team Will Sing From The Same Sheet.

Business Diagram Traffic Direction Signs Business Finance Strategy Development
Our Business Diagram Traffic Direction Signs Business Finance Strategy Development Powerpoint Templates Allow You To Do It With Ease. Just Like Picking The Low Hanging Fruit.
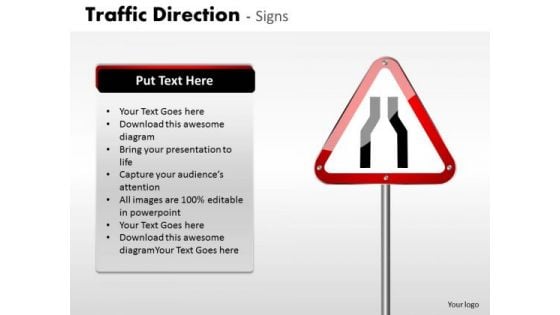
Business Cycle Diagram Traffic Direction Signs Strategic Management
Draft It Out On Our Business Cycle Diagram Traffic Direction Signs Strategic Management Powerpoint Templates. Give The Final Touches With Your Ideas.

Business Cycle Diagram Directions Style 2 Business Framework Model
Be The Dramatist With Our Business Cycle Diagram Directions Style 2 Business Framework Model Powerpoint Templates. Script Out The Play Of Words.
Green Computing Green Cloud Computing Performance Tracking Dashboard
This slide depicts the performance tracking dashboard for green cloud computing. This slide aims to showcase the performance tracking report of green cloud computing by covering parameters such asPower Use Effectiveness PUE, high-density zone, history, consumption, and Average Propensity to Consume APC consumption. If you are looking for a format to display your unique thoughts, then the professionally designed Green Computing Green Cloud Computing Performance Tracking Dashboard is the one for you. You can use it as a Google Slides template or a PowerPoint template. Incorporate impressive visuals, symbols, images, and other charts. Modify or reorganize the text boxes as you desire. Experiment with shade schemes and font pairings. Alter, share or cooperate with other people on your work. Download Green Computing Green Cloud Computing Performance Tracking Dashboard and find out how to give a successful presentation. Present a perfect display to your team and make your presentation unforgettable. This slide depicts the performance tracking dashboard for green cloud computing. This slide aims to showcase the performance tracking report of green cloud computing by covering parameters such asPower Use Effectiveness PUE, high-density zone, history, consumption, and Average Propensity to Consume APC consumption.
Green Cloud Computing Performance Tracking Dashboard Eco Friendly Computing IT
This slide depicts the performance tracking dashboard for green cloud computing. This slide aims to showcase the performance tracking report of green cloud computing by covering parameters such as Power Use Effectiveness PUE, high-density zone, history, consumption, and Average Propensity to Consume APC consumption.If you are looking for a format to display your unique thoughts, then the professionally designed Green Cloud Computing Performance Tracking Dashboard Eco Friendly Computing IT is the one for you. You can use it as a Google Slides template or a PowerPoint template. Incorporate impressive visuals, symbols, images, and other charts. Modify or reorganize the text boxes as you desire. Experiment with shade schemes and font pairings. Alter, share or cooperate with other people on your work. Download Green Cloud Computing Performance Tracking Dashboard Eco Friendly Computing IT and find out how to give a successful presentation. Present a perfect display to your team and make your presentation unforgettable. This slide depicts the performance tracking dashboard for green cloud computing. This slide aims to showcase the performance tracking report of green cloud computing by covering parameters such as Power Use Effectiveness ,PUE, high-density zone, history, consumption, and Average Propensity to Consume ,APC consumption.
Dashboard For Tracking Viral Marketing Tracking Word Mouth Marketing Inspiration PDF
This slide showcases the parameters for business organizations to evaluate viral marketing performance. It includes KPIs such as user metrics, campaign metrics, social metrics, engagement rate, viral sign-ups, etc. Find highly impressive Dashboard For Tracking Viral Marketing Tracking Word Mouth Marketing Inspiration PDF on Slidegeeks to deliver a meaningful presentation. You can save an ample amount of time using these presentation templates. No need to worry to prepare everything from scratch because Slidegeeks experts have already done a huge research and work for you. You need to download Dashboard For Tracking Viral Marketing Tracking Word Mouth Marketing Inspiration PDF for your upcoming presentation. All the presentation templates are 100 percent editable and you can change the color and personalize the content accordingly. Download now This slide showcases the parameters for business organizations to evaluate viral marketing performance. It includes KPIs such as user metrics, campaign metrics, social metrics, engagement rate, viral sign-ups, etc.
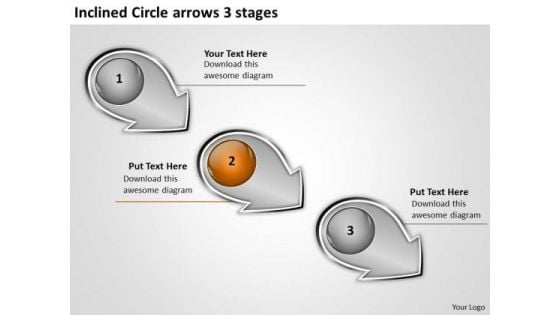
Inclined Circle Arrows 3 Stages Ppt Flowcharts Vision PowerPoint Slides
We present our inclined circle arrows 3 stages ppt flowcharts vision PowerPoint Slides. Use our Finance PowerPoint Templates because, this one depicts the popular chart. Use our Process and Flows PowerPoint Templates because, Now use this slide to bullet point your views. Use our Business PowerPoint Templates because, Marketing Strategy Business Template:- Maximizing sales of your product is the intended destination. Use our Circle Charts PowerPoint Templates because, you have it all down to a T. Use our Shapes PowerPoint Templates because, Different people with differing ideas and priorities perform together to score. Use these PowerPoint slides for presentations relating to Arrow, business, circle, circular, collection, connection, cursor, decoration, design, dimensional, direction, element, icon, illustration, information, modern, motion, perspective, process, recycle, recycling, reflective, shape, shiny, sign, symbol, technology. The prominent colors used in the PowerPoint template are Orange, White, and Black Breathe easy with our Inclined Circle Arrows 3 Stages Ppt Flowcharts Vision PowerPoint Slides. Maintain a steady rate of thought.
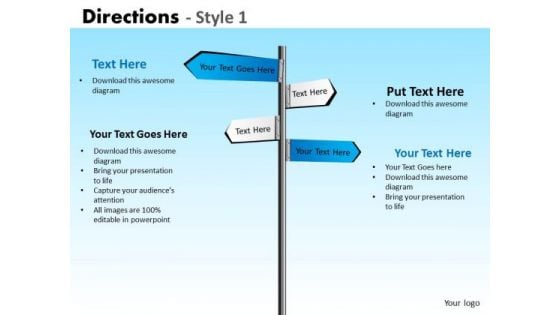
Business Framework Model Directions Style 1 Strategy Diagram
Analyze Ailments On Our Business Framework Model Directions Style 1 Strategy Diagram Powerpoint Templates. Bring Out The Thinking Doctor In You. Dock Your Thoughts With Our Business Framework Model Directions Style 1 Strategy Diagram Powerpoint Templates. They Will Launch Them Into Orbit.
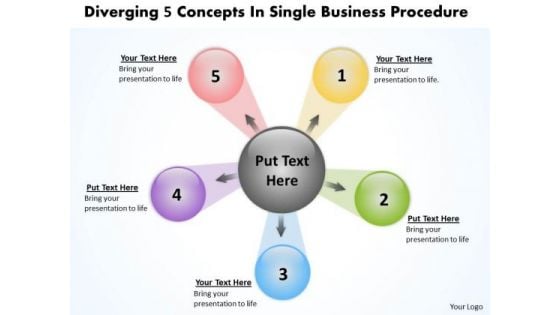
PowerPoint Templates Free Download Procedure Circular Motion Chart
We present our powerpoint templates free download procedure Circular Motion Chart.Download our Circle Charts PowerPoint Templates because You can Connect the dots. Fan expectations as the whole picture emerges. Download and present our Abstract PowerPoint Templates because this template helps you to delve on these thoughts and brief your team on the value of your depth of understanding of the subject. Present our Arrows PowerPoint Templates because this slide demonstrates how they contribute to the larger melting pot. Use our Business PowerPoint Templates because maximising sales of your product is the intended destination. Download our Flow Charts PowerPoint Templates because you have a great training programme in mind to upgrade the skills of your staff.Use these PowerPoint slides for presentations relating to abstract, arrow, backdrop, background, banner, blank, blue, box, bright, brochure, business, chart, circle, color, colorful, concept, cube, description, design, diagram, element, graphic, illustration, item, management, marketing, message, modern, network, pink, place, presentation, purple, red, shape, sign, site, square, style, symbol, template,. The prominent colors used in the PowerPoint template are Yellow, Green, Blue. Presenters tell us our powerpoint templates free download procedure Circular Motion Chart effectively help you save your valuable time. You can be sure our bright PowerPoint templates and PPT Slides are Delightful. Professionals tell us our powerpoint templates free download procedure Circular Motion Chart are Efficacious. People tell us our blue PowerPoint templates and PPT Slides have awesome images to get your point across. People tell us our powerpoint templates free download procedure Circular Motion Chart are Appealing. Professionals tell us our box PowerPoint templates and PPT Slides are Cheerful. Plan your victory with our PowerPoint Templates Free Download Procedure Circular Motion Chart. You will come out on top.
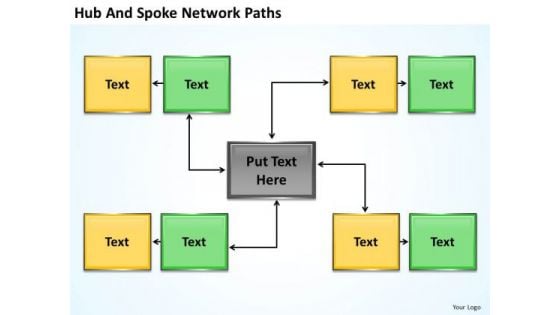
Business Charts Hub And Spoke Network Path PowerPoint Slides
We present our business charts hub and spoke network path PowerPoint Slides.Download and present our Process and Flows PowerPoint Templates because You can Bait your audience with our PowerPoint Templates and Slides. They will bite the hook of your ideas in large numbers. Download our Shapes PowerPoint Templates because It can Leverage your style with our PowerPoint Templates and Slides. Charm your audience with your ability. Present our Business PowerPoint Templates because Our PowerPoint Templates and Slides offer you the needful to organise your thoughts. Use them to list out your views in a logical sequence. Download and present our Flow Charts PowerPoint Templates because Our PowerPoint Templates and Slides team portray an attitude of elegance. Personify this quality by using them regularly. Download and present our Marketing PowerPoint Templates because It can Bubble and burst with your ideas.Use these PowerPoint slides for presentations relating to Business,career, cloud, computer, create, current, develop, employer, glowing, graphic,great, guide, illustration, information, knowledge, light, managing, mutual, neon,network, networking, organization, people, power, professional, projects, provide,quickly, relationships, sharing, stakeholders, style, stylized, support, tagcloud, team, word, wordcloud, work. The prominent colors used in the PowerPoint template are Green lime, Yellow, Gray. Our Business Charts Hub And Spoke Network Path PowerPoint Slides will ensure you are the best presenter in the room. You will be glad you tried us out.
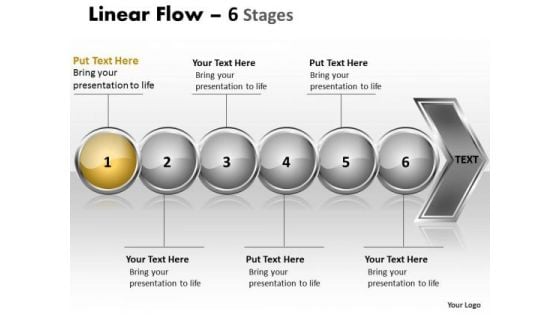
Business Ppt Continuous Illustration Of 6 Issues Strategy PowerPoint 2 Design
We present our Business PPT continuous illustration of 6 issues strategy PowerPoint 2 design. Use our Spheres PowerPoint Templates because; emphasize the process of your business/corporate growth. Use our Business PowerPoint Templates because, Marketing Strategy Business Template: - Maximizing sales of your product is the intended destination. Use our Arrows PowerPoint Templates because; Use our templates to emphasize your views. Use our Symbol PowerPoint Templates because, Many a core idea has various enveloping layers. Use our Process and Flows PowerPoint Templates because; Use our templates to illustrate your ability. Use these PowerPoint slides for presentations relating to Abstract, Arrow, Blank, Business, Chart, Circular, Circulation, Concept, Conceptual, Design, Diagram, Executive, Icon, Idea, Illustration, Linear, Flow, Management, Model, Numbers, Organization, Procedure, Process, Progression, Resource, Sequence, Sequential, Stages, Steps, Strategy. The prominent colors used in the PowerPoint template are Yellow, Gray, and Black You are fastidious with your choices. Our Business Ppt Continuous Illustration Of 6 Issues Strategy PowerPoint 2 Design will certainly catch your fancy.
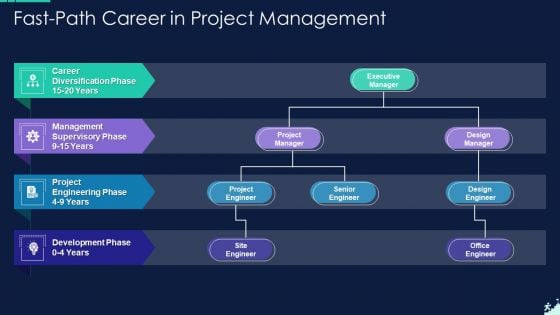
Fast Path Career In Project Management Rules PDF
Presenting fast path career in project management rules pdf to dispense important information. This template comprises four stages. It also presents valuable insights into the topics including development phase, project engineering phase, management supervisory phase. This is a completely customizable PowerPoint theme that can be put to use immediately. So, download it and address the topic impactfully.
Dashboard For Tracking Ambassador Marketing Tracking Word Mouth Marketing Summary PDF
This slide covers the KPI dashboard for companies to evaluate the performance of ambassador marketing campaigns. It includes metrics such as the number of brand ambassadors, the total number of shares, clicks, CPS, revenue, commissions, etc. Do you have an important presentation coming up Are you looking for something that will make your presentation stand out from the rest Look no further than Dashboard For Tracking Ambassador Marketing Tracking Word Mouth Marketing Summary PDF. With our professional designs, you can trust that your presentation will pop and make delivering it a smooth process. And with Slidegeeks, you can trust that your presentation will be unique and memorable. So why wait Grab Dashboard For Tracking Ambassador Marketing Tracking Word Mouth Marketing Summary PDF today and make your presentation stand out from the rest This slide covers the KPI dashboard for companies to evaluate the performance of ambassador marketing campaigns. It includes metrics such as the number of brand ambassadors, the total number of shares, clicks, CPS, revenue, commissions, etc.
Tracking Working Of Employees In Software Companies Summary Pdf
Following slide shows tracking employees hours worked in software companies which assist in to check productivity of employee on daily basis. It includes various KPI such as email received, actual response , average working hours, etc. Pitch your topic with ease and precision using this Tracking Working Of Employees In Software Companies Summary Pdf This layout presents information on Tracking Traffic, Tracking Working, Software Companies It is also available for immediate download and adjustment. So, changes can be made in the color, design, graphics or any other component to create a unique layout. Following slide shows tracking employees hours worked in software companies which assist in to check productivity of employee on daily basis. It includes various KPI such as email received, actual response , average working hours, etc.
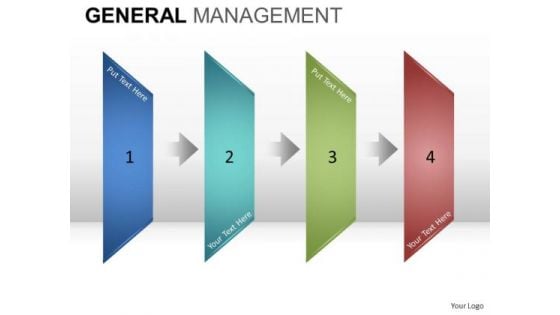
PowerPoint Templates Screeing Process Ppt Slides Download
PowerPoint_Templates_Screeing_Process_PPT_Slides_Download-These high quality powerpoint pre-designed slides and powerpoint templates have been carefully created by our professional team to help you impress your audience. All slides have been created and are 100% editable in powerpoint. Each and every property of any graphic - color, size, orientation, shading, outline etc. can be modified to help you build an effective powerpoint presentation. Any text can be entered at any point in the powerpoint template or slide. Simply DOWNLOAD, TYPE and PRESENT! These PowerPoint presentation slides can be used to represent themes relating to --Abstract, action, analysis, blank, business, chart, clipart, commerce, concept, conceptual, design, diagram, direction, flow, generic, goals, guide, guidelines, heirarchy, icon, idea, illustration, lingakes, links, manage, management, mba, model, organization, performance, plan, process, project, relationship, representation, resource, steps, strategy, success, tactics, theoretical, theory, tool, workflow-PowerPoint_Templates_Screeing_Process_PPT_Slides_Download Put up the facts and figures on our PowerPoint Templates Screeing Process Ppt Slides Download. Display the data for everyone's consumption.
Tracking Word Of Mouth Marketing Campaigns Result Ppt PowerPoint Presentation Complete Deck With Slides
This Tracking Word Of Mouth Marketing Campaigns Result Ppt PowerPoint Presentation Complete Deck With Slides is designed to help you retain your audiences attention. This content-ready PowerPoint Template enables you to take your audience on a journey and share information in a way that is easier to recall. It helps you highlight the crucial parts of your work so that the audience does not get saddled with information download. This seventy six slide PPT Deck comes prepared with the graphs and charts you could need to showcase your information through visuals. You only need to enter your own data in them. Download this editable PowerPoint Theme and walk into that meeting with confidence. Our Tracking Word Of Mouth Marketing Campaigns Result Ppt PowerPoint Presentation Complete Deck With Slides are topically designed to provide an attractive backdrop to any subject. Use them to look like a presentation pro.
Brand Podcast Performance Tracking Dashboards Comprehensive Guide Mockup Pdf
This slide showcases dashboard used to track the performance of podcast produced by brands as part of storytelling marketing campaign. It tracks listeners, number of plays, new followers, time-listened, top performing episode and top cities. Presenting this PowerPoint presentation, titled Brand Podcast Performance Tracking Dashboards Comprehensive Guide Mockup Pdf with topics curated by our researchers after extensive research. This editable presentation is available for immediate download and provides attractive features when used. Download now and captivate your audience. Presenting this Brand Podcast Performance Tracking Dashboards Comprehensive Guide Mockup Pdf Our researchers have carefully researched and created these slides with all aspects taken into consideration. This is a completely customizable Brand Podcast Performance Tracking Dashboards Comprehensive Guide Mockup Pdf that is available for immediate downloading. Download now and make an impact on your audience. Highlight the attractive features available with our PPTs. This slide showcases dashboard used to track the performance of podcast produced by brands as part of storytelling marketing campaign. It tracks listeners, number of plays, new followers, time-listened, top performing episode and top cities.
Corporate Branding Performance Tracking Dashboard Leveraging Corporate Rules Pdf
This slide provides information regarding corporate branding performance tracking dashboard in terms of leads, conversion metrics, web traffic, etc. If your project calls for a presentation, then Slidegeeks is your go-to partner because we have professionally designed, easy-to-edit templates that are perfect for any presentation. After downloading, you can easily edit Corporate Branding Performance Tracking Dashboard Leveraging Corporate Rules Pdf and make the changes accordingly. You can rearrange slides or fill them with different images. Check out all the handy templates This slide provides information regarding corporate branding performance tracking dashboard in terms of leads, conversion metrics, web traffic, etc.
Corporate Branding Performance Tracking Dashboard Effective Brand Maintenance Pictures Pdf
This slide provides information regarding corporate branding performance tracking dashboard in terms of leads, conversion metrics, web traffic, etc. Find highly impressive Corporate Branding Performance Tracking Dashboard Effective Brand Maintenance Pictures Pdf on Slidegeeks to deliver a meaningful presentation. You can save an ample amount of time using these presentation templates. No need to worry to prepare everything from scratch because Slidegeeks experts have already done a huge research and work for you. You need to download Corporate Branding Performance Tracking Dashboard Effective Brand Maintenance Pictures Pdf for your upcoming presentation. All the presentation templates are 100 percent editable and you can change the color and personalize the content accordingly. Download now. This slide provides information regarding corporate branding performance tracking dashboard in terms of leads, conversion metrics, web traffic, etc.
Product Branding Performance Tracking Dashboard Effective Brand Maintenance Slides Pdf
This slide provides information regarding product branding performance tracking dashboard in terms of revenues, new customers, customer satisfaction rate. Take your projects to the next level with our ultimate collection of Product Branding Performance Tracking Dashboard Effective Brand Maintenance Slides Pdf Slidegeeks has designed a range of layouts that are perfect for representing task or activity duration, keeping track of all your deadlines at a glance. Tailor these designs to your exact needs and give them a truly corporate look with your own brand colors they well make your projects stand out from the rest. This slide provides information regarding product branding performance tracking dashboard in terms of revenues, new customers, customer satisfaction rate.
Activity Tracking Dashboard For Umbrella Brand Leveraging Corporate Pictures Pdf
This slide provides information regarding activities tracking dashboard for umbrella brand in terms of customer retention, market share, etc. Create an editable Activity Tracking Dashboard For Umbrella Brand Leveraging Corporate Pictures Pdf that communicates your idea and engages your audience. Whether you are presenting a business or an educational presentation, pre-designed presentation templates help save time. Activity Tracking Dashboard For Umbrella Brand Leveraging Corporate Pictures Pdf is highly customizable and very easy to edit, covering many different styles from creative to business presentations. Slidegeeks has creative team members who have crafted amazing templates. So, go and get them without any delay. This slide provides information regarding activities tracking dashboard for umbrella brand in terms of customer retention, market share, etc.
Product Branding Performance Tracking Dashboard Strategies For Achieving Pictures Pdf
This slide provides information regarding product branding performance tracking dashboard in terms of revenues, new customers, customer satisfaction rate. This Product Branding Performance Tracking Dashboard Strategies For Achieving Pictures Pdf is perfect for any presentation, be it in front of clients or colleagues. It is a versatile and stylish solution for organizing your meetings. The Product Branding Performance Tracking Dashboard Strategies For Achieving Pictures Pdf features a modern design for your presentation meetings. The adjustable and customizable slides provide unlimited possibilities for acing up your presentation. Slidegeeks has done all the homework before launching the product for you. So, do not wait, grab the presentation templates today This slide provides information regarding product branding performance tracking dashboard in terms of revenues, new customers, customer satisfaction rate.
Database Modeling Structures Data Model Performance Tracking Dashboard Template Pdf
This slide shows the data model performance tracking dashboard. The purpose of this slide is to represent the Information related to the change brought by data models graphically. Formulating a presentation can take up a lot of effort and time, so the content and message should always be the primary focus. The visuals of the PowerPoint can enhance the presenters message, so our Database Modeling Structures Data Model Performance Tracking Dashboard Template Pdf was created to help save time. Instead of worrying about the design, the presenter can concentrate on the message while our designers work on creating the ideal templates for whatever situation is needed. Slidegeeks has experts for everything from amazing designs to valuable content, we have put everything into Database Modeling Structures Data Model Performance Tracking Dashboard Template Pdf. This slide shows the data model performance tracking dashboard. The purpose of this slide is to represent the Information related to the change brought by data models graphically.
Database Modeling Data Model Performance Tracking Dashboard Demonstration Pdf
This slide shows the data model performance tracking dashboard. The purpose of this slide is to represent the Information related to the change brought by data models graphically. Do you have to make sure that everyone on your team knows about any specific topic I yes, then you should give Database Modeling Data Model Performance Tracking Dashboard Demonstration Pdf a try. Our experts have put a lot of knowledge and effort into creating this impeccable Database Modeling Data Model Performance Tracking Dashboard Demonstration Pdf. You can use this template for your upcoming presentations, as the slides are perfect to represent even the tiniest detail. You can download these templates from the Slidegeeks website and these are easy to edit. So grab these today This slide shows the data model performance tracking dashboard. The purpose of this slide is to represent the Information related to the change brought by data models graphically.
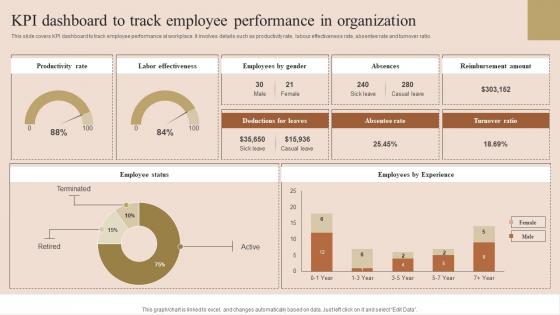
KPI Dashboard To Track Employee Performance Improvement Techniques Rules Pdf
This slide covers KPI dashboard to track employee performance at workplace. It involves details such as productivity rate, labour effectiveness rate, absentee rate and turnover ratio. Explore a selection of the finest KPI Dashboard To Track Employee Performance Improvement Techniques Rules Pdf here. With a plethora of professionally designed and pre made slide templates, you can quickly and easily find the right one for your upcoming presentation. You can use our KPI Dashboard To Track Employee Performance Improvement Techniques Rules Pdf to effectively convey your message to a wider audience. Slidegeeks has done a lot of research before preparing these presentation templates. The content can be personalized and the slides are highly editable. Grab templates today from Slidegeeks. This slide covers KPI dashboard to track employee performance at workplace. It involves details such as productivity rate, labour effectiveness rate, absentee rate and turnover ratio.
Cybernetics Implant Performance Tracking Dashboard Cybernetic Systems Template Pdf
This slide shows the Cybernetics implant performance tracking dashboard. The purpose of this slide is to represent the Information related to the status of Cybernetics implant graphically. This Cybernetics Implant Performance Tracking Dashboard Cybernetic Systems Template Pdf is perfect for any presentation, be it in front of clients or colleagues. It is a versatile and stylish solution for organizing your meetings. The Cybernetics Implant Performance Tracking Dashboard Cybernetic Systems Template Pdf features a modern design for your presentation meetings. The adjustable and customizable slides provide unlimited possibilities for acing up your presentation. Slidegeeks has done all the homework before launching the product for you. So, do not wait, grab the presentation templates today This slide shows the Cybernetics implant performance tracking dashboard. The purpose of this slide is to represent the Information related to the status of Cybernetics implant graphically.
Unlocking Potential Enhancing Team Members Performance Tracking Dashboards
This slide depicts performance tracking dashboard for project manager to analyze work being done by the team. It includes average rating for the week, total work done and weekly change, employee rating and work done. Take your projects to the next level with our ultimate collection of Unlocking Potential Enhancing Team Members Performance Tracking Dashboards. Slidegeeks has designed a range of layouts that are perfect for representing task or activity duration, keeping track of all your deadlines at a glance. Tailor these designs to your exact needs and give them a truly corporate look with your own brand colors they will make your projects stand out from the rest This slide depicts performance tracking dashboard for project manager to analyze work being done by the team. It includes average rating for the week, total work done and weekly change, employee rating and work done.
Driving Results Designing A Team Members Performance Tracking Dashboards
This slide depicts performance tracking dashboard for project manager to analyze work being done by the team. It includes average rating for the week, total work done and weekly change, employee rating and work done. This Driving Results Designing A Team Members Performance Tracking Dashboards is perfect for any presentation, be it in front of clients or colleagues. It is a versatile and stylish solution for organizing your meetings. The Driving Results Designing A Team Members Performance Tracking Dashboards features a modern design for your presentation meetings. The adjustable and customizable slides provide unlimited possibilities for acing up your presentation. Slidegeeks has done all the homework before launching the product for you. So, do not wait, grab the presentation templates today This slide depicts performance tracking dashboard for project manager to analyze work being done by the team. It includes average rating for the week, total work done and weekly change, employee rating and work done.
Dashboard Analysis For Tracking Agricultural Tasks Adopting Sustainable Farming Techniques
This slide showcases the KPIs that would help to track the improvements with adoption of new sustainable agriculture practices. It includes current tasks, crops, harvest, todays weather, summary, etc. Take your projects to the next level with our ultimate collection of Dashboard Analysis For Tracking Agricultural Tasks Adopting Sustainable Farming Techniques. Slidegeeks has designed a range of layouts that are perfect for representing task or activity duration, keeping track of all your deadlines at a glance. Tailor these designs to your exact needs and give them a truly corporate look with your own brand colors they will make your projects stand out from the rest This slide showcases the KPIs that would help to track the improvements with adoption of new sustainable agriculture practices. It includes current tasks, crops, harvest, todays weather, summary, etc.
Security Breach Events Tracking Dashboard Data Fortification Strengthening Defenses
This slide represents the dashboard to track data breach attacks. The purpose of this slide is to provide a graphical representation of cyber attacks that occurred in a specific period. It also depicts the overview of different types of attacks.Create an editable Security Breach Events Tracking Dashboard Data Fortification Strengthening Defenses that communicates your idea and engages your audience. Whether you are presenting a business or an educational presentation, pre-designed presentation templates help save time. Security Breach Events Tracking Dashboard Data Fortification Strengthening Defenses is highly customizable and very easy to edit, covering many different styles from creative to business presentations. Slidegeeks has creative team members who have crafted amazing templates. So, go and get them without any delay. This slide represents the dashboard to track data breach attacks. The purpose of this slide is to provide a graphical representation of cyber attacks that occurred in a specific period. It also depicts the overview of different types of attacks.

Penguin Couple Holding Hands PowerPoint Templates Ppt Backgrounds For Slides 0213
We present our Penguin Couple Holding Hands PowerPoint Templates PPT Backgrounds For Slides 0213.Download and present our Festival PowerPoint Templates because You are working at that stage with an air of royalty. Let our PowerPoint Templates and Slides be the jewels in your crown. Download and present our Shapes PowerPoint Templates because Our PowerPoint Templates and Slides are innately eco-friendly. Their high recall value negate the need for paper handouts. Present our Curves and Lines PowerPoint Templates because Our PowerPoint Templates and Slides will let you Leave a lasting impression to your audiences. They possess an inherent longstanding recall factor. Download and present our Signs PowerPoint Templates because You can Connect the dots. Fan expectations as the whole picture emerges. Download and present our Stars PowerPoint Templates because You can Raise a toast with our PowerPoint Templates and Slides. Spread good cheer amongst your audience.Use these PowerPoint slides for presentations relating to Background of penguins that appear to be holding hands, festival, shapes, signs, curves and lines, stars. The prominent colors used in the PowerPoint template are Red, Black, White. Address the developmental concerns of your clients. Advise on avenues available with our Penguin Couple Holding Hands PowerPoint Templates Ppt Backgrounds For Slides 0213.

Illustration Of Glossy Christmas Tree Festival PowerPoint Templates Ppt Backgrounds For Slides 0413
We present our Illustration Of Glossy Christmas Tree Festival PowerPoint Templates PPT Backgrounds For Slides 0413.Use our Christmas PowerPoint Templates because you should once Tap the ingenuity of our PowerPoint Templates and Slides. They are programmed to succeed. Present our Stars PowerPoint Templates because Our PowerPoint Templates and Slides will weave a web of your great ideas. They are gauranteed to attract even the most critical of your colleagues. Use our Shapes PowerPoint Templates because You canTake a leap off the starting blocks with our PowerPoint Templates and Slides. They will put you ahead of the competition in quick time. Download and present our Business PowerPoint Templates because you should Whip up a frenzy with our PowerPoint Templates and Slides. They will fuel the excitement of your team. Present our Success PowerPoint Templates because You are an avid believer in ethical practices. Highlight the benefits that accrue with our PowerPoint Templates and Slides.Use these PowerPoint slides for presentations relating to Christmas tree of glossy, christmas, stars, shapes, business, success. The prominent colors used in the PowerPoint template are Yellow, Green, Red. Develop their enthusiasm to explore new avenues. Activate their curiosity with our Illustration Of Glossy Christmas Tree Festival PowerPoint Templates Ppt Backgrounds For Slides 0413.
Tracking The Improvements Buzz Marketing Techniques For Engaging Rules Pdf
This slide showcases the KPIs that would help the business organization to evaluate buzz marketing campaigns improvements. It includes social media followers, YouTube subscribers, Facebook engagement and page impressions, page likes, etc. If you are looking for a format to display your unique thoughts, then the professionally designed Tracking The Improvements Buzz Marketing Techniques For Engaging Rules Pdf is the one for you. You can use it as a Google Slides template or a PowerPoint template. Incorporate impressive visuals, symbols, images, and other charts. Modify or reorganize the text boxes as you desire. Experiment with shade schemes and font pairings. Alter, share or cooperate with other people on your work. Download Tracking The Improvements Buzz Marketing Techniques For Engaging Rules Pdf and find out how to give a successful presentation. Present a perfect display to your team and make your presentation unforgettable. This slide showcases the KPIs that would help the business organization to evaluate buzz marketing campaigns improvements. It includes social media followers, YouTube subscribers, Facebook engagement and page impressions, page likes, etc.
Dashboard Tracking Business Major Promotional Analytics Future Trends Clipart Pdf
This slide covers the dashboard for analyzing blogging KPIs such as performance, published posts, views, new blog subscribers, top blog posts by pageviews, top blog posts by CTR, etc. If you are looking for a format to display your unique thoughts, then the professionally designed Dashboard Tracking Business Major Promotional Analytics Future Trends Clipart Pdf is the one for you. You can use it as a Google Slides template or a PowerPoint template. Incorporate impressive visuals, symbols, images, and other charts. Modify or reorganize the text boxes as you desire. Experiment with shade schemes and font pairings. Alter, share or cooperate with other people on your work. Download Dashboard Tracking Business Major Promotional Analytics Future Trends Clipart Pdf and find out how to give a successful presentation. Present a perfect display to your team and make your presentation unforgettable. This slide covers the dashboard for analyzing blogging KPIs such as performance, published posts, views, new blog subscribers, top blog posts by pageviews, top blog posts by CTR, etc.
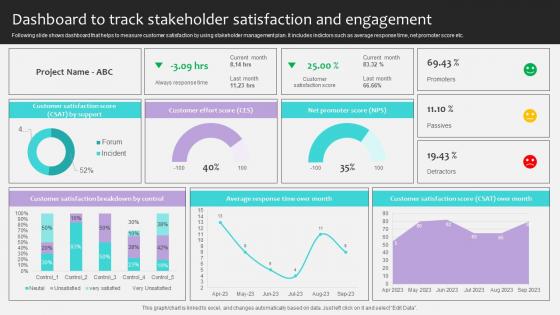
Project Stakeholders Management Dashboard To Track Stakeholder Satisfaction Ppt Powerpoint
Following slide shows dashboard that helps to measure customer satisfaction by using stakeholder management plan. It includes indictors such as average response time, net promoter score etc. If you are looking for a format to display your unique thoughts, then the professionally designed Project Stakeholders Management Dashboard To Track Stakeholder Satisfaction Ppt Powerpoint is the one for you. You can use it as a Google Slides template or a PowerPoint template. Incorporate impressive visuals, symbols, images, and other charts. Modify or reorganize the text boxes as you desire. Experiment with shade schemes and font pairings. Alter, share or cooperate with other people on your work. Download Project Stakeholders Management Dashboard To Track Stakeholder Satisfaction Ppt Powerpoint and find out how to give a successful presentation. Present a perfect display to your team and make your presentation unforgettable. Following slide shows dashboard that helps to measure customer satisfaction by using stakeholder management plan. It includes indictors such as average response time, net promoter score etc.
Data Encryption Performance Tracking Client Side Encryption PPT Presentation
This slide represents the dashboard which can be utilized by organization to monitor cloud security. It includes overall progress, number of critical risks identified, initiatives, incident management, compliance, patches, highest number of critical incidents, etc. If you are looking for a format to display your unique thoughts, then the professionally designed Data Encryption Performance Tracking Client Side Encryption PPT Presentation is the one for you. You can use it as a Google Slides template or a PowerPoint template. Incorporate impressive visuals, symbols, images, and other charts. Modify or reorganize the text boxes as you desire. Experiment with shade schemes and font pairings. Alter, share or cooperate with other people on your work. Download Data Encryption Performance Tracking Client Side Encryption PPT Presentation and find out how to give a successful presentation. Present a perfect display to your team and make your presentation unforgettable. This slide represents the dashboard which can be utilized by organization to monitor cloud security. It includes overall progress, number of critical risks identified, initiatives, incident management, compliance, patches, highest number of critical incidents, etc.

Stock Photo Business Strategy Execution Umbrella With Flag Design Stock Photo Pictures Images
Our stock photo business strategy execution umbrella with flag design stock photo pictures images Let You Put Your Feet Up. Enjoy The Comforts They Will Bring. Get Your Team To Follow In Your Footsteps. Our Americana Will Blaze The Trail.

Ppt Linear Arrow Change Management Process PowerPoint Presentation 6 Stages Templates
PPT linear arrow change management process powerpoint presentation 6 stages Templates-Arrow timeline PowerPoint Diagram is a Diagram with a timeline design diagram that you can download for PowerPoint presentations. This arrow timeline PowerPoint Diagram contains a diagram created with shapes that represents a basic arrow. This arrow Diagram contains a year timeline ready to be used for business projects or education timeline for PowerPoint. You can use this PPT Diagram as a pointer mark or timeline for business development project using business timelines with a blue arrow and bubbles for each year.-PPT linear arrow change management process powerpoint presentation 6 stages Templates-Aim, Arrow, Arrowheads, Badge, Border, Click, Connection, Curve, Design, Direction, Download, Element, Fuchsia, Icon, Illustration, Indicator, Internet, Magenta, Mark, Object, Orientation, Pointer, Shadow, Shape, Sign Educate them on the basics of fatherhood . Prepare them well with our Ppt Linear Arrow Change Management Process PowerPoint Presentation 6 Stages Templates.
Performance Enhancement Plan Social Media Performance Tracking Professional Pdf
The following slide showcases a dashboard to track and measure social media platforms performance. It includes key elements such as website traffic, social media referral rate, site revenue, social media site revenue, etc. Presenting this PowerPoint presentation, titled Performance Enhancement Plan Social Media Performance Tracking Professional Pdf, with topics curated by our researchers after extensive research. This editable presentation is available for immediate download and provides attractive features when used. Download now and captivate your audience. Presenting this Performance Enhancement Plan Social Media Performance Tracking Professional Pdf. Our researchers have carefully researched and created these slides with all aspects taken into consideration. This is a completely customizable Performance Enhancement Plan Social Media Performance Tracking Professional Pdf that is available for immediate downloading. Download now and make an impact on your audience. Highlight the attractive features available with our PPTs. The following slide showcases a dashboard to track and measure social media platforms performance. It includes key elements such as website traffic, social media referral rate, site revenue, social media site revenue, etc.
Solar Computing IT Green Cloud Computing Performance Tracking Dashboard
This slide depicts the performance tracking dashboard for green cloud computing. This slide aims to showcase the performance tracking report of green cloud computing by covering parameters such as Power Use Effectiveness PUE, high-density zone, history, consumption, and Average Propensity to Consume APC consumption. Are you in need of a template that can accommodate all of your creative concepts This one is crafted professionally and can be altered to fit any style. Use it with Google Slides or PowerPoint. Include striking photographs, symbols, depictions, and other visuals. Fill, move around, or remove text boxes as desired. Test out color palettes and font mixtures. Edit and save your work, or work with colleagues. Download Solar Computing IT Green Cloud Computing Performance Tracking Dashboard and observe how to make your presentation outstanding. Give an impeccable presentation to your group and make your presentation unforgettable. This slide depicts the performance tracking dashboard for green cloud computing. This slide aims to showcase the performance tracking report of green cloud computing by covering parameters such as Power Use Effectiveness PUE, high-density zone, history, consumption, and Average Propensity to Consume APC consumption.
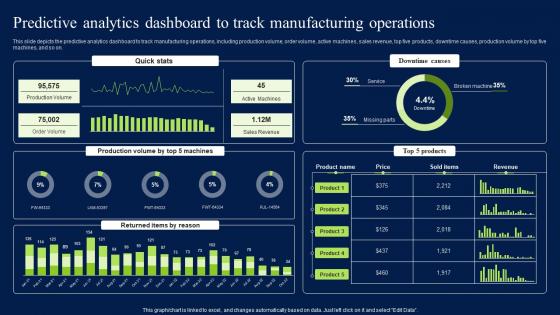
Predictive Analytics Dashboard To Track Manufacturing Operations Download PDF
This slide depicts the predictive analytics dashboard to track manufacturing operations, including production volume, order volume, active machines, sales revenue, top five products, downtime causes, production volume by top five machines, and so on. Present like a pro with Predictive Analytics Dashboard To Track Manufacturing Operations Download PDF Create beautiful presentations together with your team, using our easy-to-use presentation slides. Share your ideas in real-time and make changes on the fly by downloading our templates. So whether you are in the office, on the go, or in a remote location, you can stay in sync with your team and present your ideas with confidence. With Slidegeeks presentation got a whole lot easier. Grab these presentations today. This slide depicts the predictive analytics dashboard to track manufacturing operations, including production volume, order volume, active machines, sales revenue, top five products, downtime causes, production volume by top five machines, and so on.
Industrial Robots Performance Tracking Dashboard Industrial Robots Designs Pdf
This slide shows the dashboard to keep a regular track of the performance of industrial robots. The purpose of this slide is to provide a graphical representation of robots performance to enhance the accuracy and effectiveness of these machines. Slidegeeks has constructed Industrial Robots Performance Tracking Dashboard Industrial Robots Designs Pdf after conducting extensive research and examination. These presentation templates are constantly being generated and modified based on user preferences and critiques from editors. Here, you will find the most attractive templates for a range of purposes while taking into account ratings and remarks from users regarding the content. This is an excellent jumping-off point to explore our content and will give new users an insight into our top-notch PowerPoint Templates. This slide shows the dashboard to keep a regular track of the performance of industrial robots. The purpose of this slide is to provide a graphical representation of robots performance to enhance the accuracy and effectiveness of these machines.
Corporate Branding Performance Tracking Dashboard Strategies For Achieving Summary Pdf
This slide provides information regarding corporate branding performance tracking dashboard in terms of leads, conversion metrics, web traffic, etc. Slidegeeks is one of the best resources for PowerPoint templates. You can download easily and regulate Corporate Branding Performance Tracking Dashboard Strategies For Achieving Summary Pdf for your personal presentations from our wonderful collection. A few clicks is all it takes to discover and get the most relevant and appropriate templates. Use our Templates to add a unique zing and appeal to your presentation and meetings. All the slides are easy to edit and you can use them even for advertisement purposes. This slide provides information regarding corporate branding performance tracking dashboard in terms of leads, conversion metrics, web traffic, etc.
B2B Sales Performance Tracking Dashboard B2B Digital Commerce Graphics Pdf
This slide represents metric dashboard to track sales performance on e-commerce website. It cover performance indicators such as sales breakdown, order breakdown, recurring sales etc. This B2B Sales Performance Tracking Dashboard B2B Digital Commerce Graphics Pdf from Slidegeeks makes it easy to present information on your topic with precision. It provides customization options, so you can make changes to the colors, design, graphics, or any other component to create a unique layout. It is also available for immediate download, so you can begin using it right away. Slidegeeks has done good research to ensure that you have everything you need to make your presentation stand out. Make a name out there for a brilliant performance. This slide represents metric dashboard to track sales performance on e-commerce website. It cover performance indicators such as sales breakdown, order breakdown, recurring sales etc.
Website Performance Tracking Sales Performance Enhancement Ideas Pdf
The following slide showcases a dashboard to track and measure website performance. It includes key elements such as visits, average session duration, bounce rate, page views, goal conversion, visits by week, traffic sources, top channels by conversions, etc. Boost your pitch with our creative Website Performance Tracking Sales Performance Enhancement Ideas Pdf. Deliver an awe inspiring pitch that will mesmerize everyone. Using these presentation templates you will surely catch everyones attention. You can browse the ppts collection on our website. We have researchers who are experts at creating the right content for the templates. So you do not have to invest time in any additional work. Just grab the template now and use them. The following slide showcases a dashboard to track and measure website performance. It includes key elements such as visits, average session duration, bounce rate, page views, goal conversion, visits by week, traffic sources, top channels by conversions, etc.
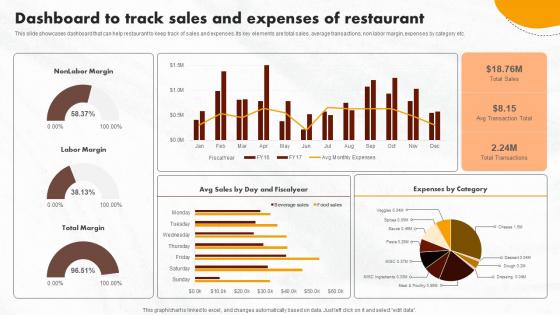
Online Promotional Activities Dashboard To Track Sales Sample Pdf
This slide showcases dashboard that can help restaurant to keep track of sales and expenses. Its key elements are total sales, average transactions, non labor margin, expenses by category etc. Are you in need of a template that can accommodate all of your creative concepts This one is crafted professionally and can be altered to fit any style. Use it with Google Slides or PowerPoint. Include striking photographs, symbols, depictions, and other visuals. Fill, move around, or remove text boxes as desired. Test out color palettes and font mixtures. Edit and save your work, or work with colleagues. Download Online Promotional Activities Dashboard To Track Sales Sample Pdf and observe how to make your presentation outstanding. Give an impeccable presentation to your group and make your presentation unforgettable. This slide showcases dashboard that can help restaurant to keep track of sales and expenses. Its key elements are total sales, average transactions, non labor margin, expenses by category etc.
Performance Enhancement Plan Website Performance Tracking And Monitoring Professional Pdf
The following slide showcases a dashboard to track and measure website performance. It includes key elements such as visits, average session duration, bounce rate, page views, goal conversion, visits by week, traffic sources, top channels by conversions, etc. Find a pre-designed and impeccable Performance Enhancement Plan Website Performance Tracking And Monitoring Professional Pdf. The templates can ace your presentation without additional effort. You can download these easy-to-edit presentation templates to make your presentation stand out from others. So, what are you waiting for Download the template from Slidegeeks today and give a unique touch to your presentation. The following slide showcases a dashboard to track and measure website performance. It includes key elements such as visits, average session duration, bounce rate, page views, goal conversion, visits by week, traffic sources, top channels by conversions, etc.
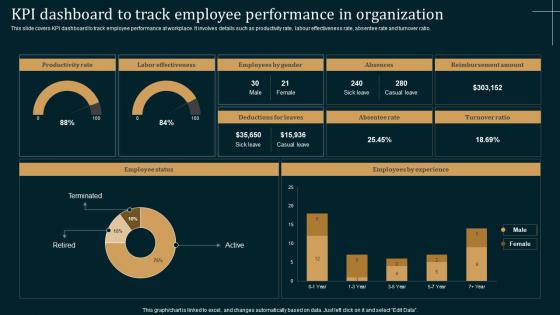
Employee Performance Improvement Strategies KPI Dashboard Track Employee Guidelines Pdf
This slide covers KPI dashboard to track employee performance at workplace. It involves details such as productivity rate, labour effectiveness rate, absentee rate and turnover ratio. Slidegeeks is here to make your presentations a breeze with Employee Performance Improvement Strategies KPI Dashboard Track Employee Guidelines Pdf With our easy to use and customizable templates, you can focus on delivering your ideas rather than worrying about formatting. With a variety of designs to choose from, you are sure to find one that suits your needs. And with animations and unique photos, illustrations, and fonts, you can make your presentation pop. So whether you are giving a sales pitch or presenting to the board, make sure to check out Slidegeeks first This slide covers KPI dashboard to track employee performance at workplace. It involves details such as productivity rate, labour effectiveness rate, absentee rate and turnover ratio.
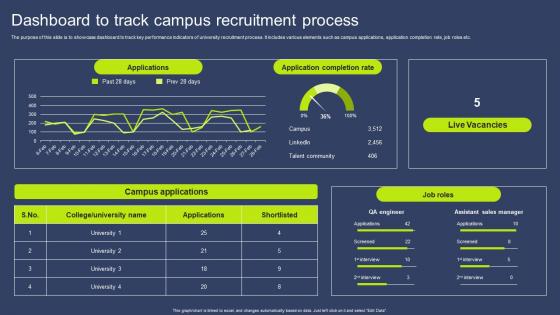
Dashboard To Track Campus Recruitment Process Clipart Pdf
The purpose of this slide is to showcase dashboard to track key performance indicators of university recruitment process. It includes various elements such as campus applications, application completion rate, job roles etc. Showcasing this set of slides titled Dashboard To Track Campus Recruitment Process Clipart Pdf. The topics addressed in these templates are Applications, Application Completion Rate, Live Vacancies. All the content presented in this PPT design is completely editable. Download it and make adjustments in color, background, font etc. as per your unique business setting. The purpose of this slide is to showcase dashboard to track key performance indicators of university recruitment process. It includes various elements such as campus applications, application completion rate, job roles etc.

Complete Guide To Launch Website Analytics Dashboard To Track Performance
This Complete Guide To Launch Website Analytics Dashboard To Track Performance is perfect for any presentation, be it in front of clients or colleagues. It is a versatile and stylish solution for organizing your meetings. The Complete Guide To Launch Website Analytics Dashboard To Track Performance features a modern design for your presentation meetings. The adjustable and customizable slides provide unlimited possibilities for acing up your presentation. Slidegeeks has done all the homework before launching the product for you. So, do not wait, grab the presentation templates today Our Complete Guide To Launch Website Analytics Dashboard To Track Performance are topically designed to provide an attractive backdrop to any subject. Use them to look like a presentation pro.
CASB 2 0 IT CASB Performance Tracking Dashboard
This slide outlines the performance tracking dashboard for CASB deployment. The purpose of this slide is to showcase the status of various applications, IP addresses, users, machines, and web traffic. It also includes cloud discovery open alerts, risk levels, and top entities. If your project calls for a presentation, then Slidegeeks is your go-to partner because we have professionally designed, easy-to-edit templates that are perfect for any presentation. After downloading, you can easily edit CASB 2 0 IT CASB Performance Tracking Dashboard and make the changes accordingly. You can rearrange slides or fill them with different images. Check out all the handy templates This slide outlines the performance tracking dashboard for CASB deployment. The purpose of this slide is to showcase the status of various applications, IP addresses, users, machines, and web traffic. It also includes cloud discovery open alerts, risk levels, and top entities.

Unlocking Potential Enhancing Team Management Dashboard To Track Task Completion
This slide depicts dashboard intended to track task completion rate within teams and its management. It includes data about team roles, planned vs actual tasks, task by status, total utilized work hours and task summary. This Unlocking Potential Enhancing Team Management Dashboard To Track Task Completion from Slidegeeks makes it easy to present information on your topic with precision. It provides customization options, so you can make changes to the colors, design, graphics, or any other component to create a unique layout. It is also available for immediate download, so you can begin using it right away. Slidegeeks has done good research to ensure that you have everything you need to make your presentation stand out. Make a name out there for a brilliant performance. This slide depicts dashboard intended to track task completion rate within teams and its management. It includes data about team roles, planned vs actual tasks, task by status, total utilized work hours and task summary.
Performance Tracking Dashboard For Food Product And Beverage Business
The slide showcases dashboard representing food and beverage business performance tracking tool , which assist to evaluate monthly performance of employees, customer retention etc. Slidegeeks has constructed Performance Tracking Dashboard For Food Product And Beverage Business after conducting extensive research and examination. These presentation templates are constantly being generated and modified based on user preferences and critiques from editors. Here, you will find the most attractive templates for a range of purposes while taking into account ratings and remarks from users regarding the content. This is an excellent jumping-off point to explore our content and will give new users an insight into our top-notch PowerPoint Templates. The slide showcases dashboard representing food and beverage business performance tracking tool , which assist to evaluate monthly performance of employees, customer retention etc.
B2B Marketing Techniques Dashboard For Tracking Social Media Marketing Campaign
This slide showcases social media marketing campaign performance tracking dashboard which helps identify most profitable advertising channel. It provides information regarding KPIs such as impressions, likes, comments, shares, clicks, followers, cost er sessions etc. This modern and well-arranged B2B Marketing Techniques Dashboard For Tracking Social Media Marketing Campaign provides lots of creative possibilities. It is very simple to customize and edit with the Powerpoint Software. Just drag and drop your pictures into the shapes. All facets of this template can be edited with Powerpoint, no extra software is necessary. Add your own material, put your images in the places assigned for them, adjust the colors, and then you can show your slides to the world, with an animated slide included. This slide showcases social media marketing campaign performance tracking dashboard which helps identify most profitable advertising channel. It provides information regarding KPIs such as impressions, likes, comments, shares, clicks, followers, cost er sessions etc.
Candidate Application Tracking System Cloud Recruiting Technologies PPT PowerPoint
This slide showcases dashboard which can assists HRs in tracking application status of multiple candidates. It provides details about active jobs, lead generation, referrals, acceptance status, interviews taken, offers granted, hire source, etc. There are so many reasons you need a Candidate Application Tracking System Cloud Recruiting Technologies PPT PowerPoint. The first reason is you can not spend time making everything from scratch, Thus, Slidegeeks has made presentation templates for you too. You can easily download these templates from our website easily. This slide showcases dashboard which can assists HRs in tracking application status of multiple candidates. It provides details about active jobs, lead generation, referrals, acceptance status, interviews taken, offers granted, hire source, etc.
Candidate Application Tracking Enhancing Recruitment Process PPT Example
This slide showcases dashboard which can assists HRs in tracking application status of multiple candidates. It provides details about active jobs, lead generation, referrals, acceptance status, interviews taken, offers granted, hire source, etc. There are so many reasons you need a Candidate Application Tracking Enhancing Recruitment Process PPT Example. The first reason is you can not spend time making everything from scratch, Thus, Slidegeeks has made presentation templates for you too. You can easily download these templates from our website easily. This slide showcases dashboard which can assists HRs in tracking application status of multiple candidates. It provides details about active jobs, lead generation, referrals, acceptance status, interviews taken, offers granted, hire source, etc.
Dashboard Analysis For Tracking Enhancing Productivity With Adoption PPT Presentation
This slide showcases the KPIs that would help to track the improvements with adoption of new sustainable agriculture practices. It includes current tasks, crops, harvest, todays weather, summary, etc. This Dashboard Analysis For Tracking Enhancing Productivity With Adoption PPT Presentation from Slidegeeks makes it easy to present information on your topic with precision. It provides customization options, so you can make changes to the colors, design, graphics, or any other component to create a unique layout. It is also available for immediate download, so you can begin using it right away. Slidegeeks has done good research to ensure that you have everything you need to make your presentation stand out. Make a name out there for a brilliant performance. This slide showcases the KPIs that would help to track the improvements with adoption of new sustainable agriculture practices. It includes current tasks, crops, harvest, todays weather, summary, etc.
Direct Sales Lead Ppt Powerpoint Presentation Diagram Graph Charts Cpb
This is a direct sales lead ppt powerpoint presentation diagram graph charts cpb. This is a two stage process. The stages in this process are direct sales lead.
Social Media Performance Tracking Sales Performance Enhancement Infographics Pdf
The following slide showcases a dashboard to track and measure social media platforms performance. It includes key elements such as website traffic, social media referral rate, site revenue, social media site revenue, etc. Here you can discover an assortment of the finest PowerPoint and Google Slides templates. With these templates, you can create presentations for a variety of purposes while simultaneously providing your audience with an eye catching visual experience. Download Social Media Performance Tracking Sales Performance Enhancement Infographics Pdf to deliver an impeccable presentation. These templates will make your job of preparing presentations much quicker, yet still, maintain a high level of quality. Slidegeeks has experienced researchers who prepare these templates and write high quality content for you. Later on, you can personalize the content by editing the Social Media Performance Tracking Sales Performance Enhancement Infographics Pdf. The following slide showcases a dashboard to track and measure social media platforms performance. It includes key elements such as website traffic, social media referral rate, site revenue, social media site revenue, etc.
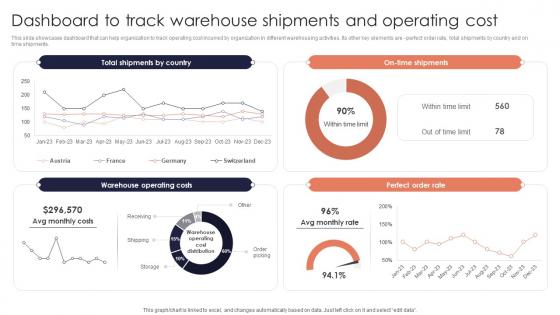
Dashboard Track Warehouse Minimizing Inventory Wastage Through Warehouse Designs Pdf
This slide showcases dashboard that can help organization to track operating cost incurred by organization in different warehousing activities. Its other key elements are perfect order rate, total shipments by country and on time shipments. Do you have to make sure that everyone on your team knows about any specific topic I yes, then you should give Dashboard Track Warehouse Minimizing Inventory Wastage Through Warehouse Designs Pdf a try. Our experts have put a lot of knowledge and effort into creating this impeccable Dashboard Track Warehouse Minimizing Inventory Wastage Through Warehouse Designs Pdf. You can use this template for your upcoming presentations, as the slides are perfect to represent even the tiniest detail. You can download these templates from the Slidegeeks website and these are easy to edit. So grab these today This slide showcases dashboard that can help organization to track operating cost incurred by organization in different warehousing activities. Its other key elements are perfect order rate, total shipments by country and on time shipments.
Confidential Computing Performance Tracking Secure Computing Framework Microsoft Pdf
This slide represents the performance tracking dashboard for confidential computing. The purpose of this slide is to represent the overall performance of the confidential computing cloud environment visually. The main components include overall health, operations, progress, time, cost and workloads. This Confidential Computing Performance Tracking Secure Computing Framework Microsoft Pdf is perfect for any presentation, be it in front of clients or colleagues. It is a versatile and stylish solution for organizing your meetings. The Confidential Computing Performance Tracking Secure Computing Framework Microsoft Pdf features a modern design for your presentation meetings. The adjustable and customizable slides provide unlimited possibilities for acing up your presentation. Slidegeeks has done all the homework before launching the product for you. So, do not wait, grab the presentation templates today This slide represents the performance tracking dashboard for confidential computing. The purpose of this slide is to represent the overall performance of the confidential computing cloud environment visually. The main components include overall health, operations, progress, time, cost and workloads.
Dashboard For Tracking Impact Leveraging Logistics Automation Inspiration Pdf
This slide covers the dashboard for tracking vehicle efficiency after transport automation. It include KPIs such as truck turnaround time, average revenue per hour, truckload capacity, transit time, on-time pickup, and average revenue per mile.Do you have to make sure that everyone on your team knows about any specific topic I yes, then you should give Dashboard For Tracking Impact Leveraging Logistics Automation Inspiration Pdf a try. Our experts have put a lot of knowledge and effort into creating this impeccable Dashboard For Tracking Impact Leveraging Logistics Automation Inspiration Pdf. You can use this template for your upcoming presentations, as the slides are perfect to represent even the tiniest detail. You can download these templates from the Slidegeeks website and these are easy to edit. So grab these today. This slide covers the dashboard for tracking vehicle efficiency after transport automation. It include KPIs such as truck turnaround time, average revenue per hour, truckload capacity, transit time, on time pickup, and average revenue per mile.
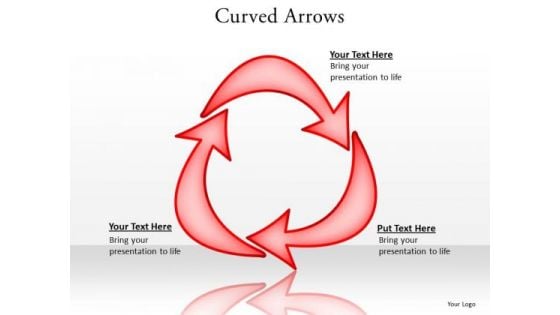
Ppt Curved 3d Arrows PowerPoint Stages Forming Triangle Templates
PPT curved 3d arrows powerpoint stages forming triangle Templates-This PowerPoint Diagram shows three red curved arrows combining together to form a triangle. It is helpful to describe interrelated issues, Approaches or Methods. It imitates alternation, chain, circle, circuit, course, loop, period, periodicity, revolution, rhythm, ring, rotation, round, run, sequel, sequence, series, succession etc.-Can be used for presentations on around, arrow, business, button, chart, circle, collection, color, computer, curve, cycle, direction, down, ecology, element, environment, flowing, green, group, guidance, icon, isolated, leadership, leading, moving, pollution, processing, push, rotate, set, shape, shiny, sign, stick, symbol, triangle, turning, up, variation, waste-PPT curved 3d arrows powerpoint stages forming triangle Templates Establish your place in the chain. Stake your claim with our Ppt Curved 3d Arrows PowerPoint Stages Forming Triangle Templates.
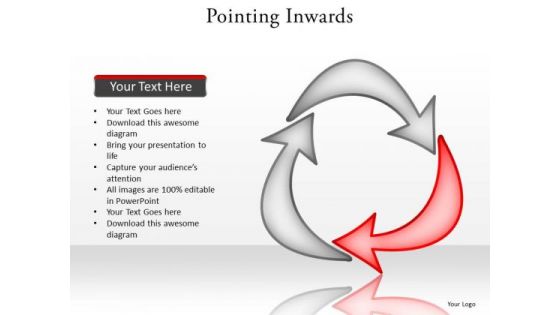
Ppt Curved PowerPoint Graphics Arrows Stage 2 Forming Triangle Templates
PPT curved powerpoint graphics arrows stage 2 forming triangle Templates-This PowerPoint Diagram shows the highlighted red arrow signifying the process is going on. It portrays the concept of bolt, cursor, dart, indicator, missile, pointer, projectile, shaft, achievement, attainment, close, conclusion, consummation, culmination, curtains, dispatch etc.-Can be used for presentations on around, arrow, business, button, chart, circle, collection, color, computer, curve, cycle, direction, down, ecology, element, environment, flowing, green, group, guidance, icon, isolated, leadership, leading, moving, pollution, processing, push, rotate, set, shape, shiny, sign, stick, symbol, triangle, turning, up, variation, waste-PPT curved powerpoint graphics arrows stage 2 forming triangle Templates Back up your boast with our Ppt Curved PowerPoint Graphics Arrows Stage 2 Forming Triangle Templates. Demonstrate to your audience that you can.
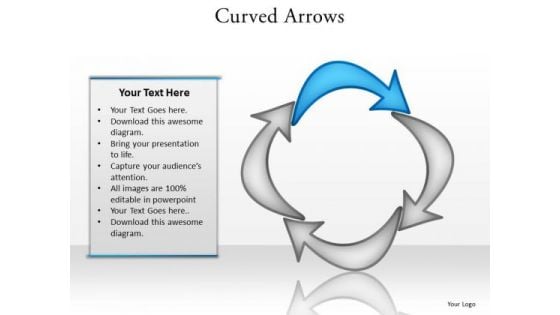
Ppt First Arrow Pointing To Form Square PowerPoint Templates
PPT first arrow Pointing to form square PowerPoint Templates-This PowerPoint Diagram shows the highlighted blue arrow signifying the Beginning of process. It portrays the concept of bring about, bring to pass, cause, commence, create, do, drive, effect, establish, eventuate, found, generate, give impulse, go ahead, go into, impel, inaugurate, induce, initiate, instigate, institute, introduce, launch etc.-Can be used for presentations on around, arrow, business, button, chart, circle, collection, color, computer, curve, cycle, direction, down, ecology, element, environment, flowing, green, group, guidance, icon, isolated, leadership, leading, moving, pollution, processing, push, rotate, set, shape, shiny, sign, stick, symbol, triangle, turning, up, variation, waste-PPT first arrow Pointing to form square PowerPoint Templates Corporate battles can be fierce. Be appropriately armed with our Ppt First Arrow Pointing To Form Square PowerPoint Templates.
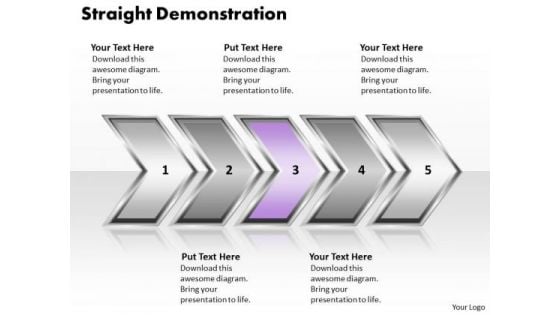
Ppt Straight Demonstration Of Process Using Circular Arrows PowerPoint 2010 Templates
PPT straight demonstration of process using circular arrows powerpoint 2010 Templates-Analyze the six success factors of your business with this linear business chart for Microsoft PowerPoint presentations. This diagram helps you to analyze all the connected ideas and also can be used to show six aspects of an issue. It is a useful captivating tool enables you to define your message in your Marketing PPT presentations. You can apply other 3D Styles and shapes to the slide to enhance your presentations.-PPT straight demonstration of process using circular arrows powerpoint 2010 Templates-Aim, Arrow, Arrowheads, Badge, Border, Click, Connection, Curve, Design, Direction, Download, Element, Fuchsia, Icon, Illustration, Indicator, Internet, Magenta, Mark, Object, Orientation, Pointer, Shadow, Shape, Sign Deliver your address in copybook style. Our Ppt Straight Demonstration Of Process Using Circular Arrows PowerPoint 2010 Templates are the epitome of correctness.
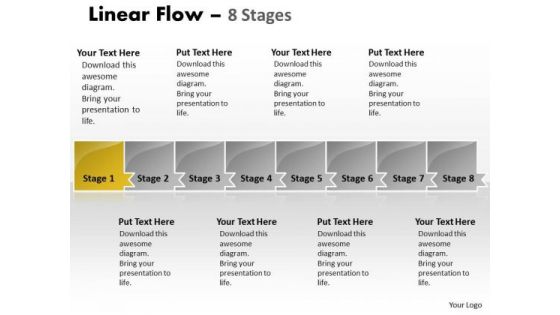
Editable PowerPoint Template Parellel Representation Of 8 Issues Graphic
We present our editable PowerPoint template parellel representation of 8 issues Graphic.Use our Arrows PowerPoint Templates because, they help to lay the base of your trend of thought. Use our Symbol PowerPoint Templates because, Our Template designs are State of the Art. Use our Business PowerPoint Templates because, Business 3D Circular Puzzle: - Your business and plans for its growth consist of processes that are highly co-related. Use our Process and flows PowerPoint Templates because, Now you have to coordinate and motivate your team. Use our Marketing PowerPoint Templates because, However it requires care and diligence to function well. Use these PowerPoint slides for presentations relating to Arrow, background, business, chart, diagram, financial, flow, graphic, gray, icon, management, orange, perspective, process, reflection, spheres, shapes, symbol, and marketing. The prominent colors used in the PowerPoint template are Yellow, Gray, and White Apply your brains in the correct direction. Our Editable PowerPoint Template Parellel Representation Of 8 Issues Graphic will align them accurately.
Process PowerPoint Template Arrow Using 3 Rectangles Business Plan Image
We present our process PowerPoint template arrow using 3 rectangles business plan Image. Use our Symbol PowerPoint Templates because, Brainstorming Light Bulbs:- The atmosphere in the workplace is electric. Use our Metaphor PowerPoint Templates because, Knowledge is power goes the popular saying. Use our Business PowerPoint Templates because, Our Template designs are State of the Art. Use our Arrows PowerPoint Templates because, they help to focus the thoughts of your listeners. Use our Process and Flows PowerPoint Templates because, Ideas roll along in your mind like billiard balls. Use these PowerPoint slides for presentations relating to Arrow, Background, Business, Chart, Diagram, Financial, Graphic, Gray, Icon, Illustration, Management, Orange, Perspective, Process, Reflection, Stage, Text, Transparency. The prominent colors used in the PowerPoint template are Red, Gray, and Black Our Process PowerPoint Template Arrow Using 3 Rectangles Business Plan Image direct the applause to you. Get the credit you definitely deserve.
Dashboard For Tracking Employee Satisfaction Rate Detailed Personnel Slides Pdf
This slide covers KPI dashboard to measure employee satisfaction due to effective internal communication. It includes indicators such as net promoter score, retention rate, absenteeism etc. This Dashboard For Tracking Employee Satisfaction Rate Detailed Personnel Slides Pdf is perfect for any presentation, be it in front of clients or colleagues. It is a versatile and stylish solution for organizing your meetings. The Dashboard For Tracking Employee Satisfaction Rate Detailed Personnel Slides Pdf features a modern design for your presentation meetings. The adjustable and customizable slides provide unlimited possibilities for acing up your presentation. Slidegeeks has done all the homework before launching the product for you. So, do not wait, grab the presentation templates today This slide covers KPI dashboard to measure employee satisfaction due to effective internal communication. It includes indicators such as net promoter score, retention rate, absenteeism etc.
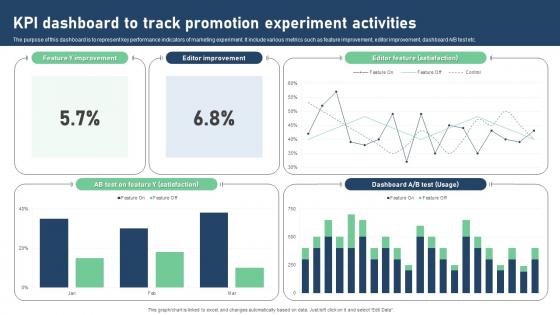
Kpi Dashboard To Track Promotion Experiment Activities Portrait Pdf
The purpose of this dashboard is to represent key performance indicators of marketing experiment. It include various metrics such as feature improvement, editor improvement, dashboard A or B test etc. Pitch your topic with ease and precision using this Kpi Dashboard To Track Promotion Experiment Activities Portrait Pdf. This layout presents information on KPI Dashboard, Track Promotion, Experiment Activities, Editor Improvement. It is also available for immediate download and adjustment. So, changes can be made in the color, design, graphics or any other component to create a unique layout. The purpose of this dashboard is to represent key performance indicators of marketing experiment. It include various metrics such as feature improvement, editor improvement, dashboard A or B test etc.
Cryptocurrency Portfolio Tracking Dashboard Summary Cryptocurrency Management With Blockchain
This slide represents the cryptocurrency performance indicators for the individual. The key components include invested money, profit and loss, rate of investment ROI, current valuation of money, etc.Formulating a presentation can take up a lot of effort and time, so the content and message should always be the primary focus. The visuals of the PowerPoint can enhance the presenters message, so our Cryptocurrency Portfolio Tracking Dashboard Summary Cryptocurrency Management With Blockchain was created to help save time. Instead of worrying about the design, the presenter can concentrate on the message while our designers work on creating the ideal templates for whatever situation is needed. Slidegeeks has experts for everything from amazing designs to valuable content, we have put everything into Cryptocurrency Portfolio Tracking Dashboard Summary Cryptocurrency Management With Blockchain. This slide represents the cryptocurrency performance indicators for the individual. The key components include invested money, profit and loss, rate of investment ROI, current valuation of money, etc.
Web Access Control Solution Secure Web Gateway Performance Tracking Dashboard
This slide represents a dashboard to maintain the record of various functions of Secure Web Gateway. The main components are top blocked web malware, web usage trend, top web application categories, risky web isolations, etc. Get a simple yet stunning designed Web Access Control Solution Secure Web Gateway Performance Tracking Dashboard. It is the best one to establish the tone in your meetings. It is an excellent way to make your presentations highly effective. So, download this PPT today from Slidegeeks and see the positive impacts. Our easy-to-edit Web Access Control Solution Secure Web Gateway Performance Tracking Dashboard can be your go-to option for all upcoming conferences and meetings. So, what are you waiting for Grab this template today. This slide represents a dashboard to maintain the record of various functions of Secure Web Gateway. The main components are top blocked web malware, web usage trend, top web application categories, risky web isolations, etc.
Confidential Computing Performance Tracking Dashboard Secure Multi Party Portrait Pdf
This slide represents the performance tracking dashboard for confidential computing. The purpose of this slide is to represent the overall performance of the confidential computing cloud environment visually. The main components include overall health, operations, progress, time, cost and workloads. Coming up with a presentation necessitates that the majority of the effort goes into the content and the message you intend to convey. The visuals of a PowerPoint presentation can only be effective if it supplements and supports the story that is being told. Keeping this in mind our experts created Confidential Computing Performance Tracking Dashboard Secure Multi Party Portrait Pdf to reduce the time that goes into designing the presentation. This way, you can concentrate on the message while our designers take care of providing you with the right template for the situation. This slide represents the performance tracking dashboard for confidential computing. The purpose of this slide is to represent the overall performance of the confidential computing cloud environment visually. The main components include overall health, operations, progress, time, cost and workloads.
Tracking First Response Time Improving Customer Retention PPT Presentation
The following slide depicts key performance indicators to review call resolution time and offer real time support. It also includes elements such as unsolved calls, weekly response time analysis, best day to call etc. Presenting this PowerPoint presentation, titled Tracking First Response Time Improving Customer Retention PPT Presentation, with topics curated by our researchers after extensive research. This editable presentation is available for immediate download and provides attractive features when used. Download now and captivate your audience. Presenting this Tracking First Response Time Improving Customer Retention PPT Presentation. Our researchers have carefully researched and created these slides with all aspects taken into consideration. This is a completely customizable Tracking First Response Time Improving Customer Retention PPT Presentation that is available for immediate downloading. Download now and make an impact on your audience. Highlight the attractive features available with our PPTs. The following slide depicts key performance indicators to review call resolution time and offer real time support. It also includes elements such as unsolved calls, weekly response time analysis, best day to call etc.
Tracking First Response Time Enhancing Customer Experience Ppt Presentation
The following slide depicts key performance indicators to review call resolution time and offer real time support. It also includes elements such as unsolved calls, weekly response time analysis, best day to call etc. Presenting this PowerPoint presentation, titled Tracking First Response Time Enhancing Customer Experience Ppt Presentation, with topics curated by our researchers after extensive research. This editable presentation is available for immediate download and provides attractive features when used. Download now and captivate your audience. Presenting this Tracking First Response Time Enhancing Customer Experience Ppt Presentation. Our researchers have carefully researched and created these slides with all aspects taken into consideration. This is a completely customizable Tracking First Response Time Enhancing Customer Experience Ppt Presentation that is available for immediate downloading. Download now and make an impact on your audience. Highlight the attractive features available with our PPTs. The following slide depicts key performance indicators to review call resolution time and offer real time support. It also includes elements such as unsolved calls, weekly response time analysis, best day to call etc.
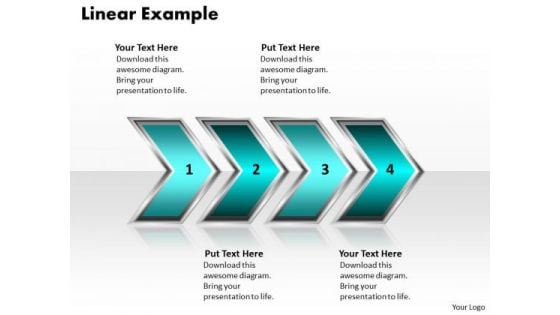
Ppt Linear Example Of Process Using 4 Stages PowerPoint Templates
PPT linear example of process using 4 stages PowerPoint Templates-This PowerPoint Diagram shows you the 3d Sequential Demonstration to explain Internet Marketing. It consists of Seven Layers explaining fourth here. Use this diagram as a method of graphically representing the flow of data as an information processing system. This is a good resource also for Marketing PowerPoint Diagrams or Business Backgrounds for PowerPoint or business presentation PowerPoint Diagram to master your strategic thinking.-PPT linear example of process using 4 stages PowerPoint Templates-Aim, Arrow, Arrowheads, Badge, Border, Click, Connection, Curve, Design, Direction, Download, Element, Fuchsia, Icon, Illustration, Indicator, Internet, Magenta, Mark, Object, Orientation, Pointer, Shadow, Shape, Sign List your strategy succinctly with our Ppt Linear Example Of Process Using 4 Stages PowerPoint Templates. You will be at the top of your game.
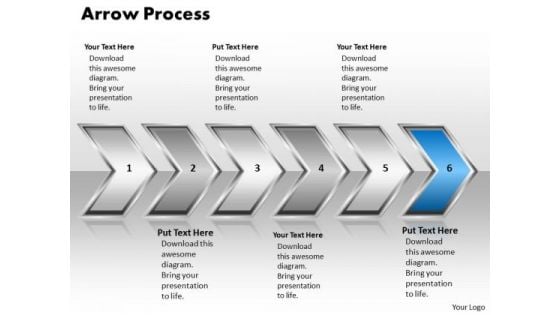
Ppt Pointing Even Arrow Forging Process PowerPoint Slides 6 Stage Templates
PPT pointing even arrow forging process powerpoint slides 6 stage Templates-Use this Arrow based PowerPoint Diagram to elaborate six interconnected issues which performs their actions in cycle. This diagram provides an overview of the interactions of different factors in a company. You can easily collaborate this PowerPoint diagram with colleagues to create detailed process diagrams and use them as a key element in streamlining your processes. -PPT pointing even arrow forging process powerpoint slides 6 stage Templates-Aim, Arrow, Arrowheads, Badge, Border, Click, Connection, Curve, Design, Direction, Download, Element, Fuchsia, Icon, Illustration, Indicator, Internet, Magenta, Mark, Object, Orientation, Pointer, Shadow, Shape, Sign Our Ppt Pointing Even Arrow Forging Process PowerPoint Slides 6 Stage Templates have a far reaching effect. Your ideas will bring cheer to many.
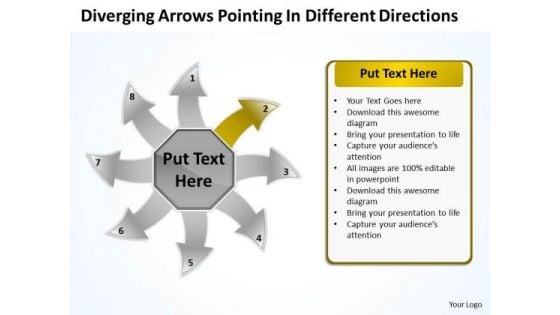
Diverging Arrows Pointing Different Directions Charts And Diagrams PowerPoint Templates
We present our diverging arrows pointing different directions Charts and Diagrams PowerPoint templates.Present our Communication PowerPoint Templates because you can expound on how you plan to gain their confidence and assure them of continued and consistent excellence in quality of service. Present our Arrows PowerPoint Templates because they are Gauranteed to focus the minds of your team. Download our Circle Charts PowerPoint Templates because the ideas and plans are on your finger tips. Download our Business PowerPoint Templates because it helps you to explain your plans in all earnest to your colleagues and raise the bar for all. Use our Shapes PowerPoint Templates because you can illustrate your ideas and imprint them in the minds of your team with this template.Use these PowerPoint slides for presentations relating to Arrow, Bio, Business, Chart, Circle, Concept, Control, Cycle, Design, Development, Diagram, Eco, Ecology, Environmental, Evaluate, Flow, Flowchart, Fresh, Graphic, Green, Idea, Infographic, Iterative, Life, Lifecycle, Management, Method, Model, Natural, Nature, Organic, Process, Quality, Recycle, Research, Schema, Spiral, Step, Strategy, Success, System. The prominent colors used in the PowerPoint template are Yellow, Gray, White. Customers tell us our diverging arrows pointing different directions Charts and Diagrams PowerPoint templates are second to none. Customers tell us our Cycle PowerPoint templates and PPT Slides are Quaint. Presenters tell us our diverging arrows pointing different directions Charts and Diagrams PowerPoint templates are designed by a team of presentation professionals. PowerPoint presentation experts tell us our Control PowerPoint templates and PPT Slides are Reminiscent. Customers tell us our diverging arrows pointing different directions Charts and Diagrams PowerPoint templates are Pleasant. Professionals tell us our Control PowerPoint templates and PPT Slides are Ritzy. Command teams with our Diverging Arrows Pointing Different Directions Charts And Diagrams PowerPoint Templates. Download without worries with our money back guaranteee.
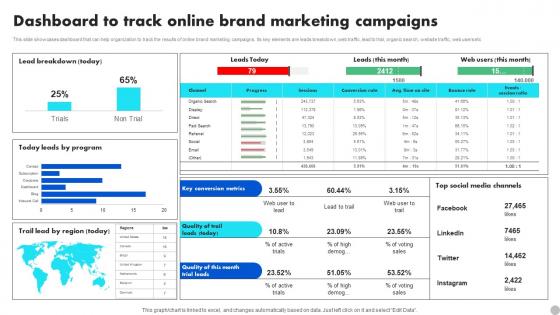
Dashboard To Track Online Brand Marketing Campaigns Brand Diversification Approach Information Pdf
This slide showcases dashboard that can help organization to track the results of online brand marketing campaigns. Its key elements are leads breakdown,web traffic, lead to trial, organic search, website traffic, web users etc. If you are looking for a format to display your unique thoughts, then the professionally designed Dashboard To Track Online Brand Marketing Campaigns Brand Diversification Approach Information Pdf is the one for you. You can use it as a Google Slides template or a PowerPoint template. Incorporate impressive visuals, symbols, images, and other charts. Modify or reorganize the text boxes as you desire. Experiment with shade schemes and font pairings. Alter, share or cooperate with other people on your work. Download Dashboard To Track Online Brand Marketing Campaigns Brand Diversification Approach Information Pdf and find out how to give a successful presentation. Present a perfect display to your team and make your presentation unforgettable. This slide showcases dashboard that can help organization to track the results of online brand marketing campaigns. Its key elements are leads breakdown,web traffic, lead to trial, organic search, website traffic, web users etc.
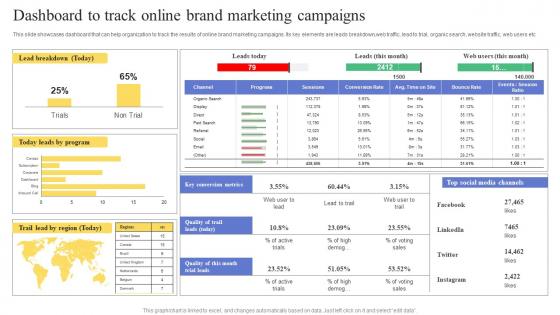
Dashboard To Track Online Brand Marketing Campaigns Maximizing Revenue Using Elements Pdf
This slide showcases dashboard that can help organization to track the results of online brand marketing campaigns. Its key elements are leads breakdown,web traffic, lead to trial, organic search, website traffic, web users etc. If you are looking for a format to display your unique thoughts, then the professionally designed Dashboard To Track Online Brand Marketing Campaigns Maximizing Revenue Using Elements Pdf is the one for you. You can use it as a Google Slides template or a PowerPoint template. Incorporate impressive visuals, symbols, images, and other charts. Modify or reorganize the text boxes as you desire. Experiment with shade schemes and font pairings. Alter, share or cooperate with other people on your work. Download Dashboard To Track Online Brand Marketing Campaigns Maximizing Revenue Using Elements Pdf and find out how to give a successful presentation. Present a perfect display to your team and make your presentation unforgettable. This slide showcases dashboard that can help organization to track the results of online brand marketing campaigns. Its key elements are leads breakdown,web traffic, lead to trial, organic search, website traffic, web users etc.
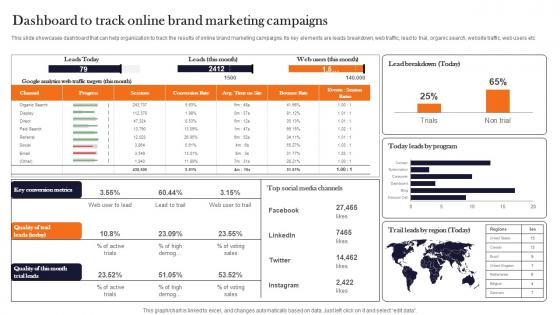
Dashboard To Track Online Brand Marketing Product Advertising And Positioning Graphics Pdf
This slide showcases dashboard that can help organization to track the results of online brand marketing campaigns. Its key elements are leads breakdown, web traffic, lead to trial, organic search, website traffic, web users etc. If you are looking for a format to display your unique thoughts, then the professionally designed Dashboard To Track Online Brand Marketing Product Advertising And Positioning Graphics Pdf is the one for you. You can use it as a Google Slides template or a PowerPoint template. Incorporate impressive visuals, symbols, images, and other charts. Modify or reorganize the text boxes as you desire. Experiment with shade schemes and font pairings. Alter, share or cooperate with other people on your work. Download Dashboard To Track Online Brand Marketing Product Advertising And Positioning Graphics Pdf and find out how to give a successful presentation. Present a perfect display to your team and make your presentation unforgettable. This slide showcases dashboard that can help organization to track the results of online brand marketing campaigns. Its key elements are leads breakdown, web traffic, lead to trial, organic search, website traffic, web users etc.
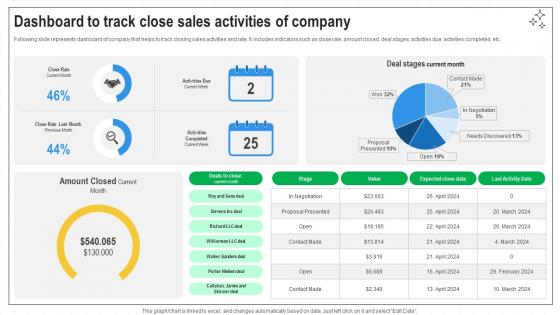
Closing Techniques To Seal Dashboard To Track Close Sales Activities Of Company SA SS V
Following slide represents dashboard of company that helps to track closing sales activities and rate. It includes indicators such as close rate, amount closed, deal stages, activities due, activities completed, etc. If you are looking for a format to display your unique thoughts, then the professionally designed Closing Techniques To Seal Dashboard To Track Close Sales Activities Of Company SA SS V is the one for you. You can use it as a Google Slides template or a PowerPoint template. Incorporate impressive visuals, symbols, images, and other charts. Modify or reorganize the text boxes as you desire. Experiment with shade schemes and font pairings. Alter, share or cooperate with other people on your work. Download Closing Techniques To Seal Dashboard To Track Close Sales Activities Of Company SA SS V and find out how to give a successful presentation. Present a perfect display to your team and make your presentation unforgettable. Following slide represents dashboard of company that helps to track closing sales activities and rate. It includes indicators such as close rate, amount closed, deal stages, activities due, activities completed, etc.
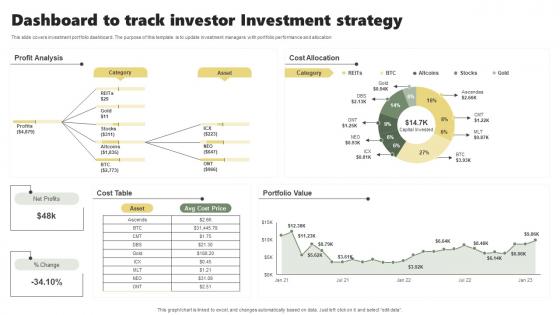
Dashboard To Track Investor Investment Strategy Sample Pdf
This slide covers investment portfolio dashboard. The purpose of this template is to update investment managers with portfolio performance and allocation Showcasing this set of slides titled Dashboard To Track Investor Investment Strategy Sample Pdf. The topics addressed in these templates are Cost Table, Portfolio Value, Cost Allocation. All the content presented in this PPT design is completely editable. Download it and make adjustments in color, background, font etc. as per your unique business setting. This slide covers investment portfolio dashboard. The purpose of this template is to update investment managers with portfolio performance and allocation
Tracking Employee Performance With Various KPI Graphics Pdf
Following slide shows monitoring employee performance using different which assist in opportunity for improvement in overall development . It includes KPI such as optimum utilization, duration , etc. Showcasing this set of slides titled Tracking Employee Performance With Various KPI Graphics Pdf The topics addressed in these templates are Optimum Utilization, Duration, Billing All the content presented in this PPT design is completely editable. Download it and make adjustments in color, background, font etc. as per your unique business setting. Following slide shows monitoring employee performance using different which assist in opportunity for improvement in overall development . It includes KPI such as optimum utilization, duration , etc.
Secure Web Gateway Performance Tracking Dashboard Web Threat Protection System
Want to ace your presentation in front of a live audience Our Secure Web Gateway Performance Tracking Dashboard Web Threat Protection System can help you do that by engaging all the users towards you. Slidegeeks experts have put their efforts and expertise into creating these impeccable powerpoint presentations so that you can communicate your ideas clearly. Moreover, all the templates are customizable, and easy-to-edit and downloadable. Use these for both personal and commercial use. This slide represents a dashboard to maintain the record of various functions of Secure Web Gateway. The main components are top blocked web malware, web usage trend, top web application categories, risky web
A136 Vendor Management Audit KPI Dashboard For Tracking Supplier Compliance
Mentioned slide demonstrates KPI dashboard for evaluating supplier compliance and performance. It includes key components such as total suppliers, contracts, unlisted, contact compliance rate. Find a pre-designed and impeccable A136 Vendor Management Audit KPI Dashboard For Tracking Supplier Compliance. The templates can ace your presentation without additional effort. You can download these easy-to-edit presentation templates to make your presentation stand out from others. So, what are you waiting for Download the template from Slidegeeks today and give a unique touch to your presentation. Mentioned slide demonstrates KPI dashboard for evaluating supplier compliance and performance. It includes key components such as total suppliers, contracts, unlisted, contact compliance rate.
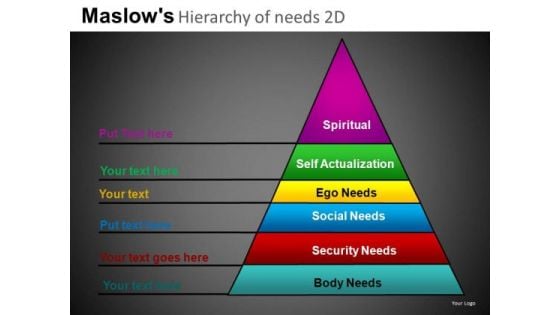
Maslows Hierarchy Of Needs PowerPoint Presentation Slides
Maslows Hierarchy Of Needs PowerPoint Presentation Slides-These high quality powerpoint pre-designed slides and powerpoint templates have been carefully created by our professional team to help you impress your audience. All slides have been created and are 100% editable in powerpoint. Each and every property of any graphic - color, size, orientation, shading, outline etc. can be modified to help you build an effective powerpoint presentation. Any text can be entered at any point in the powerpoint template or slide. Simply DOWNLOAD, TYPE and PRESENT!-These PowerPoint slides can be used for themes relating to--Abstract, action, business, clipart, commerce, concept, conceptual, corporate, department, design, diagram, direction, functional, goals, guide, guidelines, heirarchy, hierarchy, icon, illustration, manage, management, mba, mission, model, organization, performance, plans, process, pyramid, representation, resource, strategy, tactics, theoretical, theory, tool, unit, vision Break throughthe fence with our Maslows Hierarchy Of Needs PowerPoint Presentation Slides. Your ideas will bring down all barriers.
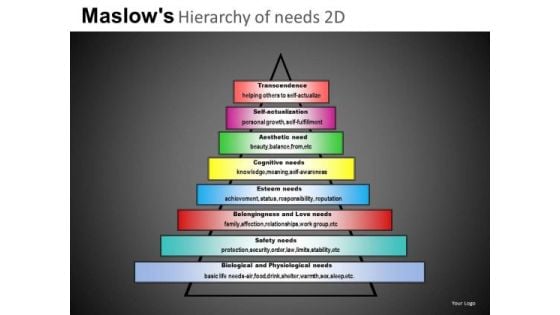
Maslows Needs Pyramid PowerPoint Templates Ppt Slides
Maslows Needs Pyramid PowerPoint templates PPT Slides-These high quality powerpoint pre-designed slides and powerpoint templates have been carefully created by our professional team to help you impress your audience. All slides have been created and are 100% editable in powerpoint. Each and every property of any graphic - color, size, orientation, shading, outline etc. can be modified to help you build an effective powerpoint presentation. Any text can be entered at any point in the powerpoint template or slide. Simply DOWNLOAD, TYPE and PRESENT!-These PowerPoint slides can be used for themes relating to--Abstract, action, business, clipart, commerce, concept, conceptual, corporate, department, design, diagram, direction, functional, goals, guide, guidelines, heirarchy, hierarchy, icon, illustration, manage, management, mba, mission, model, organization, performance, plans, process, pyramid, representation, resource, strategy, tactics, theoretical, theory, tool, unit, vision Cut the cloth with our Maslows Needs Pyramid PowerPoint Templates Ppt Slides. Make your thoughts the fashion of the day.
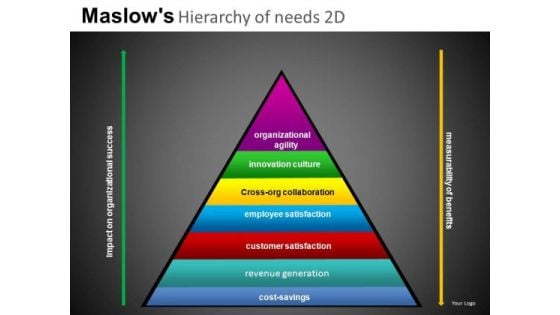
Pyramid Structure PowerPoint Templates Editable PowerPoint Pyramids
Pyramid Structure PowerPoint templates Editable PowerPoint Pyramids-These high quality powerpoint pre-designed slides and powerpoint templates have been carefully created by our professional team to help you impress your audience. All slides have been created and are 100% editable in powerpoint. Each and every property of any graphic - color, size, orientation, shading, outline etc. can be modified to help you build an effective powerpoint presentation. Any text can be entered at any point in the powerpoint template or slide. Simply DOWNLOAD, TYPE and PRESENT!-These PowerPoint slides can be used for themes relating to--Abstract, action, business, clipart, commerce, concept, conceptual, corporate, department, design, diagram, direction, functional, goals, guide, guidelines, heirarchy, hierarchy, icon, illustration, manage, management, mba, mission, model, organization, performance, plans, process, pyramid, representation, resource, strategy, tactics, theoretical, theory, tool, unit, vision Convincing others can be an exacting business. Address their doubts with our Pyramid Structure PowerPoint Templates Editable PowerPoint Pyramids.
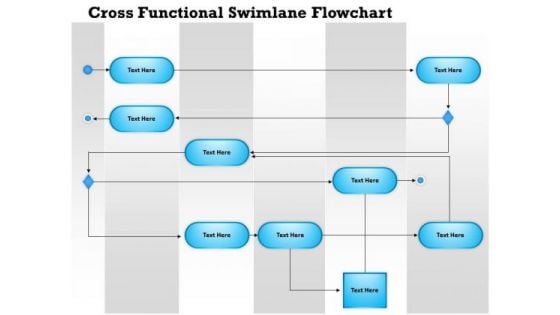
Business Diagram Cross Functional Swimlane Flowchart Presentation Template
This image slide displays cross functional swim lane flow chart. This image slide consists of flow chart on stripped background. Use this PowerPoint template, in your presentations to express various business views. This image slide will help you reach the target audience.
Dashboard For Tracking Post Expansion Enhancing Global Presence Graphics Pdf
This slide covers the dashboard for analyzing fast food business sales by location. It includes KPIs such as the companys revenue by location, by type, top 5 expenses by account, top 5 expenses by department, cost of revenue year to date, etc.Find highly impressive Dashboard For Tracking Post Expansion Enhancing Global Presence Graphics Pdf on Slidegeeks to deliver a meaningful presentation. You can save an ample amount of time using these presentation templates. No need to worry to prepare everything from scratch because Slidegeeks experts have already done a huge research and work for you. You need to download Dashboard For Tracking Post Expansion Enhancing Global Presence Graphics Pdf for your upcoming presentation. All the presentation templates are 100Precent editable and you can change the color and personalize the content accordingly. Download now. This slide covers the dashboard for analyzing fast food business sales by location. It includes KPIs such as the companys revenue by location, by type, top 5 expenses by account, top 5 expenses by department, cost of revenue year to date, etc.
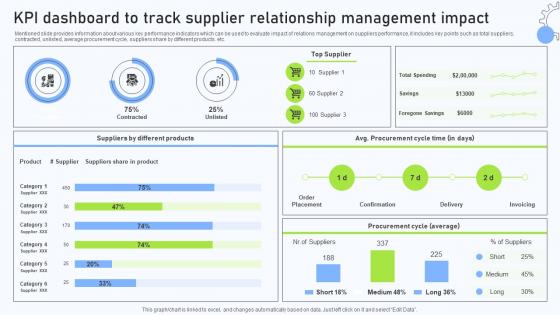
Relationship Management Automation KPI Dashboard To Track Supplier Relationship
Mentioned slide provides information about various key performance indicators which can be used to evaluate impact of relations management on suppliers performance, it includes key points such as total suppliers, contracted, unlisted, average procurement cycle, suppliers share by different products. etc. This Relationship Management Automation KPI Dashboard To Track Supplier Relationship is perfect for any presentation, be it in front of clients or colleagues. It is a versatile and stylish solution for organizing your meetings. The Relationship Management Automation KPI Dashboard To Track Supplier Relationship features a modern design for your presentation meetings. The adjustable and customizable slides provide unlimited possibilities for acing up your presentation. Slidegeeks has done all the homework before launching the product for you. So, do not wait, grab the presentation templates today Mentioned slide provides information about various key performance indicators which can be used to evaluate impact of relations management on suppliers performance, it includes key points such as total suppliers, contracted, unlisted, average procurement cycle, suppliers share by different products. etc.
Ppt Regular Flow Of 3 Steps Working With Slide Numbers Circular Arrow PowerPoint Templates
PPT regular flow of 3 steps working with slide numbers circular arrow PowerPoint Templates-Our compelling Diagram consists of a design of Circular Arrows representing three different views on the Similar Issue. You can also add goals to the timeline project and milestones using this Diagram. This is a basic project timeline that comes with a dark PowerPoint Diagram background.-PPT regular flow of 3 steps working with slide numbers circular arrow PowerPoint Templates-3d, Abstract, Advertisement, Aim, Arrow, Business, Circular, Cursor, Direction, Down, Environment, Form, Glossy, Graphic, Icon, Illustration, Information, Mark, Motion, Perspective, Point, Sale, Shadow, Shape, Shiny, Sign Dont let anybody mess up your presentation. Use our professional slides to win with our Ppt Regular Flow Of 3 Steps Working With Slide Numbers Circular Arrow PowerPoint Templates. You will be at the top of your game.
Smart Attendance Tracking Systems Dashboard Impact Of IoT Technology On Education IoT SS V
Following slide highlights dashboard to monitor and track student attendance by using Io enabled asset tracking devices. It includes indicators such as overtime, statistics, source, exceptions, pending requests, etc. Want to ace your presentation in front of a live audience Our Smart Attendance Tracking Systems Dashboard Impact Of IoT Technology On Education IoT SS V can help you do that by engaging all the users towards you. Slidegeeks experts have put their efforts and expertise into creating these impeccable powerpoint presentations so that you can communicate your ideas clearly. Moreover, all the templates are customizable, and easy-to-edit and downloadable. Use these for both personal and commercial use. Following slide highlights dashboard to monitor and track student attendance by using Io enabled asset tracking devices. It includes indicators such as overtime, statistics, source, exceptions, pending requests, etc.
Ultimate Guide To Cold Calling Sources Tracking Kpi Dashboard SA SS V
This slide outlines a call-tracking dashboard that helps marketers to track call quality, encompassing volume of calls, top call sources, total calls, etc. Do you have an important presentation coming up Are you looking for something that will make your presentation stand out from the rest Look no further than Ultimate Guide To Cold Calling Sources Tracking Kpi Dashboard SA SS V. With our professional designs, you can trust that your presentation will pop and make delivering it a smooth process. And with Slidegeeks, you can trust that your presentation will be unique and memorable. So why wait Grab Ultimate Guide To Cold Calling Sources Tracking Kpi Dashboard SA SS V today and make your presentation stand out from the rest This slide outlines a call-tracking dashboard that helps marketers to track call quality, encompassing volume of calls, top call sources, total calls, etc.
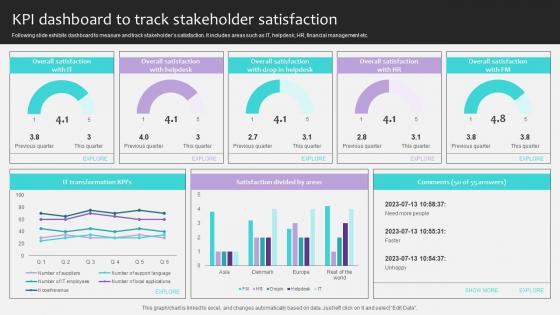
Project Stakeholders Management KPI Dashboard To Track Stakeholder Satisfaction Ppt Powerpoint
Following slide exhibits dashboard to measure and track stakeholders satisfaction. It includes areas such as IT, helpdesk, HR, financial management etc. Presenting this PowerPoint presentation, titled Project Stakeholders Management KPI Dashboard To Track Stakeholder Satisfaction Ppt Powerpoint, with topics curated by our researchers after extensive research. This editable presentation is available for immediate download and provides attractive features when used. Download now and captivate your audience. Presenting this Project Stakeholders Management KPI Dashboard To Track Stakeholder Satisfaction Ppt Powerpoint. Our researchers have carefully researched and created these slides with all aspects taken into consideration. This is a completely customizable Project Stakeholders Management KPI Dashboard To Track Stakeholder Satisfaction Ppt Powerpoint that is available for immediate downloading. Download now and make an impact on your audience. Highlight the attractive features available with our PPTs. Following slide exhibits dashboard to measure and track stakeholders satisfaction. It includes areas such as IT, helpdesk, HR, financial management etc.
Statistics For Tracking Policy Administration Activities Brochure Pdf
Following slide showcases statistics highlighting policy management activities by priority percentage which can be used by businesses to enhance organisation performance. It includes activities such as policy communication, compliance training, risk assessment, third party due diligence, etc. Pitch your topic with ease and precision using this Statistics For Tracking Policy Administration Activities Brochure Pdf. This layout presents information on Policy Communication, Compliance Training, Risk Assessment. It is also available for immediate download and adjustment. So, changes can be made in the color, design, graphics or any other component to create a unique layout. Following slide showcases statistics highlighting policy management activities by priority percentage which can be used by businesses to enhance organisation performance. It includes activities such as policy communication, compliance training, risk assessment, third party due diligence, etc.
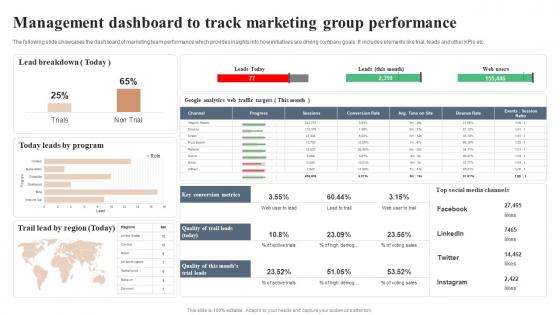
Management Dashboard To Track Marketing Group Performance Formats Pdf
The following slide showcases the dashboard of marketing team performance which provides insights into how initiatives are driving company goals. It includes elements like trial, leads and other KPIs etc. Showcasing this set of slides titled Management Dashboard To Track Marketing Group Performance Formats Pdf. The topics addressed in these templates are Lead Breakdown, Leads By Program, Lead By Region. All the content presented in this PPT design is completely editable. Download it and make adjustments in color, background, font etc. as per your unique business setting. The following slide showcases the dashboard of marketing team performance which provides insights into how initiatives are driving company goals. It includes elements like trial, leads and other KPIs etc.
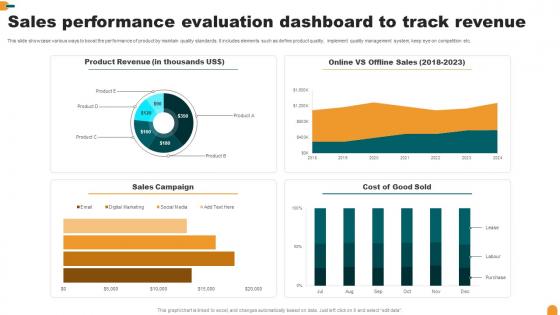
Sales Performance Evaluation Dashboard To Track Revenue Summary Pdf
This slide showcase various ways to boost the performance of product by maintain quality standards. It includes elements such as define product quality, implement quality management system, keep eye on competition etc.Pitch your topic with ease and precision using this Sales Performance Evaluation Dashboard To Track Revenue Summary Pdf This layout presents information on Sales Campaign, Product Revenue, Cost Good Sold It is also available for immediate download and adjustment. So, changes can be made in the color, design, graphics or any other component to create a unique layout. This slide showcase various ways to boost the performance of product by maintain quality standards. It includes elements such as define product quality, implement quality management system, keep eye on competition etc.
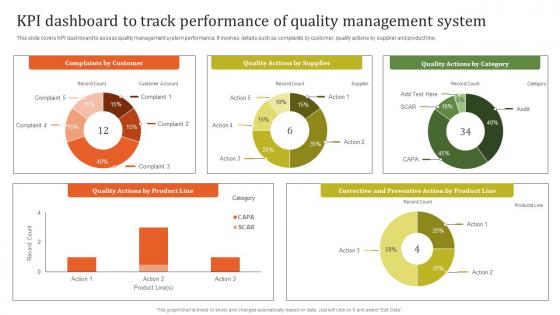
KPI Dashboard To Track Executing Effective Quality Enhancement Slides Pdf
This slide covers KPI dashboard to assess quality management system performance. It involves details such as complaints by customer, quality actions by supplier and product line. Slidegeeks is one of the best resources for PowerPoint templates. You can download easily and regulate KPI Dashboard To Track Executing Effective Quality Enhancement Slides Pdf for your personal presentations from our wonderful collection. A few clicks is all it takes to discover and get the most relevant and appropriate templates. Use our Templates to add a unique zing and appeal to your presentation and meetings. All the slides are easy to edit and you can use them even for advertisement purposes. This slide covers KPI dashboard to assess quality management system performance. It involves details such as complaints by customer, quality actions by supplier and product line.
KPI Dashboard Tracking Major Promotional Analytics Future Trends Rules Pdf
This slide covers the dashboard for analysing paid search metrics such as ad cost, clicks, impressions, click through rate, cost per conversion, conversion rate, cost per click, etc. The KPI Dashboard Tracking Major Promotional Analytics Future Trends Rules Pdf is a compilation of the most recent design trends as a series of slides. It is suitable for any subject or industry presentation, containing attractive visuals and photo spots for businesses to clearly express their messages. This template contains a variety of slides for the user to input data, such as structures to contrast two elements, bullet points, and slides for written information. Slidegeeks is prepared to create an impression. This slide covers the dashboard for analysing paid search metrics such as ad cost, clicks, impressions, click through rate, cost per conversion, conversion rate, cost per click, etc.
Enhancing Global Presence Dashboard For Tracking Post Expansion Formats Pdf
This slide covers the dashboard for analyzing fast food business sales by region. It includes KPIs such as sales, sales target, target achievement, gross profit, gross profit margin, sales by channels, sales growth, etc.If your project calls for a presentation, then Slidegeeks is your go-to partner because we have professionally designed, easy-to-edit templates that are perfect for any presentation. After downloading, you can easily edit Enhancing Global Presence Dashboard For Tracking Post Expansion Formats Pdf and make the changes accordingly. You can rearrange slides or fill them with different images. Check out all the handy templates This slide covers the dashboard for analyzing fast food business sales by region. It includes KPIs such as sales, sales target, target achievement, gross profit, gross profit margin, sales by channels, sales growth, etc.

 Home
Home