Road Icon
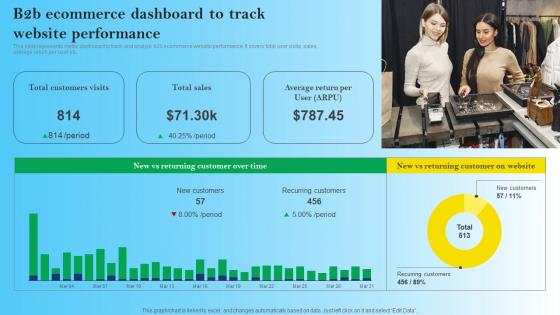
B2B Ecommerce Dashboard To Track Website Performance B2B Digital Commerce Infographics Pdf
This slide represents metric dashboard to track and analyze b2b ecommerce website performance. It covers total user visits, sales, average return per user etc. The B2B Ecommerce Dashboard To Track Website Performance B2B Digital Commerce Infographics Pdf is a compilation of the most recent design trends as a series of slides. It is suitable for any subject or industry presentation, containing attractive visuals and photo spots for businesses to clearly express their messages. This template contains a variety of slides for the user to input data, such as structures to contrast two elements, bullet points, and slides for written information. Slidegeeks is prepared to create an impression. This slide represents metric dashboard to track and analyze b2b ecommerce website performance. It covers total user visits, sales, average return per user etc.
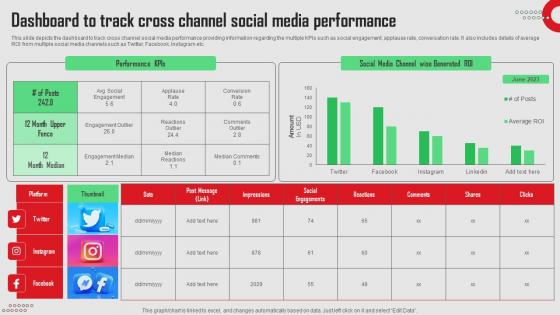
Dashboard To Track Cross Channel Social Media Platforms Performance Inspiration Pdf
This slide depicts the dashboard to track cross channel social media performance providing information regarding the multiple KPIs such as social engagement, applause rate, conversation rate. It also includes details of average ROI from multiple social media channels such as Twitter, Facebook, Instagram etc.There are so many reasons you need a Dashboard To Track Cross Channel Social Media Platforms Performance Inspiration Pdf. The first reason is you can not spend time making everything from scratch, Thus, Slidegeeks has made presentation templates for you too. You can easily download these templates from our website easily. This slide depicts the dashboard to track cross channel social media performance providing information regarding the multiple KPIs such as social engagement, applause rate, conversation rate. It also includes details of average ROI from multiple social media channels such as Twitter, Facebook, Instagram etc.
Tracking The Actual Sales Figures Business Sales Enhancement Campaign Mockup Pdf
This slide provides glimpse about dashboard analysis that can help the business to track the performance of the sales team. It includes KPIs such as revenues, profit, orders placed, conversion placed, conversion rate, customers, etc. Boost your pitch with our creative Tracking The Actual Sales Figures Business Sales Enhancement Campaign Mockup Pdf. Deliver an awe inspiring pitch that will mesmerize everyone. Using these presentation templates you will surely catch everyones attention. You can browse the ppts collection on our website. We have researchers who are experts at creating the right content for the templates. So you do not have to invest time in any additional work. Just grab the template now and use them. This slide provides glimpse about dashboard analysis that can help the business to track the performance of the sales team. It includes KPIs such as revenues, profit, orders placed, conversion placed, conversion rate, customers, etc.
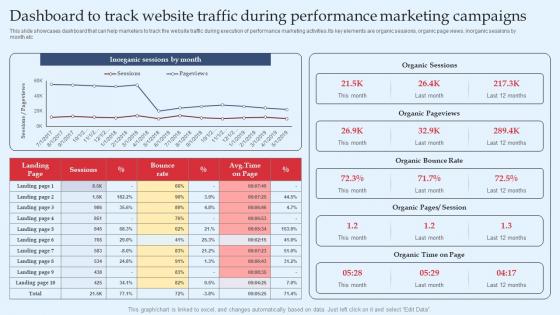
Strategic Performance Marketing Campaign Dashboard To Track Website Traffic During Clipart Pdf
This slide showcases dashboard that can help marketers to track the website traffic during execution of performance marketing activities.Its key elements are organic sessions, organic page views, inorganic sessions by month etc. Make sure to capture your audiences attention in your business displays with our gratis customizable Strategic Performance Marketing Campaign Dashboard To Track Website Traffic During Clipart Pdf. These are great for business strategies, office conferences, capital raising or task suggestions. If you desire to acquire more customers for your tech business and ensure they stay satisfied, create your own sales presentation with these plain slides. This slide showcases dashboard that can help marketers to track the website traffic during execution of performance marketing activities.Its key elements are organic sessions, organic page views, inorganic sessions by month etc.
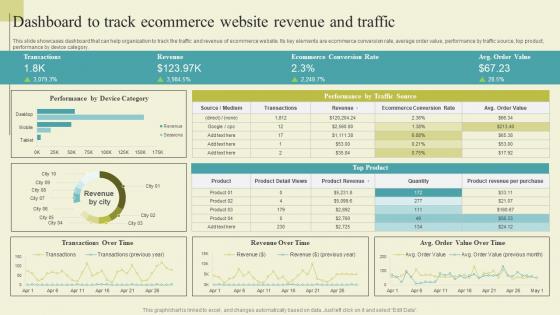
Dashboard To Track Ecommerce Website Revenue Successful Guide For Ecommerce Background Pdf
This slide showcases dashboard that can help organization to track the traffic and revenue of ecommerce website. Its key elements are ecommerce conversion rate, average order value, performance by traffic source, top product, performance by device category. Boost your pitch with our creative Dashboard To Track Ecommerce Website Revenue Successful Guide For Ecommerce Background Pdf. Deliver an awe-inspiring pitch that will mesmerize everyone. Using these presentation templates you will surely catch everyones attention. You can browse the ppts collection on our website. We have researchers who are experts at creating the right content for the templates. So you do not have to invest time in any additional work. Just grab the template now and use them. This slide showcases dashboard that can help organization to track the traffic and revenue of ecommerce website. Its key elements are ecommerce conversion rate, average order value, performance by traffic source, top product, performance by device category.
Tracking The Actual Sales Figures After Deal Strategic Sales Plan To Enhance Summary Pdf
This slide provides glimpse about dashboard analysis that can help the business to track the performance of the sales team. It includes KPIs such as revenues, profit, orders placed, conversion placed, conversion rate, customers, etc. Boost your pitch with our creative Tracking The Actual Sales Figures After Deal Strategic Sales Plan To Enhance Summary Pdf. Deliver an awe-inspiring pitch that will mesmerize everyone. Using these presentation templates you will surely catch everyones attention. You can browse the ppts collection on our website. We have researchers who are experts at creating the right content for the templates. So you do not have to invest time in any additional work. Just grab the template now and use them. This slide provides glimpse about dashboard analysis that can help the business to track the performance of the sales team. It includes KPIs such as revenues, profit, orders placed, conversion placed, conversion rate, customers, etc.
Tracking The Cashflow Improvements Cash Assessing Corporate Financial Techniques Clipart Pdf
This slide showcases the KPIs that would help our business organization to track the improvements in the new cash management process. It includes quick ratio, cash balance, current ratio, days inventory outstanding, etc. Slidegeeks is one of the best resources for PowerPoint templates. You can download easily and regulate Tracking The Cashflow Improvements Cash Assessing Corporate Financial Techniques Clipart Pdf for your personal presentations from our wonderful collection. A few clicks is all it takes to discover and get the most relevant and appropriate templates. Use our Templates to add a unique zing and appeal to your presentation and meetings. All the slides are easy to edit and you can use them even for advertisement purposes. This slide showcases the KPIs that would help our business organization to track the improvements in the new cash management process. It includes quick ratio, cash balance, current ratio, days inventory outstanding, etc.
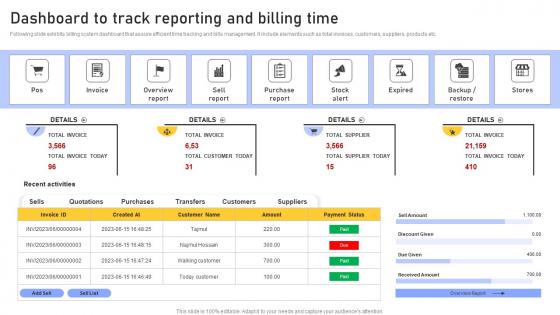
Dashboard To Track Reporting Enhancing Customer Service Operations Using CRM Technology Inspiration Pdf
Following slide exhibits billing system dashboard that assure efficient time tracking and bills management. It include elements such as total invoices, customers, suppliers, products etc. Slidegeeks is here to make your presentations a breeze with Dashboard To Track Reporting Enhancing Customer Service Operations Using CRM Technology Inspiration Pdf With our easy to use and customizable templates, you can focus on delivering your ideas rather than worrying about formatting. With a variety of designs to choose from, you are sure to find one that suits your needs. And with animations and unique photos, illustrations, and fonts, you can make your presentation pop. So whether you are giving a sales pitch or presenting to the board, make sure to check out Slidegeeks first Following slide exhibits billing system dashboard that assure efficient time tracking and bills management. It include elements such as total invoices, customers, suppliers, products etc.
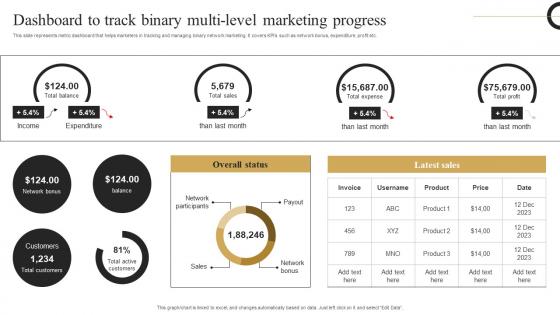
Dashboard Track Binary Multi Strategic Plan Develop Multi Level Marketing Microsoft Pdf
This slide represents metric dashboard that helps marketers in tracking and managing binary network marketing. It covers KPIs such as network bonus, expenditure, profit etc. From laying roadmaps to briefing everything in detail, our templates are perfect for you. You can set the stage with your presentation slides. All you have to do is download these easy to edit and customizable templates. Dashboard Track Binary Multi Strategic Plan Develop Multi Level Marketing Microsoft Pdf will help you deliver an outstanding performance that everyone would remember and praise you for. Do download this presentation today. This slide represents metric dashboard that helps marketers in tracking and managing binary network marketing. It covers KPIs such as network bonus, expenditure, profit etc.
Data Model Performance Tracking Data Modeling Approaches For Modern Analytics Formats Pdf
This slide shows the data model performance tracking dashboard. The purpose of this slide is to represent the Information related to the change brought by data models graphically. Present like a pro with Data Model Performance Tracking Data Modeling Approaches For Modern Analytics Formats Pdf Create beautiful presentations together with your team, using our easy to use presentation slides. Share your ideas in real time and make changes on the fly by downloading our templates. So whether you are in the office, on the go, or in a remote location, you can stay in sync with your team and present your ideas with confidence. With Slidegeeks presentation got a whole lot easier. Grab these presentations today. This slide shows the data model performance tracking dashboard. The purpose of this slide is to represent the Information related to the change brought by data models graphically.
Tracking The Actual Sales Developing Extensive Sales And Operations Strategy Designs Pdf
This slide provides glimpse about dashboard analysis that can help the business to track the performance of the sales team. It includes kpis such as revenues, profit, orders placed, conversion placed, conversion rate, customers, etc. There are so many reasons you need a Tracking The Actual Sales Developing Extensive Sales And Operations Strategy Designs Pdf. The first reason is you can not spend time making everything from scratch, Thus, Slidegeeks has made presentation templates for you too. You can easily download these templates from our website easily. This slide provides glimpse about dashboard analysis that can help the business to track the performance of the sales team. It includes kpis such as revenues, profit, orders placed, conversion placed, conversion rate, customers, etc.
Lead Generation Dashboard For Tracking Various Techniques For Managing Slides PDF
This slide covers the KPI dashboard for tracking lead conversion rates. It includes metrics such as visitors, average session rate, per visit, bounce rate, page views, etc. Welcome to our selection of the Lead Generation Dashboard For Tracking Various Techniques For Managing Slides PDF. These are designed to help you showcase your creativity and bring your sphere to life. Planning and Innovation are essential for any business that is just starting out. This collection contains the designs that you need for your everyday presentations. All of our PowerPoints are 100 percent editable, so you can customize them to suit your needs. This multi-purpose template can be used in various situations. Grab these presentation templates today This slide covers the KPI dashboard for tracking lead conversion rates. It includes metrics such as visitors, average session rate, per visit, bounce rate, page views, etc.
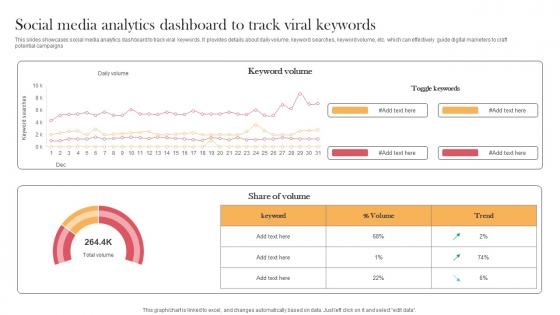
Social Media Analytics Dashboard To Track Viral Keywords Designing Approaches Designs Pdf
This slides showcases social media analytics dashboard to track viral keywords. It provides details about daily volume, keyword searches, keyword volume, etc. which can effectively guide digital marketers to craft potential campaigns. Slidegeeks has constructed Social Media Analytics Dashboard To Track Viral Keywords Designing Approaches Designs Pdf after conducting extensive research and examination. These presentation templates are constantly being generated and modified based on user preferences and critiques from editors. Here, you will find the most attractive templates for a range of purposes while taking into account ratings and remarks from users regarding the content. This is an excellent jumping-off point to explore our content and will give new users an insight into our top-notch PowerPoint Templates. This slides showcases social media analytics dashboard to track viral keywords. It provides details about daily volume, keyword searches, keyword volume, etc. which can effectively guide digital marketers to craft potential campaigns.
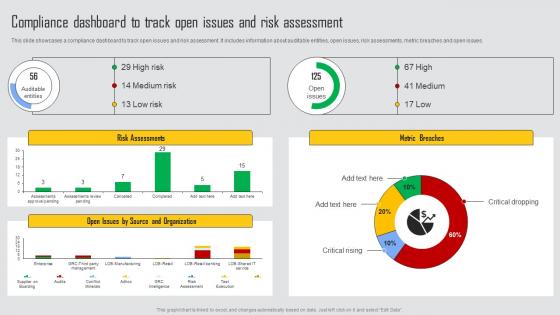
Compliance Dashboard To Track Managing Risks And Establishing Trust Through Efficient Rules Pdf
This slide showcases a compliance dashboard to track open issues and risk assessment. It includes information about auditable entities, open issues, risk assessments, metric breaches and open issues. This modern and well arranged Compliance Dashboard To Track Managing Risks And Establishing Trust Through Efficient Rules Pdf provides lots of creative possibilities. It is very simple to customize and edit with the Powerpoint Software. Just drag and drop your pictures into the shapes. All facets of this template can be edited with Powerpoint, no extra software is necessary. Add your own material, put your images in the places assigned for them, adjust the colors, and then you can show your slides to the world, with an animated slide included. This slide showcases a compliance dashboard to track open issues and risk assessment. It includes information about auditable entities, open issues, risk assessments, metric breaches and open issues.
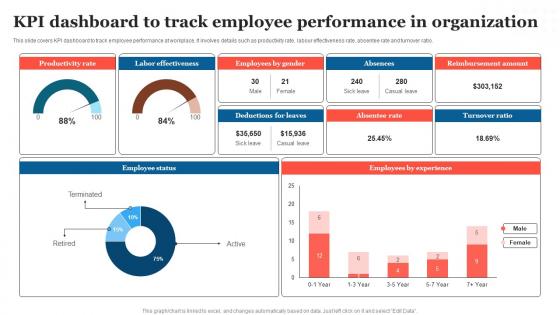
KPI Dashboard To Track Employee Strategic Measures To Boost Employee Efficienc Slides Pdf
This slide covers KPI dashboard to track employee performance at workplace. It involves details such as productivity rate, labour effectiveness rate, absentee rate and turnover ratio. Slidegeeks is here to make your presentations a breeze with KPI Dashboard To Track Employee Strategic Measures To Boost Employee Efficienc Slides Pdf With our easy to use and customizable templates, you can focus on delivering your ideas rather than worrying about formatting. With a variety of designs to choose from, you are sure to find one that suits your needs. And with animations and unique photos, illustrations, and fonts, you can make your presentation pop. So whether you are giving a sales pitch or presenting to the board, make sure to check out Slidegeeks first This slide covers KPI dashboard to track employee performance at workplace. It involves details such as productivity rate, labour effectiveness rate, absentee rate and turnover ratio.
Managing It Services Spending Tracking Dashboard Gen Tech Stack Playbook Inspiration Pdf
This slide provides information regarding the management of the digital services performance and IT spending tracking dashboard in terms of ROI, spend vs. budget, IT costs software, hardware, personnel and goals, IT spending in terms of revenues, etc. If your project calls for a presentation, then Slidegeeks is your go-to partner because we have professionally designed, easy-to-edit templates that are perfect for any presentation. After downloading, you can easily edit Managing It Services Spending Tracking Dashboard Gen Tech Stack Playbook Inspiration Pdf and make the changes accordingly. You can rearrange slides or fill them with different images. Check out all the handy templates This slide provides information regarding the management of the digital services performance and IT spending tracking dashboard in terms of ROI, spend vs. budget, IT costs software, hardware, personnel and goals, IT spending in terms of revenues, etc.
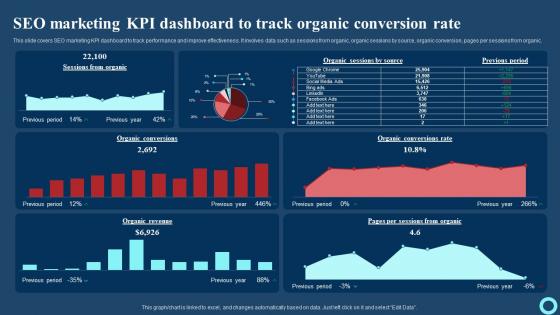
Seo Marketing KPI Dashboard To Track Organic Conversion Rate Effective Strategies To Enhance Download Pdf
This slide covers SEO marketing KPI dashboard to track performance and improve effectiveness. It involves data such as sessions from organic, organic sessions by source, organic conversion, pages per sessions from organic. The Seo Marketing KPI Dashboard To Track Organic Conversion Rate Effective Strategies To Enhance Download Pdf is a compilation of the most recent design trends as a series of slides. It is suitable for any subject or industry presentation, containing attractive visuals and photo spots for businesses to clearly express their messages. This template contains a variety of slides for the user to input data, such as structures to contrast two elements, bullet points, and slides for written information. Slidegeeks is prepared to create an impression. This slide covers SEO marketing KPI dashboard to track performance and improve effectiveness. It involves data such as sessions from organic, organic sessions by source, organic conversion, pages per sessions from organic.
B2B Sales Performance Tracking Digital Platform Administration For B2B Ecommerce Elements Pdf
This slide represents metric dashboard to track sales performance on e commerce website. It cover performance indicators such as sales breakdown, order breakdown, recurring sales etc. Present like a pro with B2B Sales Performance Tracking Digital Platform Administration For B2B Ecommerce Elements Pdf Create beautiful presentations together with your team, using our easy to use presentation slides. Share your ideas in real time and make changes on the fly by downloading our templates. So whether you are in the office, on the go, or in a remote location, you can stay in sync with your team and present your ideas with confidence. With Slidegeeks presentation got a whole lot easier. Grab these presentations today. This slide represents metric dashboard to track sales performance on e commerce website. It cover performance indicators such as sales breakdown, order breakdown, recurring sales etc.
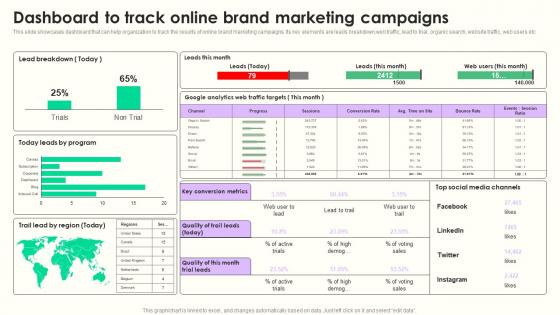
Dashboard To Track Online Maximizing Sales Via Online Brand Marketing Strategies Mockup Pdf
This slide showcases dashboard that can help organization to track the results of online brand marketing campaigns. Its key elements are leads breakdown,web traffic, lead to trial, organic search, website traffic, web users etc Find a pre designed and impeccable Dashboard To Track Online Maximizing Sales Via Online Brand Marketing Strategies Mockup Pdf. The templates can ace your presentation without additional effort. You can download these easy to edit presentation templates to make your presentation stand out from others. So, what are you waiting for Download the template from Slidegeeks today and give a unique touch to your presentation. This slide showcases dashboard that can help organization to track the results of online brand marketing campaigns. Its key elements are leads breakdown,web traffic, lead to trial, organic search, website traffic, web users etc
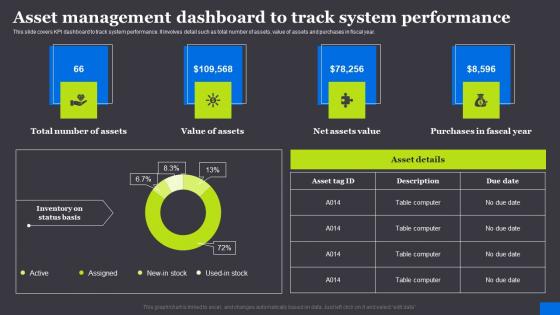
Asset Management Dashboard To Track RFID Solutions For Asset Traceability Mockup Pdf
This slide covers KPI dashboard to track system performance. It involves detail such as total number of assets, value of assets and purchases in fiscal year. Slidegeeks is one of the best resources for PowerPoint templates. You can download easily and regulate Asset Management Dashboard To Track RFID Solutions For Asset Traceability Mockup Pdf for your personal presentations from our wonderful collection. A few clicks is all it takes to discover and get the most relevant and appropriate templates. Use our Templates to add a unique zing and appeal to your presentation and meetings. All the slides are easy to edit and you can use them even for advertisement purposes. This slide covers KPI dashboard to track system performance. It involves detail such as total number of assets, value of assets and purchases in fiscal year.
Cloud Performance Tracking Enhancing Workload Efficiency Through Cloud Architecture Brochure Pdf
This slide covers the Key performance indicators for tracking performance of the cloud such as violations break down, sources, rules and severity This modern and well arranged Cloud Performance Tracking Enhancing Workload Efficiency Through Cloud Architecture Brochure Pdf provides lots of creative possibilities. It is very simple to customize and edit with the Powerpoint Software. Just drag and drop your pictures into the shapes. All facets of this template can be edited with Powerpoint, no extra software is necessary. Add your own material, put your images in the places assigned for them, adjust the colors, and then you can show your slides to the world, with an animated slide included. This slide covers the Key performance indicators for tracking performance of the cloud such as violations break down, sources, rules and severity
Dashboard For Tracking Efficiency Of Job Position Reorganization Communication Plan Pictures Pdf
This slide displays the dashboard for tracking the efficiency of business communication plan for restructuring job positions. The purpose of this slide is to help the business manager effectively communicate all necessary information to relevant stakeholders for smooth transitioning.Showcasing this set of slides titled Dashboard For Tracking Efficiency Of Job Position Reorganization Communication Plan Pictures Pdf The topics addressed in these templates are Stakeholder Possesses, Overall Experience, Pending Scores All the content presented in this PPT design is completely editable. Download it and make adjustments in color, background, font etc. as per your unique business setting. This slide displays the dashboard for tracking the efficiency of business communication plan for restructuring job positions. The purpose of this slide is to help the business manager effectively communicate all necessary information to relevant stakeholders for smooth transitioning.
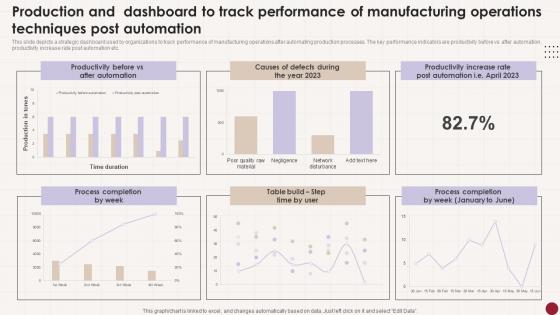
Production And Dashboard To Track Performance Of Manufacturing Operations Techniques Post Automation Tips Pdf
This slide depicts a strategic dashboard used by organizations to track performance of manufacturing operations after automating production processes. The key performance indicators are productivity before vs after automation, productivity increase rate post automation etc. Pitch your topic with ease and precision using this Production And Dashboard To Track Performance Of Manufacturing Operations Techniques Post Automation Tips Pdf This layout presents information on Productivity Before, After Automation, Process Completion It is also available for immediate download and adjustment. So, changes can be made in the color, design, graphics or any other component to create a unique layout. This slide depicts a strategic dashboard used by organizations to track performance of manufacturing operations after automating production processes. The key performance indicators are productivity before vs after automation, productivity increase rate post automation etc.
Kpi Dashboard For Tracking Virtual Security Hazards Of Healthcare Organization Professional Pdf
This slide depicts dashboard for tracking cyber security risks faced by healthcare organizations to effectively manage the major threats and take action accordingly. The key performing indicators are percentage of risks exceeding threshold limit, breakdown of threat rating, action plan etc. Showcasing this set of slides titled Kpi Dashboard For Tracking Virtual Security Hazards Of Healthcare Organization Professional Pdf. The topics addressed in these templates are Analysis Progress, Resolution Progress, Threshold Limit. All the content presented in this PPT design is completely editable. Download it and make adjustments in color, background, font etc. as per your unique business setting. This slide depicts dashboard for tracking cyber security risks faced by healthcare organizations to effectively manage the major threats and take action accordingly. The key performing indicators are percentage of risks exceeding threshold limit, breakdown of threat rating, action plan etc.
Wireless Banking To Improve KPI Dashboard For Tracking Monthly Personal Fin SS V
This slide shows dashboard which can be used by individuals to track monthly expenses in order to get better understanding of his or her finances. It includes metrics such as users spending, savings, debt, etc. Slidegeeks is one of the best resources for PowerPoint templates. You can download easily and regulate Wireless Banking To Improve KPI Dashboard For Tracking Monthly Personal Fin SS V for your personal presentations from our wonderful collection. A few clicks is all it takes to discover and get the most relevant and appropriate templates. Use our Templates to add a unique zing and appeal to your presentation and meetings. All the slides are easy to edit and you can use them even for advertisement purposes. This slide shows dashboard which can be used by individuals to track monthly expenses in order to get better understanding of his or her finances. It includes metrics such as users spending, savings, debt, etc.
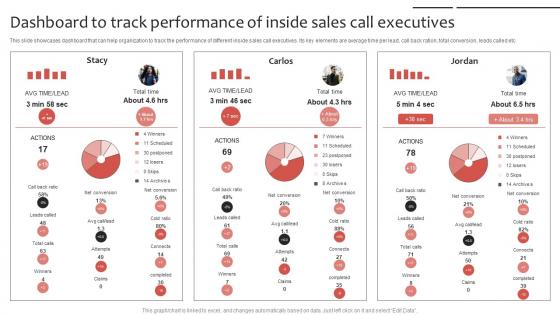
Phone Sales Strategy To Drive Leads Dashboard To Track Performance Strategy SS V
This slide showcases dashboard that can help organization to track the performance of different inside sales call executives. Its key elements are average time per lead, call back ration, total conversion, leads called etc. Slidegeeks has constructed Phone Sales Strategy To Drive Leads Dashboard To Track Performance Strategy SS V after conducting extensive research and examination. These presentation templates are constantly being generated and modified based on user preferences and critiques from editors. Here, you will find the most attractive templates for a range of purposes while taking into account ratings and remarks from users regarding the content. This is an excellent jumping-off point to explore our content and will give new users an insight into our top-notch PowerPoint Templates. This slide showcases dashboard that can help organization to track the performance of different inside sales call executives. Its key elements are average time per lead, call back ration, total conversion, leads called etc.
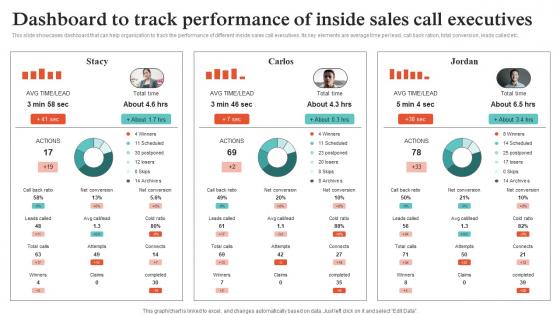
Virtual Sales Strategies For Business Dashboard To Track Performance Of Inside Strategy SS V
This slide showcases dashboard that can help organization to track the performance of different inside sales call executives. Its key elements are average time per lead, call back ration, total conversion, leads called etc. Make sure to capture your audiences attention in your business displays with our gratis customizable Virtual Sales Strategies For Business Dashboard To Track Performance Of Inside Strategy SS V. These are great for business strategies, office conferences, capital raising or task suggestions. If you desire to acquire more customers for your tech business and ensure they stay satisfied, create your own sales presentation with these plain slides. This slide showcases dashboard that can help organization to track the performance of different inside sales call executives. Its key elements are average time per lead, call back ration, total conversion, leads called etc.
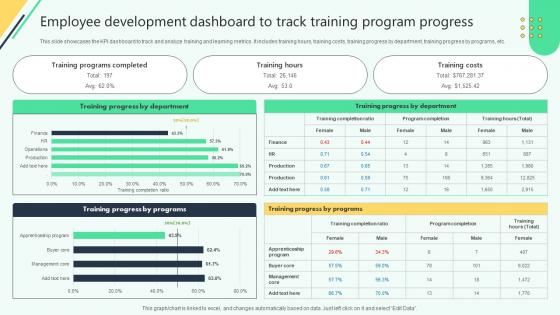
Employee Development Dashboard To Track Training Analysing Hr Data For Effective Decision Making
This slide showcases the KPI dashboard to track and analyze training and learning metrics. It includes training hours, training costs, training progress by department, training progress by programs, etc. Are you in need of a template that can accommodate all of your creative concepts This one is crafted professionally and can be altered to fit any style. Use it with Google Slides or PowerPoint. Include striking photographs, symbols, depictions, and other visuals. Fill, move around, or remove text boxes as desired. Test out color palettes and font mixtures. Edit and save your work, or work with colleagues. Download Employee Development Dashboard To Track Training Analysing Hr Data For Effective Decision Making and observe how to make your presentation outstanding. Give an impeccable presentation to your group and make your presentation unforgettable. This slide showcases the KPI dashboard to track and analyze training and learning metrics. It includes training hours, training costs, training progress by department, training progress by programs, etc.
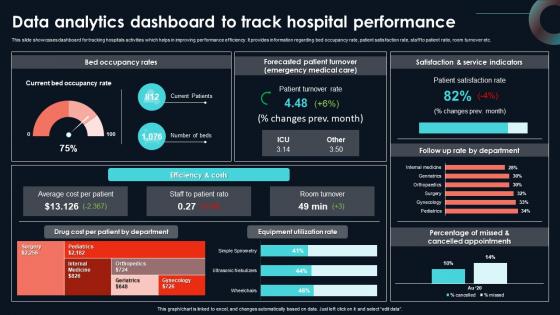
Data Analytics Dashboard To Track Hospital Developing Strategic Insights Using Big Data Analytics SS V
This slide showcases dashboard for tracking hospitals activities which helps in improving performance efficiency. It provides information regarding bed occupancy rate, patient satisfaction rate, staff to patient ratio, room turnover etc. The best PPT templates are a great way to save time, energy, and resources. Slidegeeks have 100 percent editable powerpoint slides making them incredibly versatile. With these quality presentation templates, you can create a captivating and memorable presentation by combining visually appealing slides and effectively communicating your message. Download Data Analytics Dashboard To Track Hospital Developing Strategic Insights Using Big Data Analytics SS V from Slidegeeks and deliver a wonderful presentation. This slide showcases dashboard for tracking hospitals activities which helps in improving performance efficiency. It provides information regarding bed occupancy rate, patient satisfaction rate, staff to patient ratio, room turnover etc.
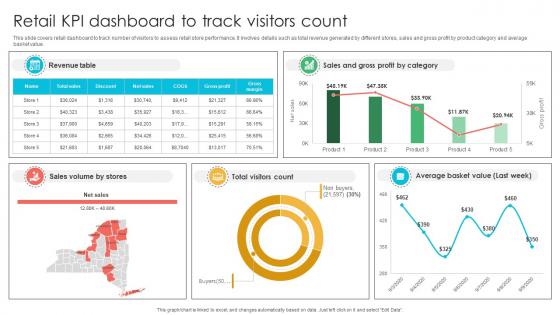
Marketing Strategies For Effective Retail KPI Dashboard To Track Visitors Count
This slide covers retail dashboard to track number of visitors to assess retail store performance. It involves details such as total revenue generated by different stores, sales and gross profit by product category and average basket value. Want to ace your presentation in front of a live audience Our Marketing Strategies For Effective Retail KPI Dashboard To Track Visitors Count can help you do that by engaging all the users towards you. Slidegeeks experts have put their efforts and expertise into creating these impeccable powerpoint presentations so that you can communicate your ideas clearly. Moreover, all the templates are customizable, and easy-to-edit and downloadable. Use these for both personal and commercial use. This slide covers retail dashboard to track number of visitors to assess retail store performance. It involves details such as total revenue generated by different stores, sales and gross profit by product category and average basket value.
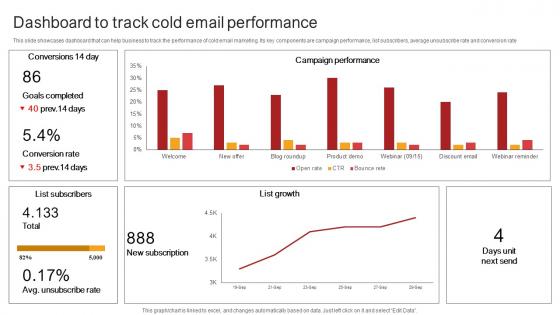
Remote Sales Plan For Dashboard To Track Cold Email Performance Strategy SS V
This slide showcases dashboard that can help business to track the performance of cold email marketing. Its key components are campaign performance, list subscribers, average unsubscribe rate and conversion rate. Slidegeeks is here to make your presentations a breeze with Remote Sales Plan For Dashboard To Track Cold Email Performance Strategy SS V With our easy-to-use and customizable templates, you can focus on delivering your ideas rather than worrying about formatting. With a variety of designs to choose from, you are sure to find one that suits your needs. And with animations and unique photos, illustrations, and fonts, you can make your presentation pop. So whether you are giving a sales pitch or presenting to the board, make sure to check out Slidegeeks first This slide showcases dashboard that can help business to track the performance of cold email marketing. Its key components are campaign performance, list subscribers, average unsubscribe rate and conversion rate.
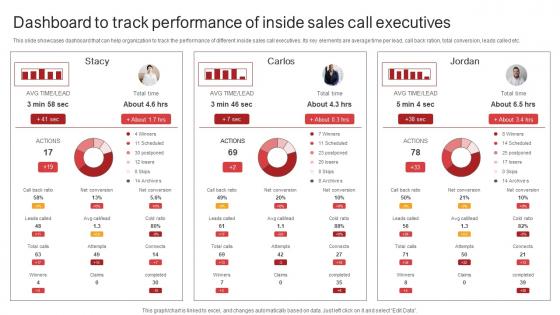
Remote Sales Plan For Lead Dashboard To Track Performance Of Inside Sales Strategy SS V
This slide showcases dashboard that can help organization to track the performance of different inside sales call executives. Its key elements are average time per lead, call back ration, total conversion, leads called etc. The best PPT templates are a great way to save time, energy, and resources. Slidegeeks have 100 percent editable powerpoint slides making them incredibly versatile. With these quality presentation templates, you can create a captivating and memorable presentation by combining visually appealing slides and effectively communicating your message. Download Remote Sales Plan For Lead Dashboard To Track Performance Of Inside Sales Strategy SS V from Slidegeeks and deliver a wonderful presentation. This slide showcases dashboard that can help organization to track the performance of different inside sales call executives. Its key elements are average time per lead, call back ration, total conversion, leads called etc.
Project Management Dashboard For Tracking Performance Closing A Project By Fulfilling PM SS V
This slide showcases dashboard for tracing project performance. This template focuses on changing the status of each task and graphs automatically tracking overall status. It covers aspects related to task priority, budget, etc. Find a pre-designed and impeccable Project Management Dashboard For Tracking Performance Closing A Project By Fulfilling PM SS V. The templates can ace your presentation without additional effort. You can download these easy-to-edit presentation templates to make your presentation stand out from others. So, what are you waiting for Download the template from Slidegeeks today and give a unique touch to your presentation. This slide showcases dashboard for tracing project performance. This template focuses on changing the status of each task and graphs automatically tracking overall status. It covers aspects related to task priority, budget, etc.
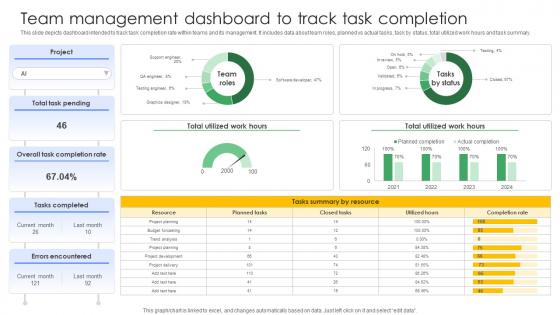
Driving Results Designing A Team Management Dashboard To Track Task Completion
This slide depicts dashboard intended to track task completion rate within teams and its management. It includes data about team roles, planned vs actual tasks, task by status, total utilized work hours and task summary. This modern and well-arranged Driving Results Designing A Team Management Dashboard To Track Task Completion provides lots of creative possibilities. It is very simple to customize and edit with the Powerpoint Software. Just drag and drop your pictures into the shapes. All facets of this template can be edited with Powerpoint, no extra software is necessary. Add your own material, put your images in the places assigned for them, adjust the colors, and then you can show your slides to the world, with an animated slide included. This slide depicts dashboard intended to track task completion rate within teams and its management. It includes data about team roles, planned vs actual tasks, task by status, total utilized work hours and task summary.
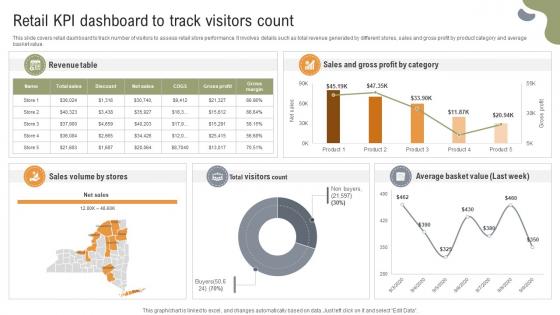
Implementing Strategies To Enhance Retail KPI Dashboard To Track Visitors Count
This slide covers retail dashboard to track number of visitors to assess retail store performance. It involves details such as total revenue generated by different stores, sales and gross profit by product category and average basket value. Want to ace your presentation in front of a live audience Our Implementing Strategies To Enhance Retail KPI Dashboard To Track Visitors Count can help you do that by engaging all the users towards you. Slidegeeks experts have put their efforts and expertise into creating these impeccable powerpoint presentations so that you can communicate your ideas clearly. Moreover, all the templates are customizable, and easy-to-edit and downloadable. Use these for both personal and commercial use. This slide covers retail dashboard to track number of visitors to assess retail store performance. It involves details such as total revenue generated by different stores, sales and gross profit by product category and average basket value.
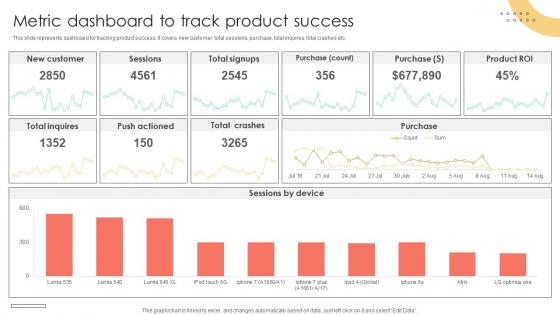
Brand Extension Techniques Metric Dashboard To Track Product Success Strategy SS V
This slide represents dashboard for tracking product success. It covers new customer, total sessions, purchase, total inquires, total crashes etc. Welcome to our selection of the Brand Extension Techniques Metric Dashboard To Track Product Success Strategy SS V. These are designed to help you showcase your creativity and bring your sphere to life. Planning and Innovation are essential for any business that is just starting out. This collection contains the designs that you need for your everyday presentations. All of our PowerPoints are 100Percent editable, so you can customize them to suit your needs. This multi-purpose template can be used in various situations. Grab these presentation templates today. This slide represents dashboard for tracking product success. It covers new customer, total sessions, purchase, total inquires, total crashes etc.
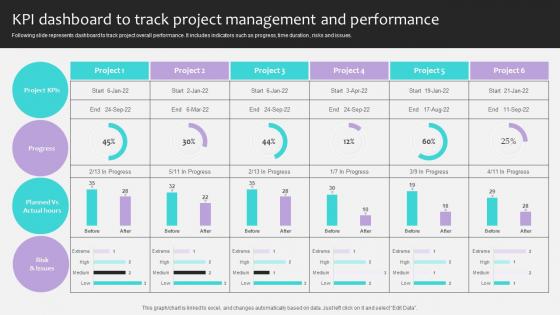
Project Stakeholders Management KPI Dashboard To Track Project Management Ppt Presentation
Following slide represents dashboard to track project overall performance. It includes indicators such as progress, time duration , risks and issues. Slidegeeks has constructed Project Stakeholders Management KPI Dashboard To Track Project Management Ppt Presentation after conducting extensive research and examination. These presentation templates are constantly being generated and modified based on user preferences and critiques from editors. Here, you will find the most attractive templates for a range of purposes while taking into account ratings and remarks from users regarding the content. This is an excellent jumping-off point to explore our content and will give new users an insight into our top-notch PowerPoint Templates. Following slide represents dashboard to track project overall performance. It includes indicators such as progress, time duration , risks and issues.
Security Testing Tracking And Monitoring Harnessing The World Of Ethical Ppt Slide
This slide showcases the security testing tracking and monitoring dashboard components such as planning, design, development, testing, project budget, etc. The Security Testing Tracking And Monitoring Harnessing The World Of Ethical Ppt Slide is a compilation of the most recent design trends as a series of slides. It is suitable for any subject or industry presentation, containing attractive visuals and photo spots for businesses to clearly express their messages. This template contains a variety of slides for the user to input data, such as structures to contrast two elements, bullet points, and slides for written information. Slidegeeks is prepared to create an impression. This slide showcases the security testing tracking and monitoring dashboard components such as planning, design, development, testing, project budget, etc.
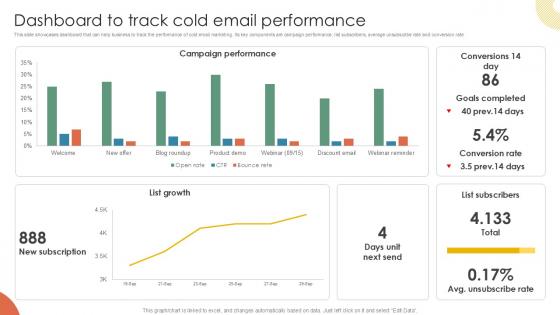
Dashboard To Track Cold Email Inside Vs Outside Sales PPT Example Strategy SS V
This slide showcases dashboard that can help business to track the performance of cold email marketing. Its key components are campaign performance, list subscribers, average unsubscribe rate and conversion rate. Slidegeeks is here to make your presentations a breeze with Dashboard To Track Cold Email Inside Vs Outside Sales PPT Example Strategy SS V With our easy-to-use and customizable templates, you can focus on delivering your ideas rather than worrying about formatting. With a variety of designs to choose from, you are sure to find one that suits your needs. And with animations and unique photos, illustrations, and fonts, you can make your presentation pop. So whether you are giving a sales pitch or presenting to the board, make sure to check out Slidegeeks first This slide showcases dashboard that can help business to track the performance of cold email marketing. Its key components are campaign performance, list subscribers, average unsubscribe rate and conversion rate
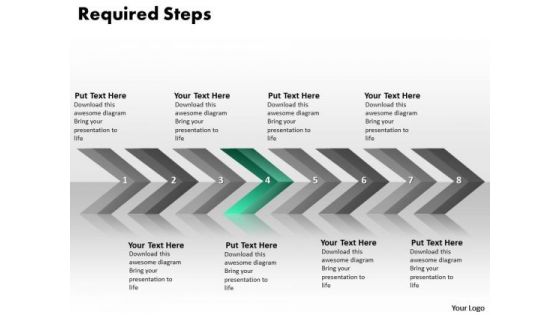
Ppt Continuous Implementation Of 8 PowerPoint Slide Numbers Required Process Templates
PPT continuous implementation of 8 powerpoint slide numbers required process Templates-This image clearly defines the concept of program flow plans that can be used to illustrate activities. You can use this diagram for the description of those business processes that describe the functionality of the business system. Create captivating presentations to deliver comparative and weighted arguments.-PPT continuous implementation of 8 powerpoint slide numbers required process Templates-Aim, Arrow, Badge, Border, Color, Connection, Curve, Design, Direction, Download, Icon, Illustration, Indicator, Internet, Label, Link, Magenta, Mark, Next, Object, Orientation, Paper, Peeling, Pointer, Rounded, Set, Shadow, Shape, Sign Create new equations with our Ppt Continuous Implementation Of 8 PowerPoint Slide Numbers Required Process Templates. Nurture fresh relationships with your views.
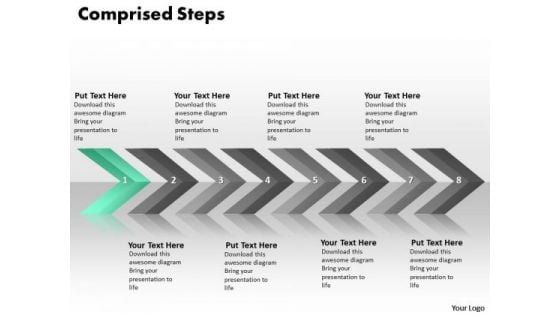
Ppt Continuous Implementation Of 8 Steps Comprised Process PowerPoint Templates
PPT continuous implementation of 8 steps comprised process PowerPoint Templates-This image clearly defines the concept of program flow plans that can be used to illustrate activities. You can use this diagram for the description of those business processes that describe the functionality of the business system. Create captivating presentations to deliver comparative and weighted arguments.-PPT continuous implementation of 8 steps comprised process PowerPoint Templates-Aim, Arrow, Badge, Border, Color, Connection, Curve, Design, Direction, Download, Icon, Illustration, Indicator, Internet, Label, Link, Magenta, Mark, Next, Object, Orientation, Paper, Peeling, Pointer, Rounded, Set, Shadow, Shape, Sign Excellence is an article of faith with our Ppt Continuous Implementation Of 8 Steps Comprised Process PowerPoint Templates team. They give their all and more to achieve it.
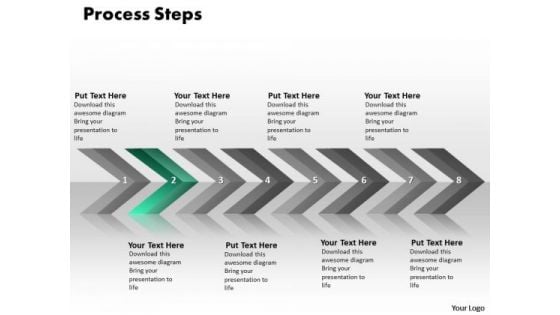
Ppt Continuous Implementation Of 8 Steps Containted Process PowerPoint Templates
PPT continuous implementation of 8 steps containted process PowerPoint Templates-This image clearly defines the concept of program flow plans that can be used to illustrate activities. You can use this diagram for the description of those business processes that describe the functionality of the business system. Create captivating presentations to deliver comparative and weighted arguments.-PPT continuous implementation of 8 steps containted process PowerPoint Templates-Aim, Arrow, Badge, Border, Color, Connection, Curve, Design, Direction, Download, Icon, Illustration, Indicator, Internet, Label, Link, Magenta, Mark, Next, Object, Orientation, Paper, Peeling, Pointer, Rounded, Set, Shadow, Shape, Sign Give the gift of career growth with our Ppt Continuous Implementation Of 8 Steps Containted Process PowerPoint Templates. Dont waste time struggling with PowerPoint. Let us do it for you.
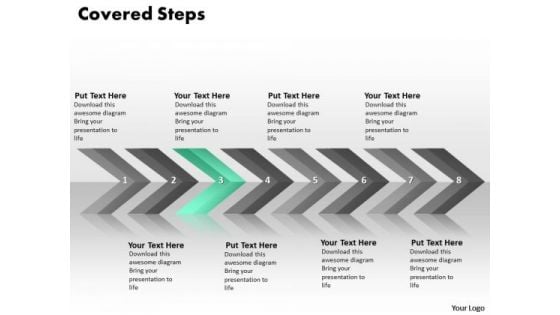
Ppt Continuous Implementation Of 8 Steps Covered Process PowerPoint Templates
PPT continuous implementation of 8 steps covered process PowerPoint Templates-This image clearly defines the concept of program flow plans that can be used to illustrate activities. You can use this diagram for the description of those business processes that describe the functionality of the business system. Create captivating presentations to deliver comparative and weighted arguments.-PPT continuous implementation of 8 steps covered process PowerPoint Templates-Aim, Arrow, Badge, Border, Color, Connection, Curve, Design, Direction, Download, Icon, Illustration, Indicator, Internet, Label, Link, Magenta, Mark, Next, Object, Orientation, Paper, Peeling, Pointer, Rounded, Set, Shadow, Shape, Sign Discover growth with our Ppt Continuous Implementation Of 8 Steps Covered Process PowerPoint Templates. Download without worries with our money back guaranteee.
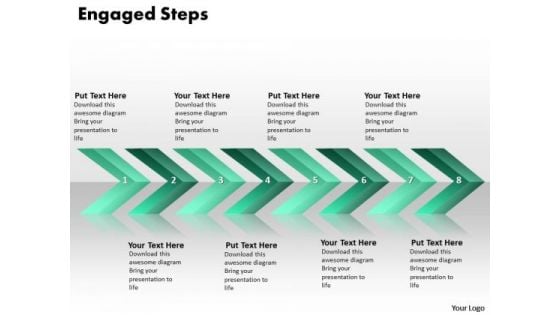
Ppt Continuous Implementation Of 8 Steps Engaged Process PowerPoint Templates
PPT continuous implementation of 8 steps engaged process PowerPoint Templates-This image clearly defines the concept of program flow plans that can be used to illustrate activities. You can use this diagram for the description of those business processes that describe the functionality of the business system. Create captivating presentations to deliver comparative and weighted arguments.-PPT continuous implementation of 8 steps engaged process PowerPoint Templates-Aim, Arrow, Badge, Border, Color, Connection, Curve, Design, Direction, Download, Icon, Illustration, Indicator, Internet, Label, Link, Magenta, Mark, Next, Object, Orientation, Paper, Peeling, Pointer, Rounded, Set, Shadow, Shape, Sign Our Ppt Continuous Implementation Of 8 Steps Engaged Process PowerPoint Templates will fetch it for you. They will bring audience adulation to your doorstep.
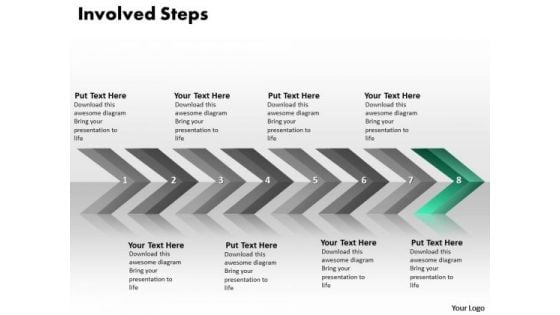
Ppt Continuous Implementation Of 8 Steps Involved Process PowerPoint Templates
PPT continuous implementation of 8 steps involved process PowerPoint Templates-This image clearly defines the concept of program flow plans that can be used to illustrate activities. You can use this diagram for the description of those business processes that describe the functionality of the business system. Create captivating presentations to deliver comparative and weighted arguments.-PPT continuous implementation of 8 steps involved process PowerPoint Templates-Aim, Arrow, Badge, Border, Color, Connection, Curve, Design, Direction, Download, Icon, Illustration, Indicator, Internet, Label, Link, Magenta, Mark, Next, Object, Orientation, Paper, Peeling, Pointer, Rounded, Set, Shadow, Shape, Sign Give your thoughts an elixir with our Ppt Continuous Implementation Of 8 Steps Involved Process PowerPoint Templates. They will reamain forever chic and charming.

Ppt Continuous Implementation Of 8 Steps Live Connections To Process PowerPoint Templates
PPT continuous implementation of 8 steps live connections to process PowerPoint Templates-This image clearly defines the concept of program flow plans that can be used to illustrate activities. You can use this diagram for the description of those business processes that describe the functionality of the business system. Create captivating presentations to deliver comparative and weighted arguments.-PPT continuous implementation of 8 steps live connections to process PowerPoint Templates-Aim, Arrow, Badge, Border, Color, Connection, Curve, Design, Direction, Download, Icon, Illustration, Indicator, Internet, Label, Link, Magenta, Mark, Next, Object, Orientation, Paper, Peeling, Pointer, Rounded, Set, Shadow, Shape, Sign Take it up as an escapade. Our Ppt Continuous Implementation Of 8 Steps Live Connections To Process PowerPoint Templates will give you belief.
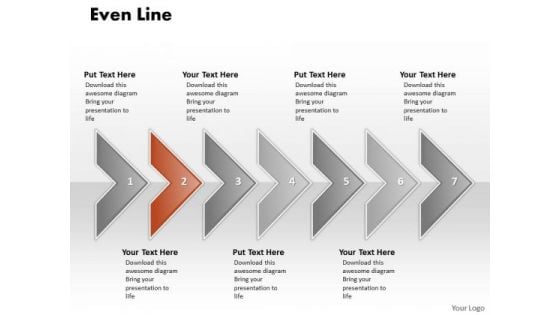
Ppt Correlated Arrows PowerPoint Templates Even Line 7 Stages
PPT correlated arrows powerpoint templates even line 7 stages-This Diagram is used to illustrate how information will move between interrelated systems in the accomplishment of a given function, task or process. The visual description of this information flow with each given level showing how data is fed into a given process step and subsequently passed along at the completion of that step.-PPT correlated arrows powerpoint templates even line 7 stages-Aim, Arrow, Badge, Border, Color, Connection, Curve, Design, Direction, Download, Icon, Illustration, Indicator, Internet, Label, Link, Magenta, Mark, Next, Object, Orientation, Paper, Peeling, Pointer, Rounded, Set, Shadow, Shape, Sign Let your ideas grow in their minds. Our Ppt Correlated Arrows PowerPoint Templates Even Line 7 Stages will act like a fertilizer.
Ppt Correlated Circular Arrows PowerPoint 2010 Horizontal Line 7 Stages Templates
PPT correlated circular arrows powerpoint 2010 horizontal line 7 stages Templates-This Diagram is used to illustrate how information will move between interrelated systems in the accomplishment of a given function, task or process. The visual description of this information flow with each given level showing how data is fed into a given process step and subsequently passed along at the completion of that step.-PPT correlated circular arrows powerpoint 2010 horizontal line 7 stages Templates-Aim, Arrow, Badge, Border, Color, Connection, Curve, Design, Direction, Download, Icon, Illustration, Indicator, Internet, Label, Link, Magenta, Mark, Next, Object, Orientation, Paper, Peeling, Pointer, Rounded, Set, Shadow, Shape, Sign Pioneer changes with our Ppt Correlated Circular Arrows PowerPoint 2010 Horizontal Line 7 Stages Templates. Download without worries with our money back guaranteee.
Ppt Correlated Curved Arrows PowerPoint 2010 Regular Line 7 Stages Templates
PPT correlated curved arrows powerpoint 2010 regular line 7 stages Templates-This Diagram is used to illustrate how information will move between interrelated systems in the accomplishment of a given function, task or process. The visual description of this information flow with each given level showing how data is fed into a given process step and subsequently passed along at the completion of that step.-PPT correlated curved arrows powerpoint 2010 regular line 7 stages Templates-Aim, Arrow, Badge, Border, Color, Connection, Curve, Design, Direction, Download, Icon, Illustration, Indicator, Internet, Label, Link, Magenta, Mark, Next, Object, Orientation, Paper, Peeling, Pointer, Rounded, Set, Shadow, Shape, Sign Examine every deatail with our Ppt Correlated Curved Arrows PowerPoint 2010 Regular Line 7 Stages Templates. Put each element to the test.
Ppt Correlated PowerPoint Graphics Arrows Parallel Line 7 Stage Templates
PPT correlated powerpoint graphics arrows parallel line 7 stage Templates-This Diagram is used to illustrate how information will move between interrelated systems in the accomplishment of a given function, task or process. The visual description of this information flow with each given level showing how data is fed into a given process step and subsequently passed along at the completion of that step.-PPT correlated powerpoint graphics arrows parallel line 7 stage Templates-Aim, Arrow, Badge, Border, Color, Connection, Curve, Design, Direction, Download, Icon, Illustration, Indicator, Internet, Label, Link, Magenta, Mark, Next, Object, Orientation, Paper, Peeling, Pointer, Rounded, Set, Shadow, Shape, Sign Analyse the effect of different factors. Our Ppt Correlated PowerPoint Graphics Arrows Parallel Line 7 Stage Templates will give them equal attention.
Ppt Correlated Shapes Arrows PowerPoint Horizontal Stages Templates
PPT correlated shapes arrows powerpoint horizontal stages Templates-This Diagram is used to illustrate how information will move between interrelated systems in the accomplishment of a given function, task or process. The visual description of this information flow with each given level showing how data is fed into a given process step and subsequently passed along at the completion of that step.-PPT correlated shapes arrows powerpoint horizontal stages Templates-Aim, Arrow, Badge, Border, Color, Connection, Curve, Design, Direction, Download, Icon, Illustration, Indicator, Internet, Label, Link, Magenta, Mark, Next, Object, Orientation, Paper, Peeling, Pointer, Rounded, Set, Shadow, Shape, Sign Enlist teams with our Ppt Correlated Shapes Arrows PowerPoint Horizontal Stages Templates. Download without worries with our money back guaranteee.
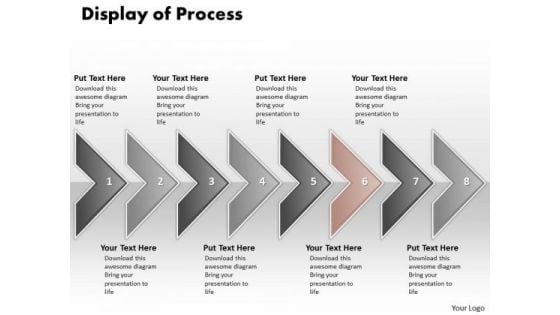
Ppt Display Of Marketing Process Using 8 Power Point Stage PowerPoint Templates
PPT display of marketing process using 8 power point stage PowerPoint Templates-This Diagram is used to illustrate how information will move between interrelated systems in the accomplishment of a given function, task or process. The visual description of this information flow with each given level showing how data is fed into a given process step and subsequently passed along at the completion of that step.-PPT display of marketing process using 8 power point stage PowerPoint Templates-Aim, Arrow, Badge, Border, Color, Connection, Curve, Design, Direction, Download, Icon, Illustration, Indicator, Internet, Label, Link, Magenta, Mark, Next, Object, Orientation, Paper, Peeling, Pointer, Rounded, Set, Shadow, Shape, Sign Solve problems with our Ppt Display Of Marketing Process Using 8 Power Point Stage PowerPoint Templates. Download without worries with our money back guaranteee.
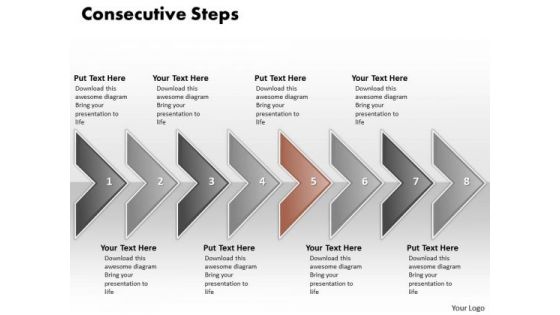
Ppt Eight Consecutive Practice The PowerPoint Macro Steps Of Marketing Process Templates
PPT eight consecutive practice the powerpoint macro steps of marketing process Templates-This Diagram is used to illustrate how information will move between interrelated systems in the accomplishment of a given function, task or process. The visual description of this information flow with each given level showing how data is fed into a given process step and subsequently passed along at the completion of that step.-PPT eight consecutive practice the powerpoint macro steps of marketing process Templates-Aim, Arrow, Badge, Border, Color, Connection, Curve, Design, Direction, Download, Icon, Illustration, Indicator, Internet, Label, Link, Magenta, Mark, Next, Object, Orientation, Paper, Peeling, Pointer, Rounded, Set, Shadow, Shape, Sign Let our Ppt Eight Consecutive Practice The PowerPoint Macro Steps Of Marketing Process Templates escort your thoughts. They will take them safely to their destination.
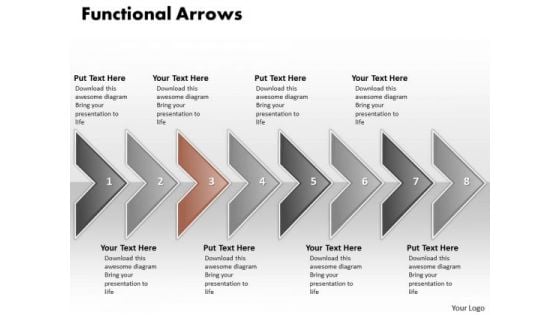
Ppt Increasing Functions Of International Marketing PowerPoint Slides Process 1 Templates
PPT increasing functions of international marketing powerpoint slides process 1 Templates-This diagram helps to shows different processes or objects that live simultaneously, as horizontal arrows, the messages exchanged between them, in the order in which they occur. This allows the specification of simple runtime scenarios in a graphical manner. Our PPT image is so ideally designed that helps you to make your presentation logical and interesting -PPT increasing functions of international marketing powerpoint slides process 1 Templates-Aim, Arrow, Badge, Border, Color, Connection, Curve, Design, Direction, Download, Icon, Illustration, Indicator, Internet, Label, Link, Magenta, Mark, Next, Object, Orientation, Paper, Peeling, Pointer, Rounded, Set, Shadow, Shape, Sign Measure success with our Ppt Increasing Functions Of International Marketing PowerPoint Slides Process 1 Templates. Download without worries with our money back guaranteee.
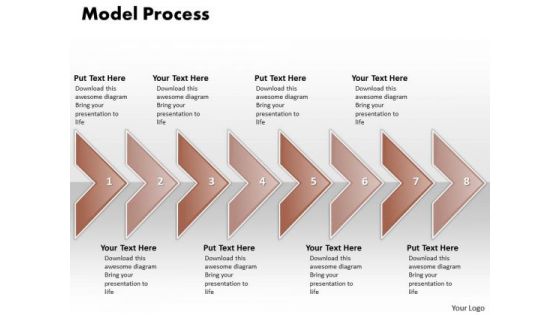
Ppt Model Of Social Presentation Process Using 5 Stages PowerPoint Templates
PPT model of social presentation process using 5 stages PowerPoint Templates-Create dynamic Microsoft office PPT Presentations with our professional templates containing a graphic of curved arrows. This Diagram is mainly used to depict the progress of sequential steps in the flow or process. It is a powerful tool conceived to enable you to define your message more clearly in your PPT presentations. -PPT model of social presentation process using 5 stages PowerPoint Templates-Aim, Arrow, Badge, Border, Color, Connection, Curve, Design, Direction, Download, Icon, Illustration, Indicator, Internet, Label, Link, Magenta, Mark, Next, Object, Orientation, Paper, Peeling, Pointer, Rounded, Set, Shadow, Shape, Sign Our Ppt Model Of Social Presentation Process Using 5 Stages PowerPoint Templates adhere to democratic culture. They cater for different attitudes and beliefs.
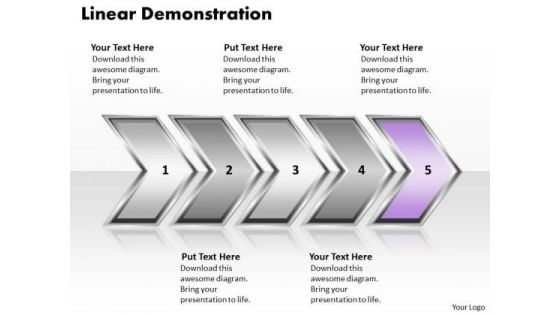
Ppt Linear Demonstration Of Process Using PowerPoint Graphics Arrows Templates
PPT linear demonstration of process using powerpoint graphics arrows Templates-This Diagram makes information accessible throughout the organization with a collective, visible view of critical data from different perspectives and providing the tools to upcoming business scenarios and plan for change. This image has been professionally designed to emphasize the concept of sequential process using curved arrows. It represents the Fifth arrow using purple color.-PPT linear demonstration of process using powerpoint graphics arrows Templates-Aim, Arrow, Arrowheads, Badge, Border, Click, Connection, Curve, Design, Direction, Download, Element, Fuchsia, Icon, Illustration, Indicator, Internet, Magenta, Mark, Object, Orientation, Pointer, Shadow, Shape, Sign Court the audience with our Ppt Linear Demonstration Of Process Using PowerPoint Graphics Arrows Templates. They will certainly be bowled over by you.
Ppt Linear Way To Represent 2 Practice The PowerPoint Macro Steps Templates
PPT linear way to represent 2 practice the powerpoint macro steps Templates-This Diagram makes information accessible throughout the organization with a collective, visible view of critical data from different perspectives and providing the tools to upcoming business scenarios and plan for change. This image has been professionally designed to emphasize the concept of sequential process using vertical arrows.-PPT linear way to represent 2 practice the powerpoint macro steps Templates-Aim, Arrow, Arrowheads, Badge, Border, Click, Connection, Curve, Design, Direction, Download, Element, Fuchsia, Icon, Illustration, Indicator, Internet, Magenta, Mark, Object, Orientation, Pointer, Shadow, Shape, Sign Our Ppt Linear Way To Represent 2 Practice The PowerPoint Macro Steps Templates are exceptionally customer-centric. They put clients before everything else.
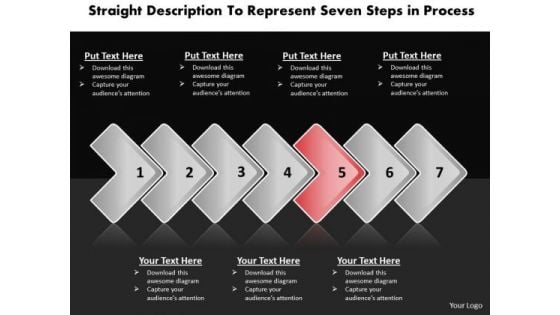
Ppt Description To Represent Seven Steps In Process PowerPoint Templates
PPT description to represent seven steps in process PowerPoint Templates-Often you have to represent an organization using a simple organizational hierarchy, but by using this PowerPoint Diagram you will give your Presentation a new look and will make it more interesting to watch. It is a useful captivating tool enables you to define your message in your Marketing PPT presentations. You can edit text, color, shade and style as per you need.-PPT description to represent seven steps in process PowerPoint Templates-Aim, Arrow, Arrowheads, Badge, Border, Click, Connection, Curve, Design, Direction, Download, Element, Fuchsia, Icon, Illustration, Indicator, Internet, Magenta, Mark, Object, Orientation, Pointer, Shadow, Shape, Sign Affiliate our Ppt Description To Represent Seven Steps In Process PowerPoint Templates to your thoughts. They will develop an affinity for them.
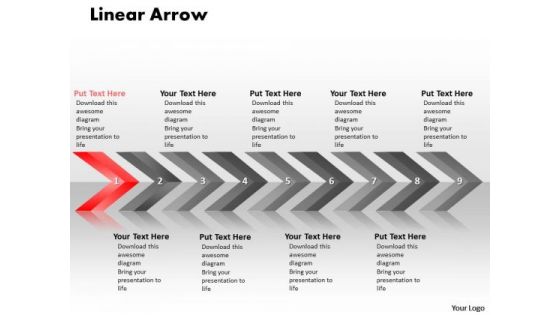
Flow Ppt Background Linear Arrows 9 Stages Operations Management PowerPoint 2 Design
flow PPT Background linear arrows 9 stages operations management powerpoint 2 design-This diagram is aesthetically designed to make a great first impression this template highlights stages of a process. you can easily edit the size, position and text and change the colors as per your need. Deliver amazing presentations to mesmerize your audience.-flow PPT Background linear arrows 9 stages operations management powerpoint 2 design-Aim, Angle, Arrow, Arrowheads, Badge, Banner, Connection, Curve, Design, Direction, Download, Element, Fuchsia, Icon, Illustration, Indicator, Internet, Label, Link, Magenta, Mark, Marker, Next, Object, Orange, Orientation, Pointer, Shadow, Shape, Signs Symbol You have envisaged a bright future for your organisation. Deliver your forecast on our Flow Ppt Background Linear Arrows 9 Stages Operations Management PowerPoint 2 Design.
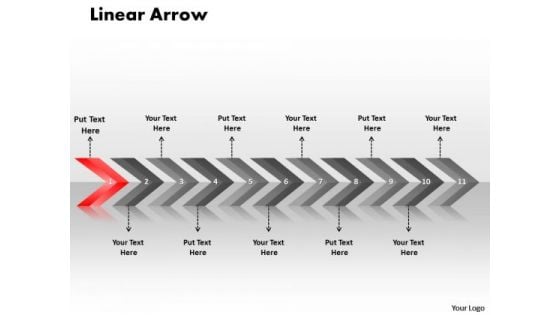
Business Ppt Template Linear Arrows 11 Stages Time Management PowerPoint 2 Graphic
Business PPT template linear arrows 11 stages time management powerpoint 2 Graphic-Use this diagram to your advantage to priorities your ideas. This slide is an excellent backdrop for you to enlighten your audience on the process you have gone through and the vision you have for the future.-Business PPT template linear arrows 11 stages time management powerpoint 2 Graphic-Aim, Angle, Arrow, Arrowheads, Badge, Banner, Connection, Curve, Design, Direction, Download, Element, Fuchsia, Icon, Illustration, Indicator, Internet, Label, Link, Magenta, Mark, Marker, Next, Object, Orange, Orientation, Pointer, Shadow, Shape, Signs Symbol Get the value of a lifetime with our Business Ppt Template Linear Arrows 11 Stages Time Management PowerPoint 2 Graphic. Dont waste time struggling with PowerPoint. Let us do it for you.

 Home
Home