Roadway
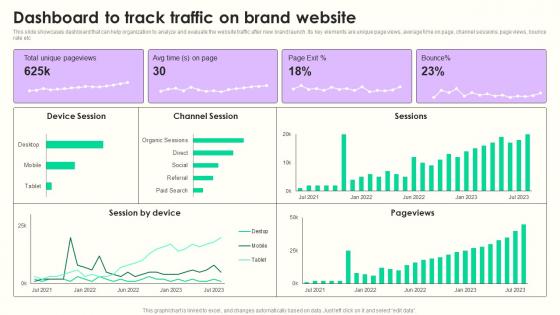
Dashboard To Track Traffic Maximizing Sales Via Online Brand Marketing Strategies Portrait Pdf
This slide showcases dashboard that can help organization to analyze and evaluate the website traffic after new brand launch. Its key elements are unique page views, average time on page, channel sessions, page views, bounce rate etc Boost your pitch with our creative Dashboard To Track Traffic Maximizing Sales Via Online Brand Marketing Strategies Portrait Pdf. Deliver an awe inspiring pitch that will mesmerize everyone. Using these presentation templates you will surely catch everyones attention. You can browse the ppts collection on our website. We have researchers who are experts at creating the right content for the templates. So you do not have to invest time in any additional work. Just grab the template now and use them. This slide showcases dashboard that can help organization to analyze and evaluate the website traffic after new brand launch. Its key elements are unique page views, average time on page, channel sessions, page views, bounce rate etc
Key Benefits Of Implementing NFC For Asset Tracking RFID Solutions For Asset Traceability Infographics Pdf
This slide covers key advantages of implementing near field communication in asset management. It involves features such as effective asset return, web interface and speed. This modern and well arranged Key Benefits Of Implementing NFC For Asset Tracking RFID Solutions For Asset Traceability Infographics Pdf provides lots of creative possibilities. It is very simple to customize and edit with the Powerpoint Software. Just drag and drop your pictures into the shapes. All facets of this template can be edited with Powerpoint, no extra software is necessary. Add your own material, put your images in the places assigned for them, adjust the colors, and then you can show your slides to the world, with an animated slide included. This slide covers key advantages of implementing near field communication in asset management. It involves features such as effective asset return, web interface and speed.
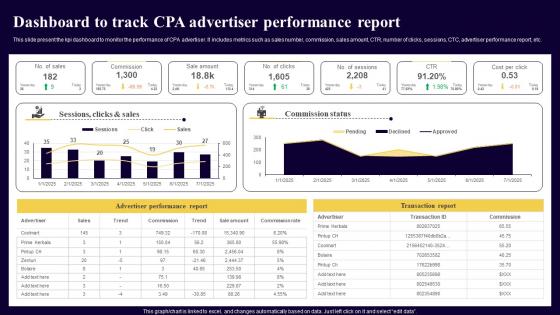
Dashboard To Track CPA Advertiser Performance Executing Cost Per Action Marketing Brochure Pdf
This slide present the kpi dashboard to monitor the performance of CPA advertiser. It includes metrics such as sales number, commission, sales amount, CTR, number of clicks, sessions, CTC, advertiser performance report, etc. Slidegeeks is here to make your presentations a breeze with Dashboard To Track CPA Advertiser Performance Executing Cost Per Action Marketing Brochure Pdf With our easy-to-use and customizable templates, you can focus on delivering your ideas rather than worrying about formatting. With a variety of designs to choose from, you are sure to find one that suits your needs. And with animations and unique photos, illustrations, and fonts, you can make your presentation pop. So whether you are giving a sales pitch or presenting to the board, make sure to check out Slidegeeks first. This slide present the kpi dashboard to monitor the performance of CPA advertiser. It includes metrics such as sales number, commission, sales amount, CTR, number of clicks, sessions, CTC, advertiser performance report, etc.
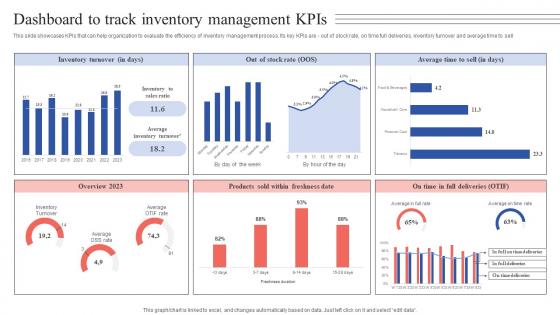
Dashboard To Track Inventory Management Kpis Tactical Guide Stock Administration Pictures Pdf
This slide showcases KPIs that can help organization to evaluate the efficiency of inventory management process. Its key KPIs are - out of stock rate, on time full deliveries, inventory turnover and average time to sell. Present like a pro with Dashboard To Track Inventory Management Kpis Tactical Guide Stock Administration Pictures Pdf Create beautiful presentations together with your team, using our easy-to-use presentation slides. Share your ideas in real-time and make changes on the fly by downloading our templates. So whether you are in the office, on the go, or in a remote location, you can stay in sync with your team and present your ideas with confidence. With Slidegeeks presentation got a whole lot easier. Grab these presentations today. This slide showcases KPIs that can help organization to evaluate the efficiency of inventory management process. Its key KPIs are - out of stock rate, on time full deliveries, inventory turnover and average time to sell.
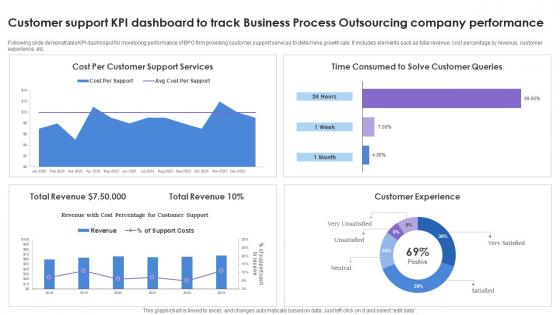
Customer Support KPI Dashboard To Track Business Process Outsourcing Company Performance Rules Pdf Wd
Following slide demonstrates KPI dashboard for monitoring performance of BPO firm providing customer support services to determine growth rate. It includes elements such as total revenue, cost percentage by revenue, customer experience, etc. Showcasing this set of slides titled Customer Support KPI Dashboard To Track Business Process Outsourcing Company Performance Rules Pdf Wd. The topics addressed in these templates are Customer Experience, Total Revenue. All the content presented in this PPT design is completely editable. Download it and make adjustments in color, background, font etc. as per your unique business setting. Following slide demonstrates KPI dashboard for monitoring performance of BPO firm providing customer support services to determine growth rate. It includes elements such as total revenue, cost percentage by revenue, customer experience, etc.
Bounce Rate KPI Tracking Dashboard With Average Pages And Time Inspiration Pdf
The following slide showcases dashboard that helps to identify the average time spent on page by visitors and the bounce rate. It also includes page load time, bounce rate by browser and details on internet explorer. Pitch your topic with ease and precision using this Bounce Rate KPI Tracking Dashboard With Average Pages And Time Inspiration Pdf. This layout presents information on Page Load Time, Bounce Rate, Internet Explorer. It is also available for immediate download and adjustment. So, changes can be made in the color, design, graphics or any other component to create a unique layout. The following slide showcases dashboard that helps to identify the average time spent on page by visitors and the bounce rate. It also includes page load time, bounce rate by browser and details on internet explorer.
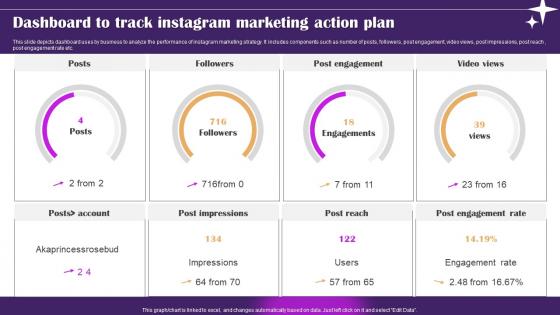
Dashboard To Track Instagram Marketing Action Plan Ppt Professional Image pdf
This slide depicts dashboard uses by business to analyze the performance of instagram marketing strategy. It includes components such as number of posts, followers, post engagement, video views, post impressions, post reach, post engagement rate etc. Showcasing this set of slides titled Dashboard To Track Instagram Marketing Action Plan Ppt Professional Image pdf. The topics addressed in these templates are Post Engagement, Video Views. All the content presented in this PPT design is completely editable. Download it and make adjustments in color, background, font etc. as per your unique business setting. This slide depicts dashboard uses by business to analyze the performance of instagram marketing strategy. It includes components such as number of posts, followers, post engagement, video views, post impressions, post reach , post engagement rate etc.
Business Event Return On Investment Tracking Tools And Metrics Portrait Pdf
The slide displays event ROI metrics and tools that aid in determining net value and costs contributing to an events success. It contains business goals such as brand awareness. Sales revenue, event engagement, recruitment etc. event goals, ROI metrics, ROI tools, etc. Pitch your topic with ease and precision using this Business Event Return On Investment Tracking Tools And Metrics Portrait Pdf This layout presents information on Building Brand Awareness, Driving Sales Revenue, Driving Recruitment It is also available for immediate download and adjustment. So, changes can be made in the color, design, graphics or any other component to create a unique layout. The slide displays event ROI metrics and tools that aid in determining net value and costs contributing to an events success. It contains business goals such as brand awareness. Sales revenue, event engagement, recruitment etc. event goals, ROI metrics, ROI tools, etc.
Student Data Tracking Application Dashboard Impact Of IoT Technology On Education IoT SS V
Following slide represents dashboard that provides accurate student data to analyze performance using educational apps. It includes metrics such as grades, attendance, average grades, progress rate, etc. From laying roadmaps to briefing everything in detail, our templates are perfect for you. You can set the stage with your presentation slides. All you have to do is download these easy-to-edit and customizable templates. Student Data Tracking Application Dashboard Impact Of IoT Technology On Education IoT SS V will help you deliver an outstanding performance that everyone would remember and praise you for. Do download this presentation today. Following slide represents dashboard that provides accurate student data to analyze performance using educational apps. It includes metrics such as grades, attendance, average grades, progress rate, etc.
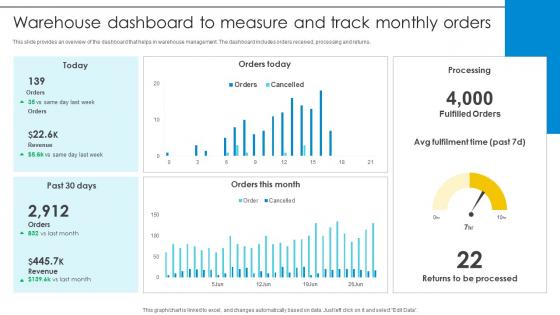
Warehouse Dashboard To Measure And Track Monthly Orders Optimizing Inventory Management IoT SS V
This slide provides an overview of the dashboard that helps in warehouse management. The dashboard includes orders received, processing and returns. Want to ace your presentation in front of a live audience Our Warehouse Dashboard To Measure And Track Monthly Orders Optimizing Inventory Management IoT SS V can help you do that by engaging all the users towards you. Slidegeeks experts have put their efforts and expertise into creating these impeccable powerpoint presentations so that you can communicate your ideas clearly. Moreover, all the templates are customizable, and easy-to-edit and downloadable. Use these for both personal and commercial use. This slide provides an overview of the dashboard that helps in warehouse management. The dashboard includes orders received, processing and returns.
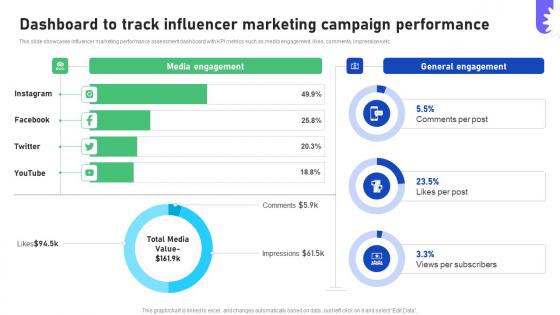
Improving Business Marketing Performance Dashboard To Track Influencer CRP DK SS V
This slide showcases influencer marketing performance assessment dashboard with KPI metrics such as media engagement, likes, comments, impressions etc. Are you in need of a template that can accommodate all of your creative concepts This one is crafted professionally and can be altered to fit any style. Use it with Google Slides or PowerPoint. Include striking photographs, symbols, depictions, and other visuals. Fill, move around, or remove text boxes as desired. Test out color palettes and font mixtures. Edit and save your work, or work with colleagues. Download Improving Business Marketing Performance Dashboard To Track Influencer CRP DK SS V and observe how to make your presentation outstanding. Give an impeccable presentation to your group and make your presentation unforgettable. This slide showcases influencer marketing performance assessment dashboard with KPI metrics such as media engagement, likes, comments, impressions etc.
Kpi Dashboard For Tracking Social Media Campaign Results Powerful Marketing Techniques Strategy SS V
This slide covers the dashboard for analyzing social media marketing campaigns. It includes metrics such as tweets, followers, followings, listed favorites, reach, views, Facebook engagement, clicks, likes, Instagram photos, etc. This Kpi Dashboard For Tracking Social Media Campaign Results Powerful Marketing Techniques Strategy SS V from Slidegeeks makes it easy to present information on your topic with precision. It provides customization options, so you can make changes to the colors, design, graphics, or any other component to create a unique layout. It is also available for immediate download, so you can begin using it right away. Slidegeeks has done good research to ensure that you have everything you need to make your presentation stand out. Make a name out there for a brilliant performance. This slide covers the dashboard for analyzing social media marketing campaigns. It includes metrics such as tweets, followers, followings, listed favorites, reach, views, Facebook engagement, clicks, likes, Instagram photos, etc.
Dashboards For Social Media Analytics Tracking And Monitoring Cracking The Code Of Social Media
This slide depicts the dashboard for Social Media Analytics insights. The purpose of this slide is to highlight insights such as brand awareness, audience growth, post engagement rate, provider analytics, etc. Boost your pitch with our creative Dashboards For Social Media Analytics Tracking And Monitoring Cracking The Code Of Social Media. Deliver an awe-inspiring pitch that will mesmerize everyone. Using these presentation templates you will surely catch everyones attention. You can browse the ppts collection on our website. We have researchers who are experts at creating the right content for the templates. So you do not have to invest time in any additional work. Just grab the template now and use them. This slide depicts the dashboard for Social Media Analytics insights. The purpose of this slide is to highlight insights such as brand awareness, audience growth, post engagement rate, provider analytics, etc.

Product Analytics Dashboard To Track Engagement Driving Business Success Integrating Product
This slide illustrates a dashboard to monitor customer engagement on company website by leveraging product analytics tools aimed at making necessary improvements. It covers insights regarding active monthly users, new users, total completed purchases, screen views, average duration of session, etc. There are so many reasons you need a Product Analytics Dashboard To Track Engagement Driving Business Success Integrating Product. The first reason is you can not spend time making everything from scratch, Thus, Slidegeeks has made presentation templates for you too. You can easily download these templates from our website easily. This slide illustrates a dashboard to monitor customer engagement on company website by leveraging product analytics tools aimed at making necessary improvements. It covers insights regarding active monthly users, new users, total completed purchases, screen views, average duration of session, etc.
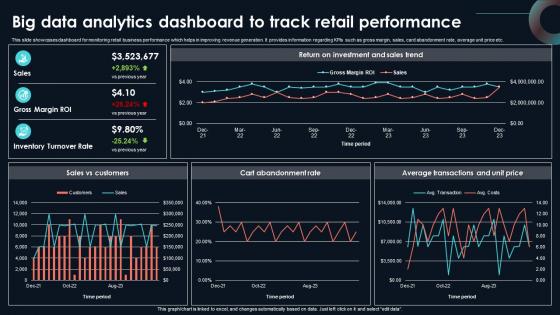
Big Data Analytics Dashboard To Track Developing Strategic Insights Using Big Data Analytics SS V
This slide showcases dashboard for monitoring retail business performance which helps in improving revenue generation. It provides information regarding KPIs such as gross margin, sales, card abandonment rate, average unit price etc. If your project calls for a presentation, then Slidegeeks is your go-to partner because we have professionally designed, easy-to-edit templates that are perfect for any presentation. After downloading, you can easily edit Big Data Analytics Dashboard To Track Developing Strategic Insights Using Big Data Analytics SS V and make the changes accordingly. You can rearrange slides or fill them with different images. Check out all the handy templates This slide showcases dashboard for monitoring retail business performance which helps in improving revenue generation. It provides information regarding KPIs such as gross margin, sales, card abandonment rate, average unit price etc.

Track Sales Performance Across Territories Efficient Sales Territory Management To Build SA SS V
This slide exhibits a graphical representation showcasing sales performance across segmented territories to compare revenue earned with set targets and optimise processes. The best PPT templates are a great way to save time, energy, and resources. Slidegeeks have 100 percent editable powerpoint slides making them incredibly versatile. With these quality presentation templates, you can create a captivating and memorable presentation by combining visually appealing slides and effectively communicating your message. Download Track Sales Performance Across Territories Efficient Sales Territory Management To Build SA SS V from Slidegeeks and deliver a wonderful presentation. This slide exhibits a graphical representation showcasing sales performance across segmented territories to compare revenue earned with set targets and optimise processes.
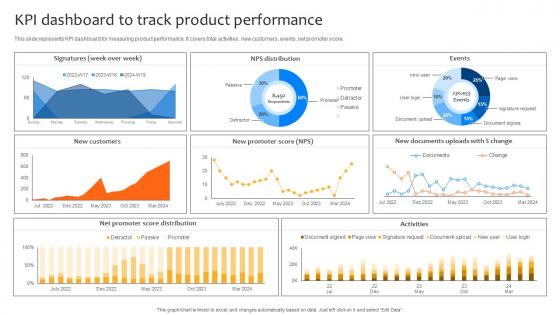
Deploying Strategies For Business KPI Dashboard To Track Product Performance Strategy SS V
This slide represents KPI dashboard for measuring product performance. It covers total activities, new customers, events, net promoter score. Coming up with a presentation necessitates that the majority of the effort goes into the content and the message you intend to convey. The visuals of a PowerPoint presentation can only be effective if it supplements and supports the story that is being told. Keeping this in mind our experts created Deploying Strategies For Business KPI Dashboard To Track Product Performance Strategy SS V to reduce the time that goes into designing the presentation. This way, you can concentrate on the message while our designers take care of providing you with the right template for the situation. This slide represents KPI dashboard for measuring product performance. It covers total activities, new customers, events, net promoter score.
Unlocking Potential IoTs Application Dashboard For Tracking IoT Devices Performance IoT SS V
This slide provides a dashboard for monitoring IoT devices that enhance agricultural practices. It incorporates IoT sensors to measure water tank capacity, Live crop monitoring, temperature and humidity measurements, control sprinklers, etc. Make sure to capture your audiences attention in your business displays with our gratis customizable Unlocking Potential IoTs Application Dashboard For Tracking IoT Devices Performance IoT SS V. These are great for business strategies, office conferences, capital raising or task suggestions. If you desire to acquire more customers for your tech business and ensure they stay satisfied, create your own sales presentation with these plain slides. This slide provides a dashboard for monitoring IoT devices that enhance agricultural practices. It incorporates IoT sensors to measure water tank capacity, Live crop monitoring, temperature and humidity measurements, control sprinklers, etc.

Product Analytics Dashboard To Track Engagement Product Analytics Implementation Data Analytics V
This slide illustrates a dashboard to monitor customer engagement on company website by leveraging product analytics tools aimed at making necessary improvements. It covers insights regarding active monthly users, new users, total completed purchases, screen views, average duration of session, etc Want to ace your presentation in front of a live audience Our Product Analytics Dashboard To Track Engagement Product Analytics Implementation Data Analytics V can help you do that by engaging all the users towards you. Slidegeeks experts have put their efforts and expertise into creating these impeccable powerpoint presentations so that you can communicate your ideas clearly. Moreover, all the templates are customizable, and easy-to-edit and downloadable. Use these for both personal and commercial use. This slide illustrates a dashboard to monitor customer engagement on company website by leveraging product analytics tools aimed at making necessary improvements. It covers insights regarding active monthly users, new users, total completed purchases, screen views, average duration of session, etc
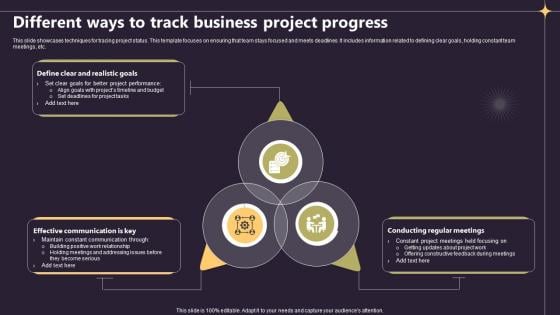
Closing A Project By Fulfilling Different Ways To Track Business Project Progress PM SS V
This slide showcases techniques for tracing project status. This template focuses on ensuring that team stays focused and meets deadlines. It includes information related to defining clear goals, holding constant team meetings, etc. Slidegeeks is here to make your presentations a breeze with Closing A Project By Fulfilling Different Ways To Track Business Project Progress PM SS V With our easy-to-use and customizable templates, you can focus on delivering your ideas rather than worrying about formatting. With a variety of designs to choose from, you are sure to find one that suits your needs. And with animations and unique photos, illustrations, and fonts, you can make your presentation pop. So whether you are giving a sales pitch or presenting to the board, make sure to check out Slidegeeks first This slide showcases techniques for tracing project status. This template focuses on ensuring that team stays focused and meets deadlines. It includes information related to defining clear goals, holding constant team meetings, etc.
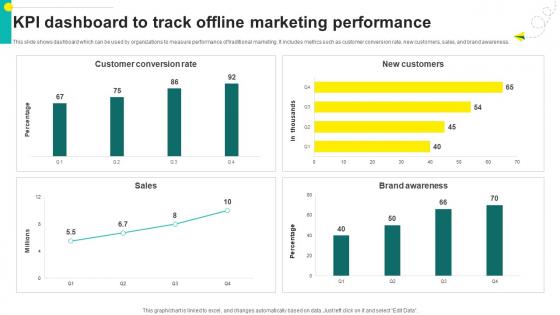
One On One Advertising Kpi Dashboard To Track Offline Marketing Performance Strategy SS V
This slide shows dashboard which can be used by organizations to measure performance of traditional marketing. It includes metrics such as customer conversion rate, new customers, sales, and brand awareness. Welcome to our selection of the One On One Advertising Kpi Dashboard To Track Offline Marketing Performance Strategy SS V. These are designed to help you showcase your creativity and bring your sphere to life. Planning and Innovation are essential for any business that is just starting out. This collection contains the designs that you need for your everyday presentations. All of our PowerPoints are 100Percent editable, so you can customize them to suit your needs. This multi-purpose template can be used in various situations. Grab these presentation templates today. This slide shows dashboard which can be used by organizations to measure performance of traditional marketing. It includes metrics such as customer conversion rate, new customers, sales, and brand awareness.
Marketing Tech Stack Impact Tracking Dashboard Comprehensive Guide For Marketing Technology
Following slide demonstrates performance monitoring dashboard. It includes key KPIs such as website visits, blog traffic, social share, click through rate, conversion rate, bounce rate, and impressions. Slidegeeks is here to make your presentations a breeze with Marketing Tech Stack Impact Tracking Dashboard Comprehensive Guide For Marketing Technology With our easy-to-use and customizable templates, you can focus on delivering your ideas rather than worrying about formatting. With a variety of designs to choose from, you are sure to find one that suits your needs. And with animations and unique photos, illustrations, and fonts, you can make your presentation pop. So whether you are giving a sales pitch or presenting to the board, make sure to check out Slidegeeks first Following slide demonstrates performance monitoring dashboard. It includes key KPIs such as website visits, blog traffic, social share, click through rate, conversion rate, bounce rate, and impressions.
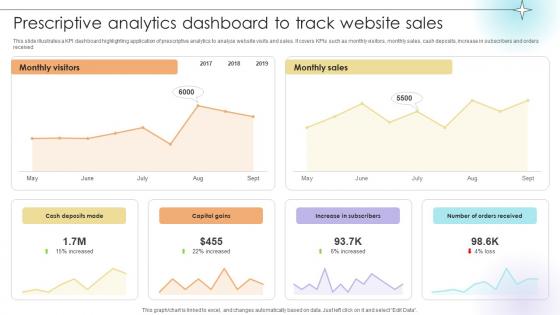
Prescriptive Analytics Dashboard To Track Website Sales Data Analytics SS V
This slide illustrates a KPI dashboard highlighting application of prescriptive analytics to analyze website visits and sales. It covers KPIs such as monthly visitors, monthly sales, cash deposits, increase in subscribers and orders received.This modern and well-arranged Prescriptive Analytics Dashboard To Track Website Sales Data Analytics SS V provides lots of creative possibilities. It is very simple to customize and edit with the Powerpoint Software. Just drag and drop your pictures into the shapes. All facets of this template can be edited with Powerpoint, no extra software is necessary. Add your own material, put your images in the places assigned for them, adjust the colors, and then you can show your slides to the world, with an animated slide included. This slide illustrates a KPI dashboard highlighting application of prescriptive analytics to analyze website visits and sales. It covers KPIs such as monthly visitors, monthly sales, cash deposits, increase in subscribers and orders received.
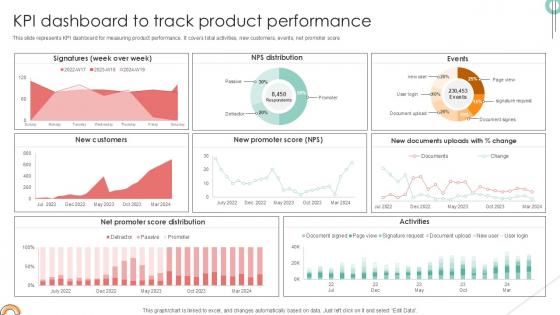
KPI Dashboard To Track Implementing Product Diversification PPT Presentation Strategy SS V
This slide represents KPI dashboard for measuring product performance. It covers total activities, new customers, events, net promoter score. This modern and well-arranged KPI Dashboard To Track Implementing Product Diversification PPT Presentation Strategy SS V provides lots of creative possibilities. It is very simple to customize and edit with the Powerpoint Software. Just drag and drop your pictures into the shapes. All facets of this template can be edited with Powerpoint, no extra software is necessary. Add your own material, put your images in the places assigned for them, adjust the colors, and then you can show your slides to the world, with an animated slide included. This slide represents KPI dashboard for measuring product performance. It covers total activities, new customers, events, net promoter score
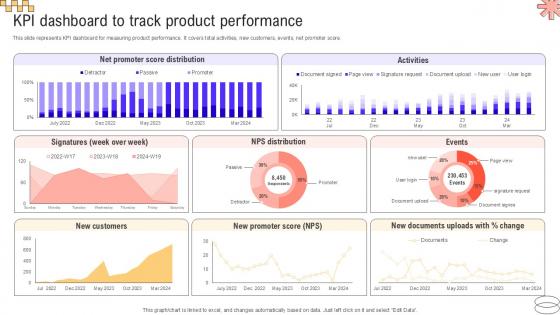
KPI Dashboard To Track Product Implementing Geographic Extension PPT Example Strategy SS V
This slide represents KPI dashboard for measuring product performance. It covers total activities, new customers, events, net promoter score. Coming up with a presentation necessitates that the majority of the effort goes into the content and the message you intend to convey. The visuals of a PowerPoint presentation can only be effective if it supplements and supports the story that is being told. Keeping this in mind our experts created KPI Dashboard To Track Product Implementing Geographic Extension PPT Example Strategy SS V to reduce the time that goes into designing the presentation. This way, you can concentrate on the message while our designers take care of providing you with the right template for the situation. This slide represents KPI dashboard for measuring product performance. It covers total activities, new customers, events, net promoter score.
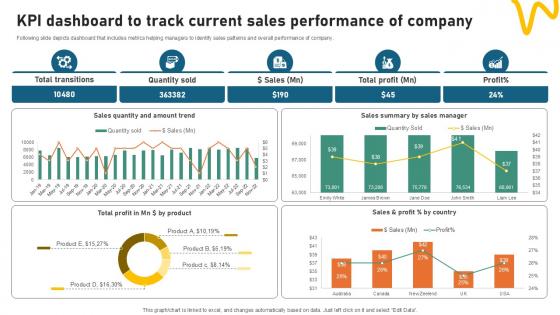
KPI Dashboard To Track Current Sales Sample Pitch Deck For Video Ppt Example
Following slide depicts dashboard that includes metrics helping managers to identify sales patterns and overall performance of company. Welcome to our selection of the KPI Dashboard To Track Current Sales Sample Pitch Deck For Video Ppt Example. These are designed to help you showcase your creativity and bring your sphere to life. Planning and Innovation are essential for any business that is just starting out. This collection contains the designs that you need for your everyday presentations. All of our PowerPoints are 100Percent editable, so you can customize them to suit your needs. This multi-purpose template can be used in various situations. Grab these presentation templates today. Following slide depicts dashboard that includes metrics helping managers to identify sales patterns and overall performance of company.
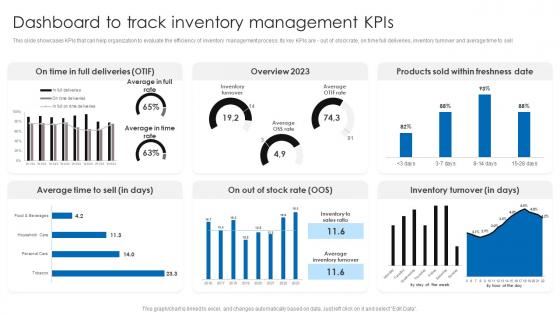
Dashboard To Track Inventory Management Kpis Retail Stock Administration Strategies Rules Pdf
This slide showcases KPIs that can help organization to evaluate the efficiency of inventory management process. Its key KPIs are - out of stock rate, on time full deliveries, inventory turnover and average time to sell.Coming up with a presentation necessitates that the majority of the effort goes into the content and the message you intend to convey. The visuals of a PowerPoint presentation can only be effective if it supplements and supports the story that is being told. Keeping this in mind our experts created Dashboard To Track Inventory Management Kpis Retail Stock Administration Strategies Rules Pdf to reduce the time that goes into designing the presentation. This way, you can concentrate on the message while our designers take care of providing you with the right template for the situation. This slide showcases KPIs that can help organization to evaluate the efficiency of inventory management process. Its key KPIs are out of stock rate, on time full deliveries, inventory turnover and average time to sell
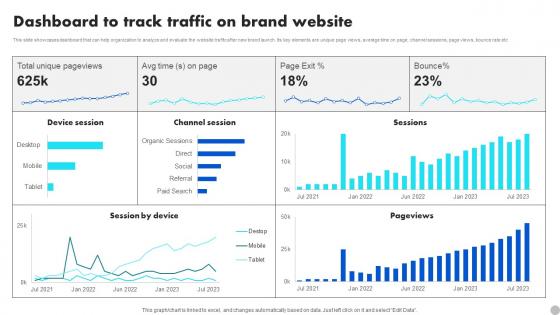
Dashboard To Track Traffic On Brand Website Brand Diversification Approach Rules Pdf
This slide showcases dashboard that can help organization to analyze and evaluate the website traffic after new brand launch. Its key elements are unique page views, average time on page, channel sessions, page views, bounce rate etc. Are you in need of a template that can accommodate all of your creative concepts This one is crafted professionally and can be altered to fit any style. Use it with Google Slides or PowerPoint. Include striking photographs, symbols, depictions, and other visuals. Fill, move around, or remove text boxes as desired. Test out color palettes and font mixtures. Edit and save your work, or work with colleagues. Download Dashboard To Track Traffic On Brand Website Brand Diversification Approach Rules Pdf and observe how to make your presentation outstanding. Give an impeccable presentation to your group and make your presentation unforgettable. This slide showcases dashboard that can help organization to analyze and evaluate the website traffic after new brand launch. Its key elements are unique page views, average time on page, channel sessions, page views, bounce rate etc.
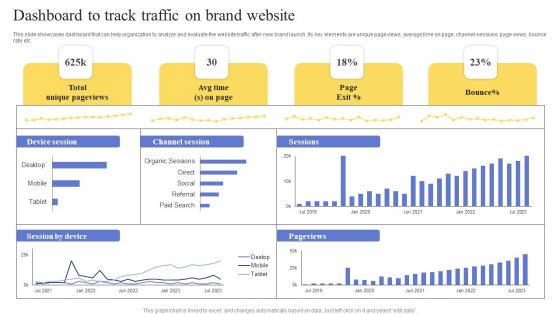
Dashboard To Track Traffic On Brand Website Maximizing Revenue Using Professional Pdf
This slide showcases dashboard that can help organization to analyze and evaluate the website traffic after new brand launch. Its key elements are unique page views, average time on page, channel sessions, page views, bounce rate etc. Are you in need of a template that can accommodate all of your creative concepts This one is crafted professionally and can be altered to fit any style. Use it with Google Slides or PowerPoint. Include striking photographs, symbols, depictions, and other visuals. Fill, move around, or remove text boxes as desired. Test out color palettes and font mixtures. Edit and save your work, or work with colleagues. Download Dashboard To Track Traffic On Brand Website Maximizing Revenue Using Professional Pdf and observe how to make your presentation outstanding. Give an impeccable presentation to your group and make your presentation unforgettable. This slide showcases dashboard that can help organization to analyze and evaluate the website traffic after new brand launch. Its key elements are unique page views, average time on page, channel sessions, page views, bounce rate etc.
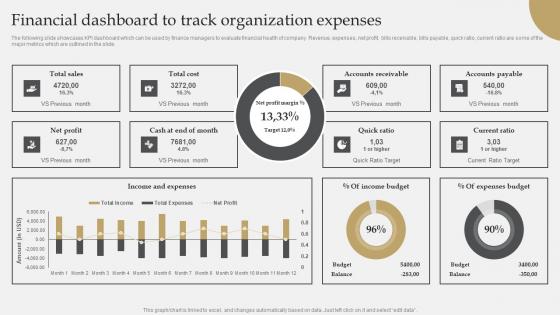
IT Industry Market Research Financial Dashboard To Track Organization Expenses Introduction Pdf
The following slide showcases KPI dashboard which can be used by finance managers to evaluate financial health of company. Revenue, expenses, net profit, bills receivable, bills payable, quick ratio, current ratio are some of the major metrics which are outlined in the slide. Present like a pro with IT Industry Market Research Financial Dashboard To Track Organization Expenses Introduction Pdf Create beautiful presentations together with your team, using our easy-to-use presentation slides. Share your ideas in real-time and make changes on the fly by downloading our templates. So whether you are in the office, on the go, or in a remote location, you can stay in sync with your team and present your ideas with confidence. With Slidegeeks presentation got a whole lot easier. Grab these presentations today. The following slide showcases KPI dashboard which can be used by finance managers to evaluate financial health of company. Revenue, expenses, net profit, bills receivable, bills payable, quick ratio, current ratio are some of the major metrics which are outlined in the slide.
Performance Enhancement Plan Monthly Sales Performance Tracking And Monitoring Portrait Pdf
This slide showcases a dashboard presenting various metrics to measure and analyze sales performance for revenue growth. It includes key components such as number of sales, revenue, profit, cost, sales revenue, sales increment, cost analysis and cross sell. Coming up with a presentation necessitates that the majority of the effort goes into the content and the message you intend to convey. The visuals of a PowerPoint presentation can only be effective if it supplements and supports the story that is being told. Keeping this in mind our experts created Performance Enhancement Plan Monthly Sales Performance Tracking And Monitoring Portrait Pdf to reduce the time that goes into designing the presentation. This way, you can concentrate on the message while our designers take care of providing you with the right template for the situation. This slide showcases a dashboard presenting various metrics to measure and analyze sales performance for revenue growth. It includes key components such as number of sales, revenue, profit, cost, sales revenue, sales increment, cost analysis and cross sell.
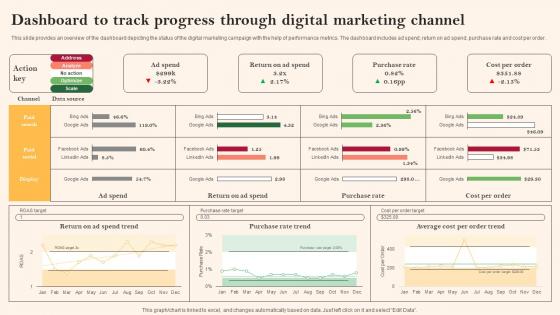
Social Media Marketing To Boost Dashboard To Track Progress Through Digital Sample Pdf
This slide provides an overview of the dashboard depicting the status of the digital marketing campaign with the help of performance metrics. The dashboard includes ad spend, return on ad spend, purchase rate and cost per order. Are you in need of a template that can accommodate all of your creative concepts This one is crafted professionally and can be altered to fit any style. Use it with Google Slides or PowerPoint. Include striking photographs, symbols, depictions, and other visuals. Fill, move around, or remove text boxes as desired. Test out color palettes and font mixtures. Edit and save your work, or work with colleagues. Download Social Media Marketing To Boost Dashboard To Track Progress Through Digital Sample Pdf and observe how to make your presentation outstanding. Give an impeccable presentation to your group and make your presentation unforgettable. This slide provides an overview of the dashboard depicting the status of the digital marketing campaign with the help of performance metrics. The dashboard includes ad spend, return on ad spend, purchase rate and cost per order.
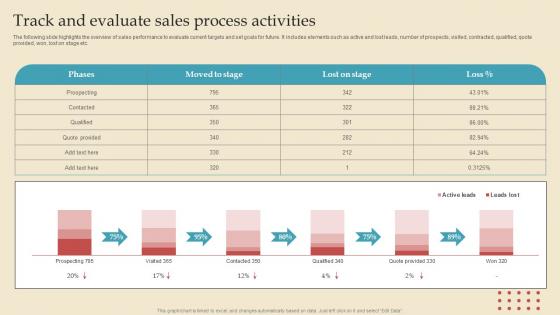
Track And Evaluate Sales Describing Business Performance Administration Goals Information Pdf
The following slide highlights the overview of sales performance to evaluate current targets and set goals for future. It includes elements such as active and lost leads, number of prospects, visited, contracted, qualified, quote provided, won, lost on stage etc. Coming up with a presentation necessitates that the majority of the effort goes into the content and the message you intend to convey. The visuals of a PowerPoint presentation can only be effective if it supplements and supports the story that is being told. Keeping this in mind our experts created Track And Evaluate Sales Describing Business Performance Administration Goals Information Pdf to reduce the time that goes into designing the presentation. This way, you can concentrate on the message while our designers take care of providing you with the right template for the situation. The following slide highlights the overview of sales performance to evaluate current targets and set goals for future. It includes elements such as active and lost leads, number of prospects, visited, contracted, qualified, quote provided, won, lost on stage etc.
Introduction To Customer Referral Marketing Tracking Word Mouth Marketing Portrait PDF
This slide covers a brief overview of referral marketing for encouraging customers to advocate on behalf of a brand. It also includes major benefits of referral marketing, such as higher conversion rates, boosting brand awareness, generating more revenue, etc. Coming up with a presentation necessitates that the majority of the effort goes into the content and the message you intend to convey. The visuals of a PowerPoint presentation can only be effective if it supplements and supports the story that is being told. Keeping this in mind our experts created Introduction To Customer Referral Marketing Tracking Word Mouth Marketing Portrait PDF to reduce the time that goes into designing the presentation. This way, you can concentrate on the message while our designers take care of providing you with the right template for the situation. This slide covers a brief overview of referral marketing for encouraging customers to advocate on behalf of a brand. It also includes major benefits of referral marketing, such as higher conversion rates, boosting brand awareness, generating more revenue, etc.
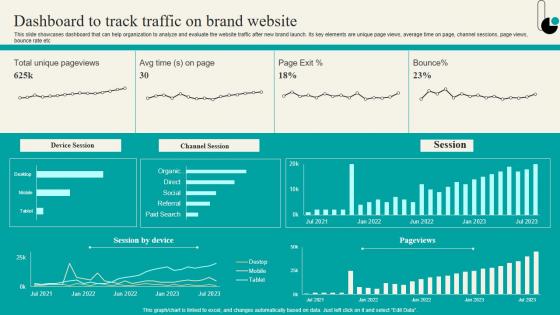
Dashboard To Track Traffic On Brand Website Strategic Marketing Plan Structure PDF
This slide showcases dashboard that can help organization to analyze and evaluate the website traffic after new brand launch. Its key elements are unique page views, average time on page, channel sessions, page views, bounce rate etc. Are you in need of a template that can accommodate all of your creative concepts This one is crafted professionally and can be altered to fit any style. Use it with Google Slides or PowerPoint. Include striking photographs, symbols, depictions, and other visuals. Fill, move around, or remove text boxes as desired. Test out color palettes and font mixtures. Edit and save your work, or work with colleagues. Download Dashboard To Track Traffic On Brand Website Strategic Marketing Plan Structure PDF and observe how to make your presentation outstanding. Give an impeccable presentation to your group and make your presentation unforgettable. This slide showcases dashboard that can help organization to analyze and evaluate the website traffic after new brand launch. Its key elements are unique page views, average time on page, channel sessions, page views, bounce rate etc.
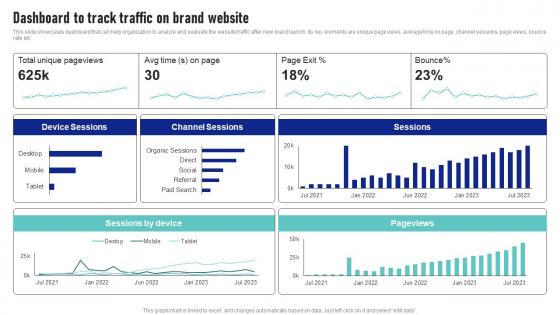
Dashboard To Track Traffic On Brand Website Launching New Product Brand Sample Pdf
This slide showcases dashboard that can help organization to analyze and evaluate the website traffic after new brand launch. Its key elements are unique page views, average time on page, channel sessions, page views, bounce rate etc Are you in need of a template that can accommodate all of your creative concepts This one is crafted professionally and can be altered to fit any style. Use it with Google Slides or PowerPoint. Include striking photographs, symbols, depictions, and other visuals. Fill, move around, or remove text boxes as desired. Test out color palettes and font mixtures. Edit and save your work, or work with colleagues. Download Dashboard To Track Traffic On Brand Website Launching New Product Brand Sample Pdf and observe how to make your presentation outstanding. Give an impeccable presentation to your group and make your presentation unforgettable. This slide showcases dashboard that can help organization to analyze and evaluate the website traffic after new brand launch. Its key elements are unique page views, average time on page, channel sessions, page views, bounce rate etc
Tracking The Improvements Exhaustive Guide Of Pay Per Click Advertising Initiatives Topics Pdf
This slide showcases the KPIs that would help the business organization to evaluate Pay Per Click PPC marketing campaigns improvements. It includes Google Ads conversion rate, funnel, leads converted vs. cost trend, Cost Per Click CPC, etc. Do you know about Slidesgeeks Tracking The Improvements Exhaustive Guide Of Pay Per Click Advertising Initiatives Topics Pdf These are perfect for delivering any kind od presentation. Using it, create PowerPoint presentations that communicate your ideas and engage audiences. Save time and effort by using our pre designed presentation templates that are perfect for a wide range of topic. Our vast selection of designs covers a range of styles, from creative to business, and are all highly customizable and easy to edit. Download as a PowerPoint template or use them as Google Slides themes. This slide showcases the KPIs that would help the business organization to evaluate Pay Per Click PPC marketing campaigns improvements. It includes Google Ads conversion rate, funnel, leads converted vs. cost trend, Cost Per Click CPC, etc.
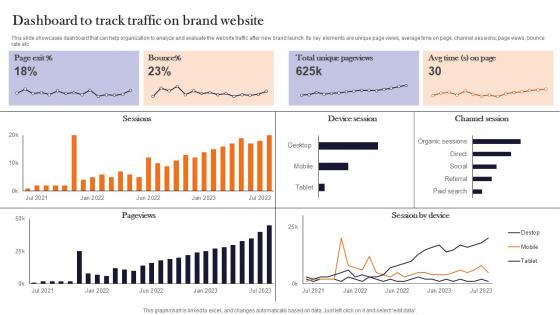
Dashboard To Track Traffic On Brand Website Product Advertising And Positioning Diagrams Pdf
This slide showcases dashboard that can help organization to analyze and evaluate the website traffic after new brand launch. Its key elements are unique page views, average time on page, channel sessions, page views, bounce rate etc. Are you in need of a template that can accommodate all of your creative concepts This one is crafted professionally and can be altered to fit any style. Use it with Google Slides or PowerPoint. Include striking photographs, symbols, depictions, and other visuals. Fill, move around, or remove text boxes as desired. Test out color palettes and font mixtures. Edit and save your work, or work with colleagues. Download Dashboard To Track Traffic On Brand Website Product Advertising And Positioning Diagrams Pdf and observe how to make your presentation outstanding. Give an impeccable presentation to your group and make your presentation unforgettable. This slide showcases dashboard that can help organization to analyze and evaluate the website traffic after new brand launch. Its key elements are unique page views, average time on page, channel sessions, page views, bounce rate etc.
Brand Equity Management To Raise Tracking Kpis To Measure Brand Health And Reputation
This slide represents a dashboard highlighting multiple performance metrics to measure brand health and reputation over time. It includes metrics such as net promoter score, brand awareness, familiarity, consideration, perception, etc. Are you in need of a template that can accommodate all of your creative concepts This one is crafted professionally and can be altered to fit any style. Use it with Google Slides or PowerPoint. Include striking photographs, symbols, depictions, and other visuals. Fill, move around, or remove text boxes as desired. Test out color palettes and font mixtures. Edit and save your work, or work with colleagues. Download Brand Equity Management To Raise Tracking Kpis To Measure Brand Health And Reputation and observe how to make your presentation outstanding. Give an impeccable presentation to your group and make your presentation unforgettable. This slide represents a dashboard highlighting multiple performance metrics to measure brand health and reputation over time. It includes metrics such as net promoter score, brand awareness, familiarity, consideration, perception, etc.
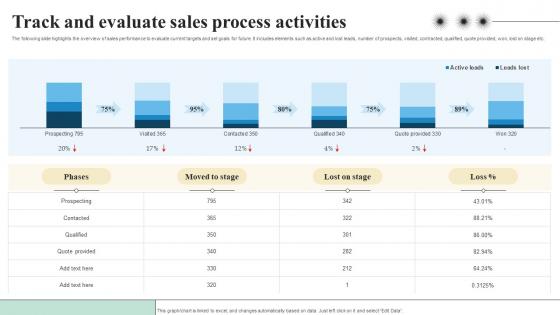
Track And Evaluate Sales Process Objectives And Key Result Methodology For Business
The following slide highlights the overview of sales performance to evaluate current targets and set goals for future. It includes elements such as active and lost leads, number of prospects, visited, contracted, qualified, quote provided, won, lost on stage etc. This Track And Evaluate Sales Process Objectives And Key Result Methodology For Business from Slidegeeks makes it easy to present information on your topic with precision. It provides customization options, so you can make changes to the colors, design, graphics, or any other component to create a unique layout. It is also available for immediate download, so you can begin using it right away. Slidegeeks has done good research to ensure that you have everything you need to make your presentation stand out. Make a name out there for a brilliant performance. The following slide highlights the overview of sales performance to evaluate current targets and set goals for future. It includes elements such as active and lost leads, number of prospects, visited, contracted, qualified, quote provided, won, lost on stage etc.
IoT Technology Role In Satellite Tracking And Navigation IoT In Orbit Unleashing The Power IoT SS V
This slide highlights role of IoT technology in satellite tracking and navigation to improve space missions and ensure spacecraft safety in space. It includes application such as real time monitoring, orbit determination, Autonomous navigation, Constellation coordination. Coming up with a presentation necessitates that the majority of the effort goes into the content and the message you intend to convey. The visuals of a PowerPoint presentation can only be effective if it supplements and supports the story that is being told. Keeping this in mind our experts created IoT Technology Role In Satellite Tracking And Navigation IoT In Orbit Unleashing The Power IoT SS V to reduce the time that goes into designing the presentation. This way, you can concentrate on the message while our designers take care of providing you with the right template for the situation. This slide highlights role of IoT technology in satellite tracking and navigation to improve space missions and ensure spacecraft safety in space. It includes application such as real time monitoring, orbit determination, Autonomous navigation, Constellation coordination.
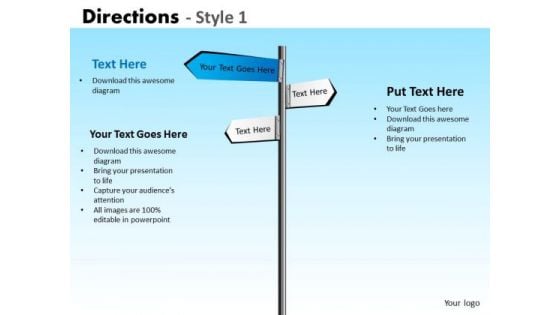
Business Framework Model Directions Style 1 Strategic Management
Delight Them With Our Business Framework Model Directions Style 1 Strategic Management Powerpoint Templates.
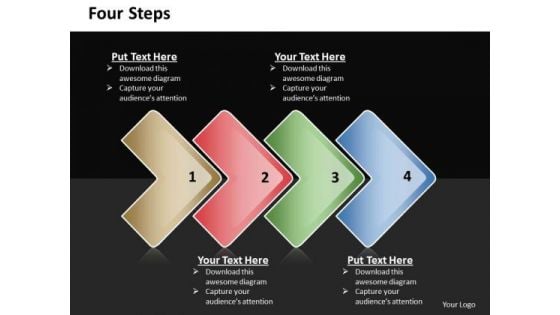
Ppt Direct Description Of 4 Steps Included Procedure PowerPoint Templates
PPT direct description of 4 steps included procedure PowerPoint Templates-Develop competitive advantage with our above template which contains a diagram of pointed arrows. It helps expound on the logic of your detailed thought process to take your company forward. Break it all down to Key Result Areas. Motivate your team to cross all barriers-PPT direct description of 4 steps included procedure PowerPoint Templates-Aim, Arrow, Arrowheads, Badge, Border, Click, Connection, Curve, Design, Direction, Download, Element, Fuchsia, Icon, Illustration, Indicator, Internet, Magenta, Mark, Object, Orientation, Pointer, Shadow, Shape, Sign Our Ppt Direct Description Of 4 Steps Included Procedure PowerPoint Templates are arguably exceptional. Your ideas will be hard to argue against.
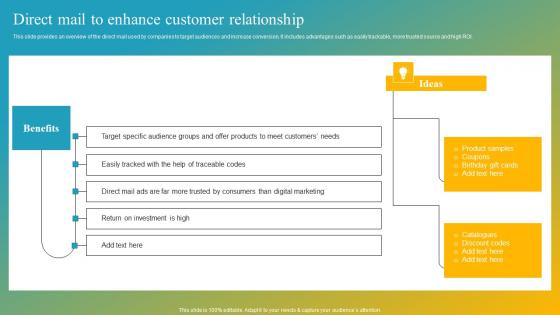
Effective Customer Engagement With Direct Response Direct Mail To Enhance Customer Information Pdf
This slide provides an overview of the direct mail used by companies to target audiences and increase conversion. It includes advantages such as easily trackable, more trusted source and high ROI. Formulating a presentation can take up a lot of effort and time, so the content and message should always be the primary focus. The visuals of the PowerPoint can enhance the presenters message, so our Effective Customer Engagement With Direct Response Direct Mail To Enhance Customer Information Pdf was created to help save time. Instead of worrying about the design, the presenter can concentrate on the message while our designers work on creating the ideal templates for whatever situation is needed. Slidegeeks has experts for everything from amazing designs to valuable content, we have put everything into Effective Customer Engagement With Direct Response Direct Mail To Enhance Customer Information Pdf. This slide provides an overview of the direct mail used by companies to target audiences and increase conversion. It includes advantages such as easily trackable, more trusted source and high ROI.
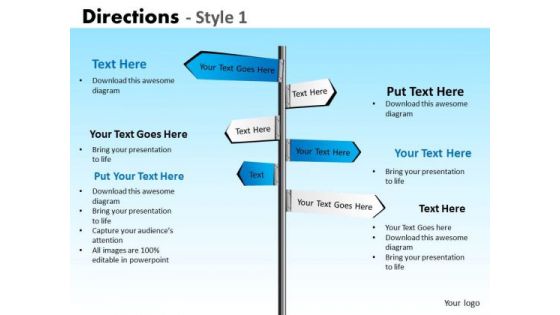
Strategy Diagram Directions Style 1 Business Cycle Diagram
Get The Doers Into Action. Activate Them With Our Strategy Diagram Directions Style 1 Business Cycle Diagram Powerpoint Templates.
Mba Models And Frameworks Directions Style 2 Marketing Diagram
Our MBA Models And Frameworks Directions Style 2 Marketing Diagram Powerpoint Templates Abhor Doodling. They Never Let The Interest Flag.
Business Cycle Diagram Traffic Direction Signs Strategy Diagram
Make Some Dough With Our Business Cycle Diagram Traffic Direction Signs Strategy Diagram Powerpoint Templates. Your Assets Will Rise Significantly.
Business Cycle Diagram Traffic Direction Signs Business Framework Model
Our Business Cycle Diagram Traffic Direction Signs Business Framework Model Powerpoint Templates Enjoy Drama. They Provide Entertaining Backdrops.
Strategy Diagram Traffic Direction Signs Business Finance Strategy Development
Get Out Of The Dock With Our Strategy Diagram Traffic Direction Signs Business Finance Strategy Development Powerpoint Templates. Your Mind Will Be Set Free.
Strategy Diagram Traffic Direction Signs Business Cycle Diagram
Document The Process On Our Strategy Diagram Traffic Direction Signs Business Cycle Diagram Powerpoint Templates. Make A Record Of Every Detail.
Strategic Management Directions Style 1 Business Framework Model
Establish The Dominance Of Your Ideas. Our Strategic Management Directions Style 1 Business Framework Model Powerpoint Templates Will Put Them On Top.
Sales Diagram Traffic Direction Signs Business Cycle Diagram
Be A Donor Of Great Ideas. Display Your Charity On Our Sales Diagram Traffic Direction Signs Business Cycle Diagram Powerpoint Templates.
Marketing Diagram Traffic Direction Signs Business Finance Strategy Development
Our Marketing Diagram Traffic Direction Signs Business Finance Strategy Development Powerpoint Templates Deliver At Your Doorstep. Let Them In For A Wonderful Experience.
Marketing Diagram Directions Style 2 Business Framework Model
Connect The Dots With Our Marketing Diagram Directions Style 2 Business Framework Model Powerpoint Templates. Watch The Whole Picture Clearly Emerge.
Marketing Diagram Directions Style 2 Business Cycle Diagram
Double Your Chances With Our Marketing Diagram Directions Style 2 Business Cycle Diagram Powerpoint Templates. The Value Of Your Thoughts Will Increase Two-Fold.
Consulting Diagram Traffic Direction Signs Business Finance Strategy Development
Double Up Our Consulting Diagram Traffic Direction Signs Business Finance Strategy Development Powerpoint Templates With Your Thoughts. They Will Make An Awesome Pair.
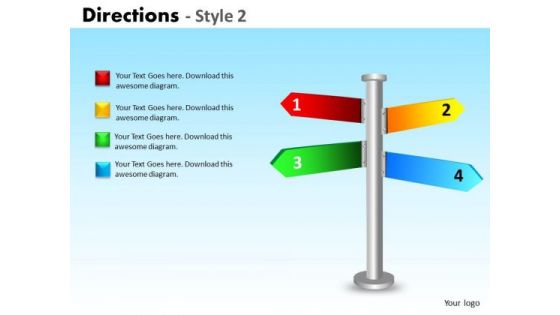
Consulting Diagram Directions Style 2 Business Cycle Diagram
Double The Impact With Our Consulting Diagram Directions Style 2 Business Cycle Diagram Powerpoint Templates. Your Thoughts Will Have An Imposing Effect.
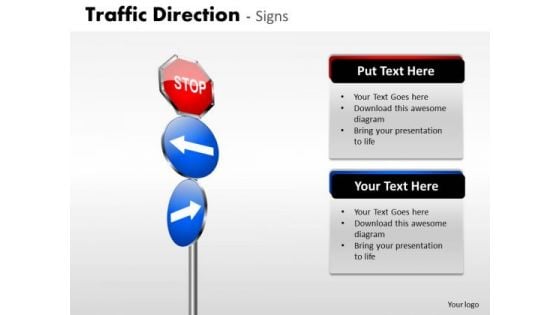
Business Framework Model Traffic Direction Signs Sales Diagram
Plan For All Contingencies With Our Business Framework Model Traffic Direction Signs Sales Diagram Powerpoint Templates. Douse The Fire Before It Catches.

Business Framework Model Directions Style 2 Strategy Diagram
Good Camaraderie Is A Key To Teamwork. Our Business Framework Model Directions Style 2 Strategy Diagram Powerpoint Templates Can Be A Cementing Force.
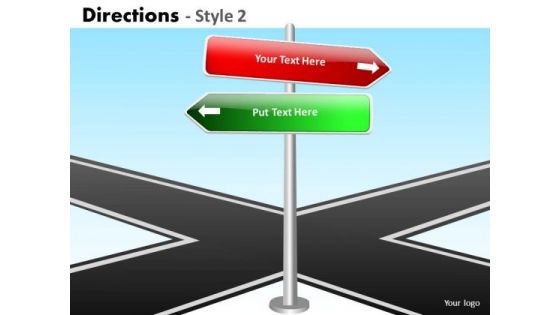
Business Framework Model Directions Style 2 Mba Models And Frameworks
Brace Yourself, Arm Your Thoughts. Prepare For The Hustle With Our Business Framework Model Directions Style 2 MBA Models And Frameworks Powerpoint Templates.


 Continue with Email

 Home
Home


